

US Monthly Used Car Market Data – September 2025
This report examines trends in dealership activity, sales volume, pricing, fuel types, body types, and regional performance across the US used vehicle market for September 2025. The analysis provides insights into state-wise dealership counts, the top states by sales volume, price band breakdowns, fuel preferences, and consumer tendencies by body type.
Number of Dealerships by State
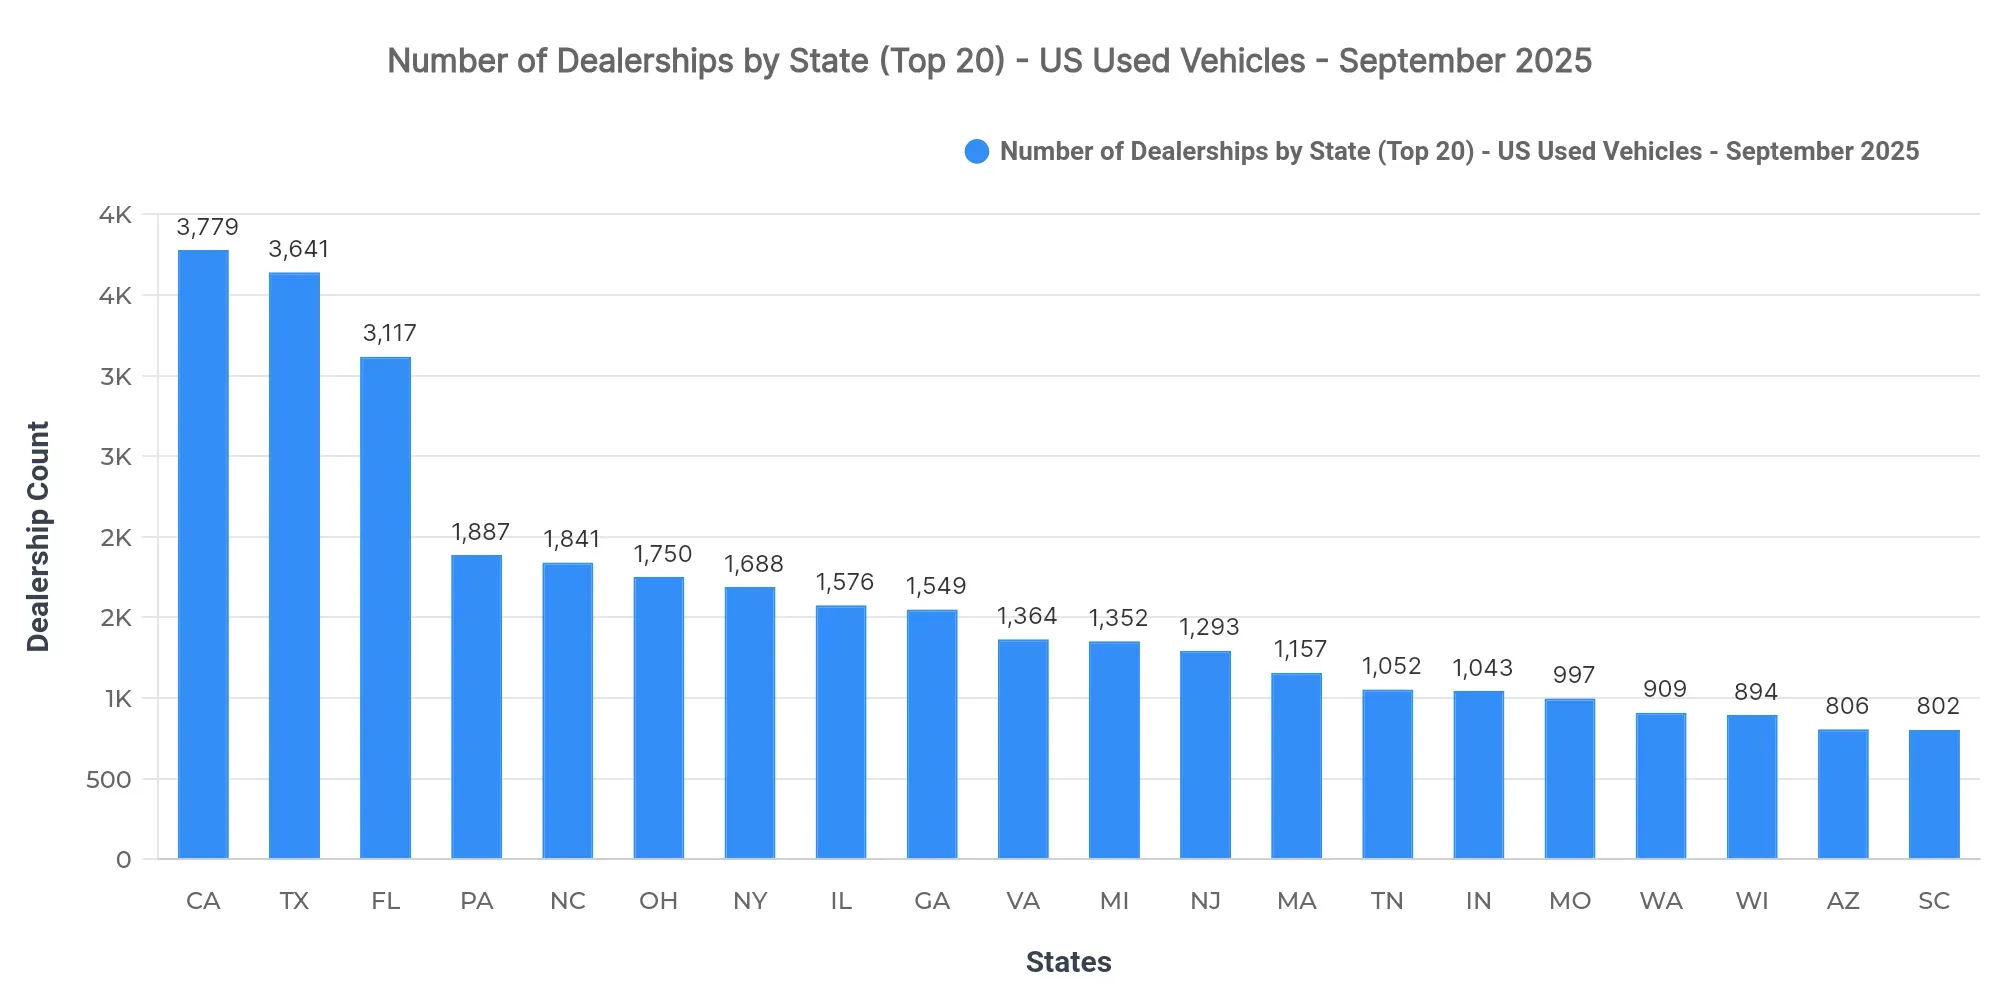
California (3,779), Texas (3,641), and Florida (3,117) lead in the number of dealerships, signifying significant market saturation in these areas. This concentration may indicate competitive pressures or opportunities for differentiation in offerings and service levels beyond price.
Top 10 States by Sold Volume
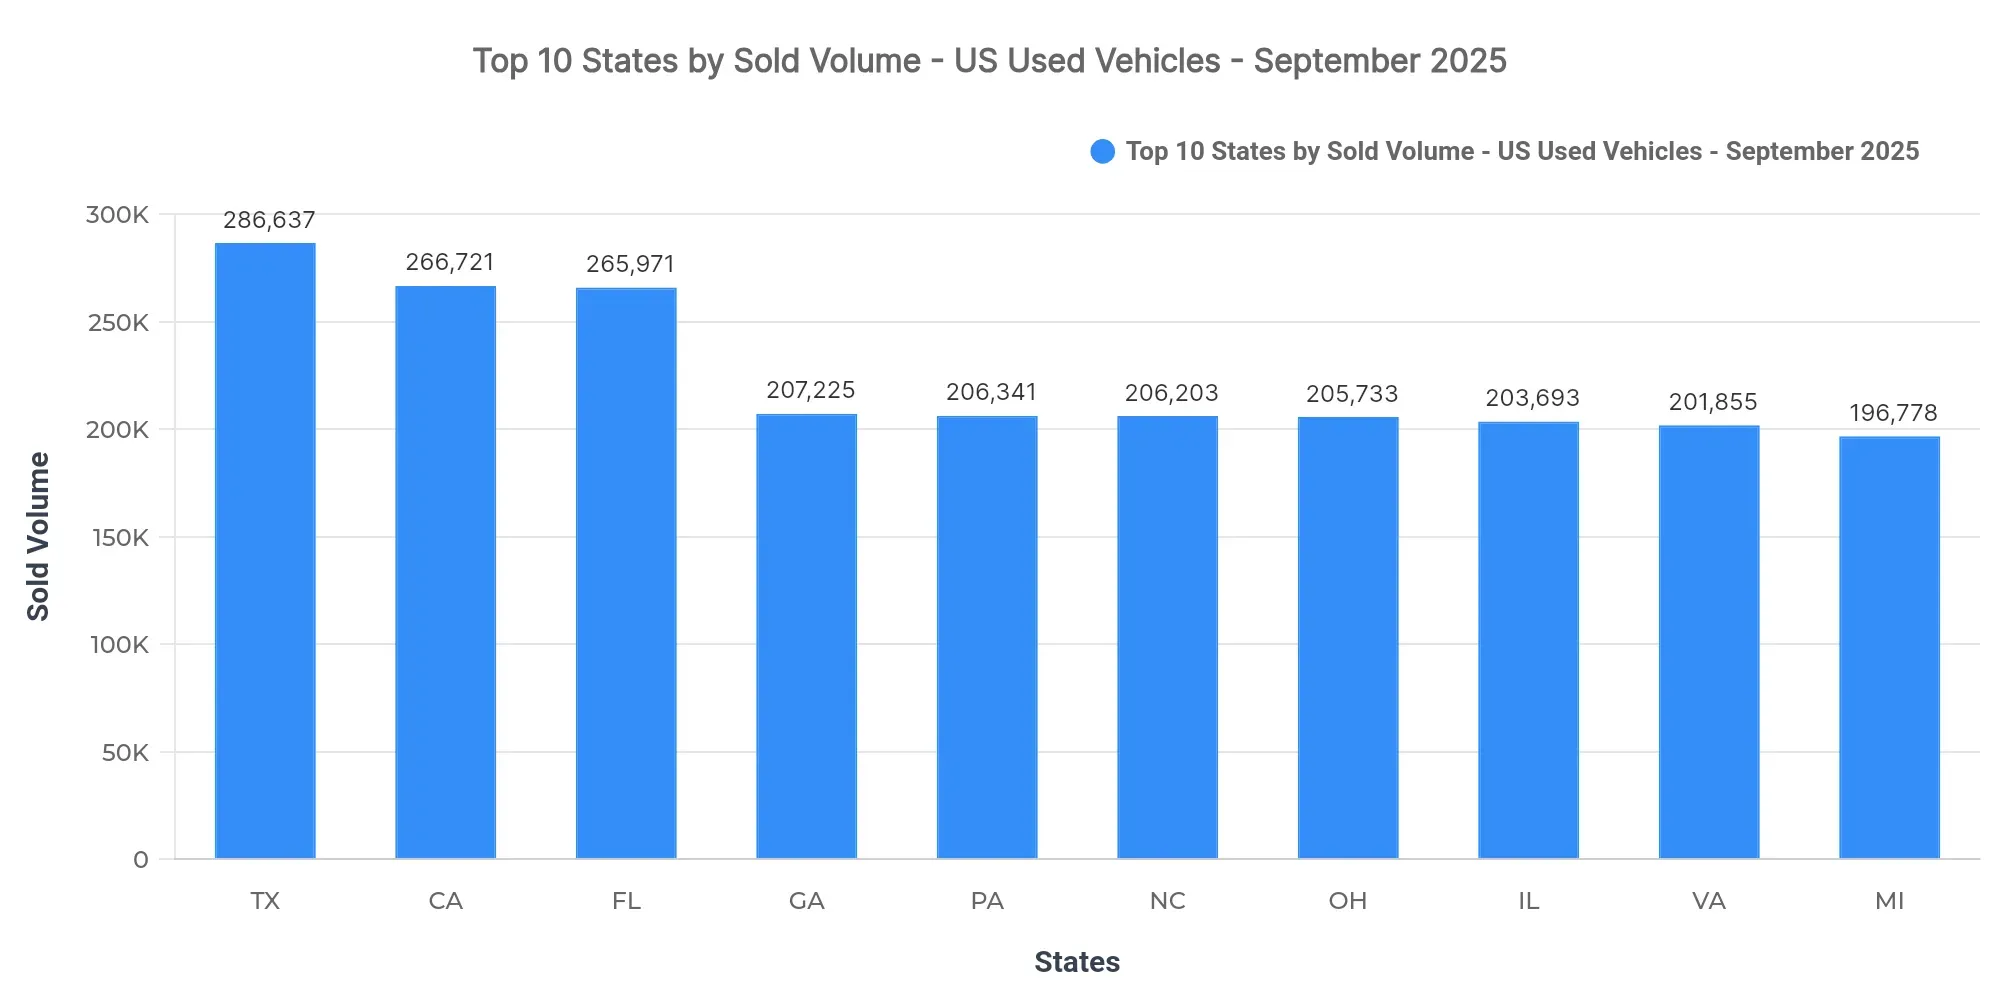
Texas (286,637), California (266,721), and Florida (265,971) lead in sold volumes, accounting for 11% of the national sold volume. The remaining top-10 states are Georgia, Pennsylvania, North Carolina, Ohio, Illinois, Virginia, and Michigan. The dominance of Texas, California, and Florida suggests a concentration in larger states, indicative of robust consumer demand in economically and demographically significant areas. Regional demand patterns show strong preferences in southern and western states, emphasizing the importance of regional marketing strategies.
Price Breakdown: Top 10 States by Sold Volume
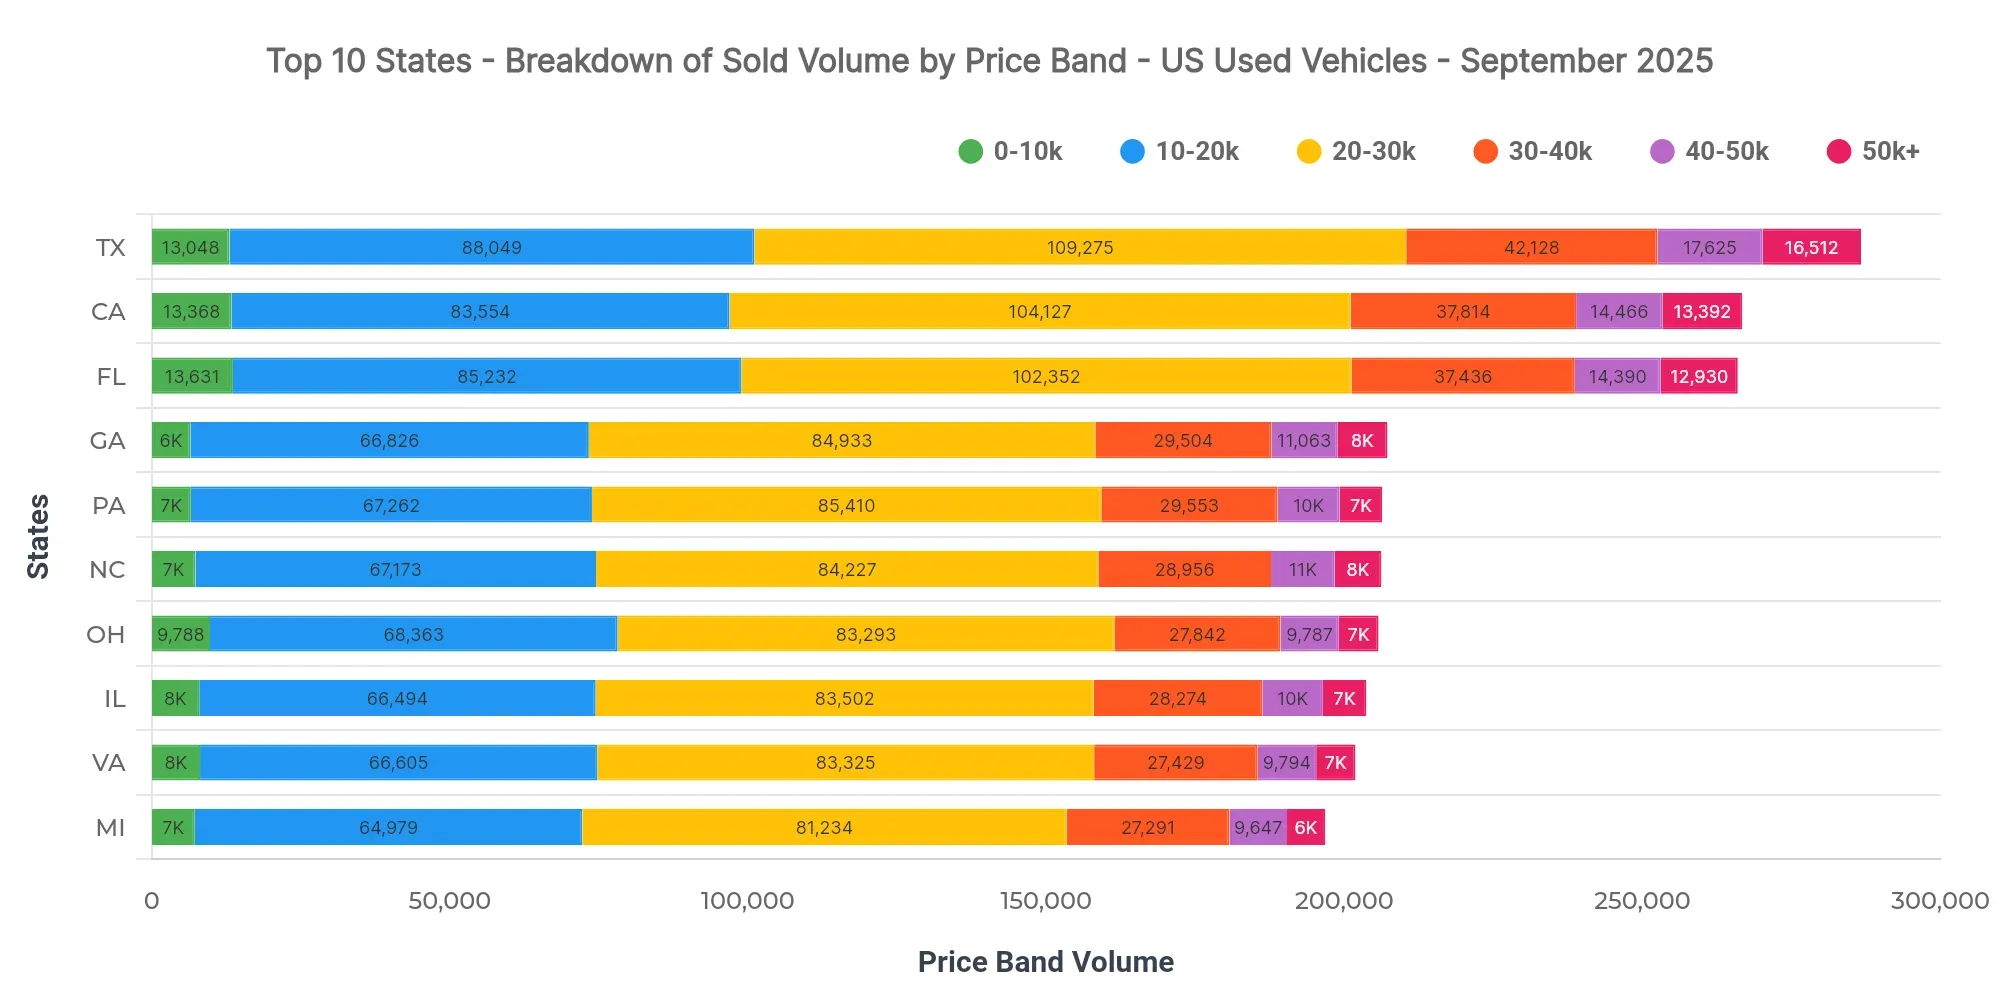
In Texas, the dominant price bands are $20K–$30K (38.1%), $10K–$20K (30.7%), and $30K–$40K (14.7%). Notably, the $40K–$50K band holds 6.1%. California at $26,003 and Florida at $25,488 show slightly higher average sold prices compared to Texas at $25,780. Dealers should consider competitive pricing strategies within these bands to capitalize on predominant interest. Pricing trends suggest affordability remains key, but there's also room for premium offerings in higher bands.
Market Breakdown by Fuel Types
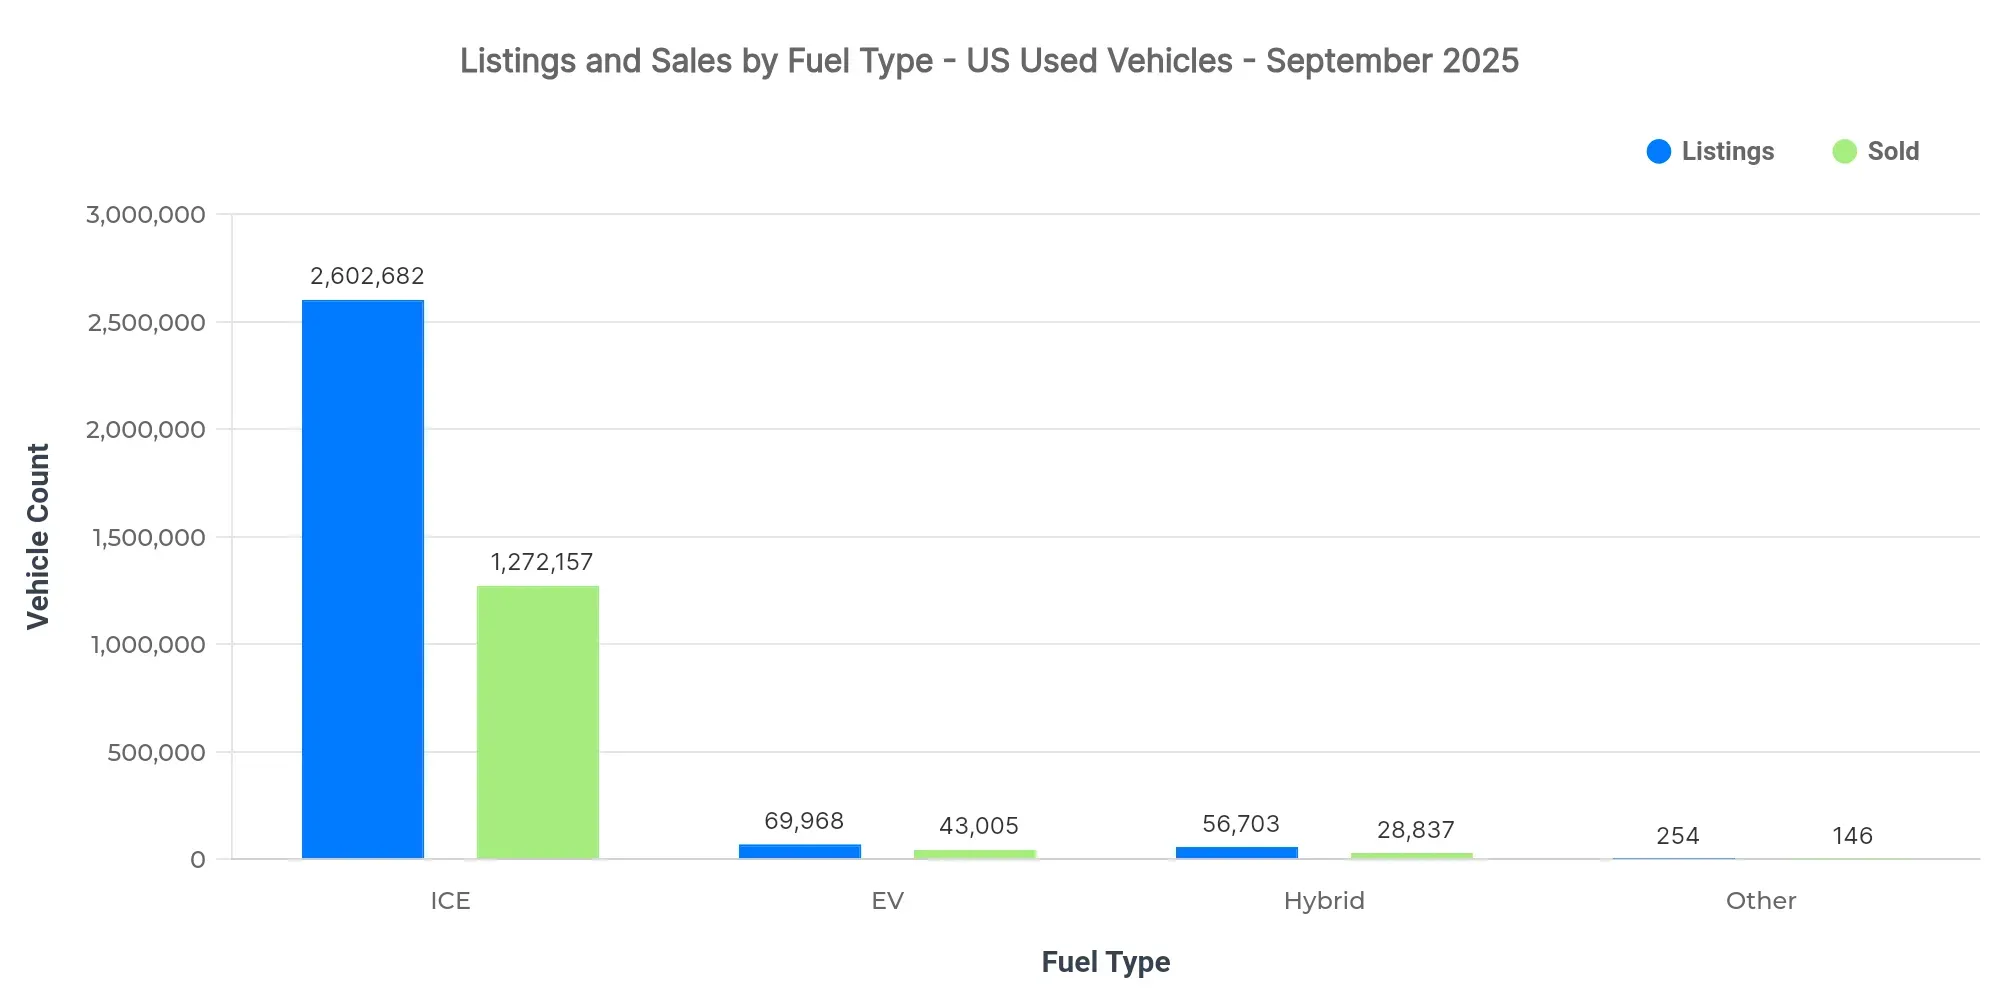
| Fuel Type | Listings Count | Sold Count | Avg Listing Price | Avg Sold Price |
|---|---|---|---|---|
| ICE | 2.60M | 1.27M | $25,242 | $25,289 |
| EV | 69.97K | 43,005 | $35,993 | $32,424 |
| Hybrid | 56.70K | 28,837 | $29,116 | $27,129 |
| Other | 254 | 146 | $13,777 | $13,101 |
- Electric vehicles are gaining traction but remain a smaller segment compared to ICE.
- EV listings and sold prices remain at a premium, indicating a niche market.
- ICE continues to dominate with the highest number of listings and sales, reflecting enduring consumer preference.
Market Share by Body Types
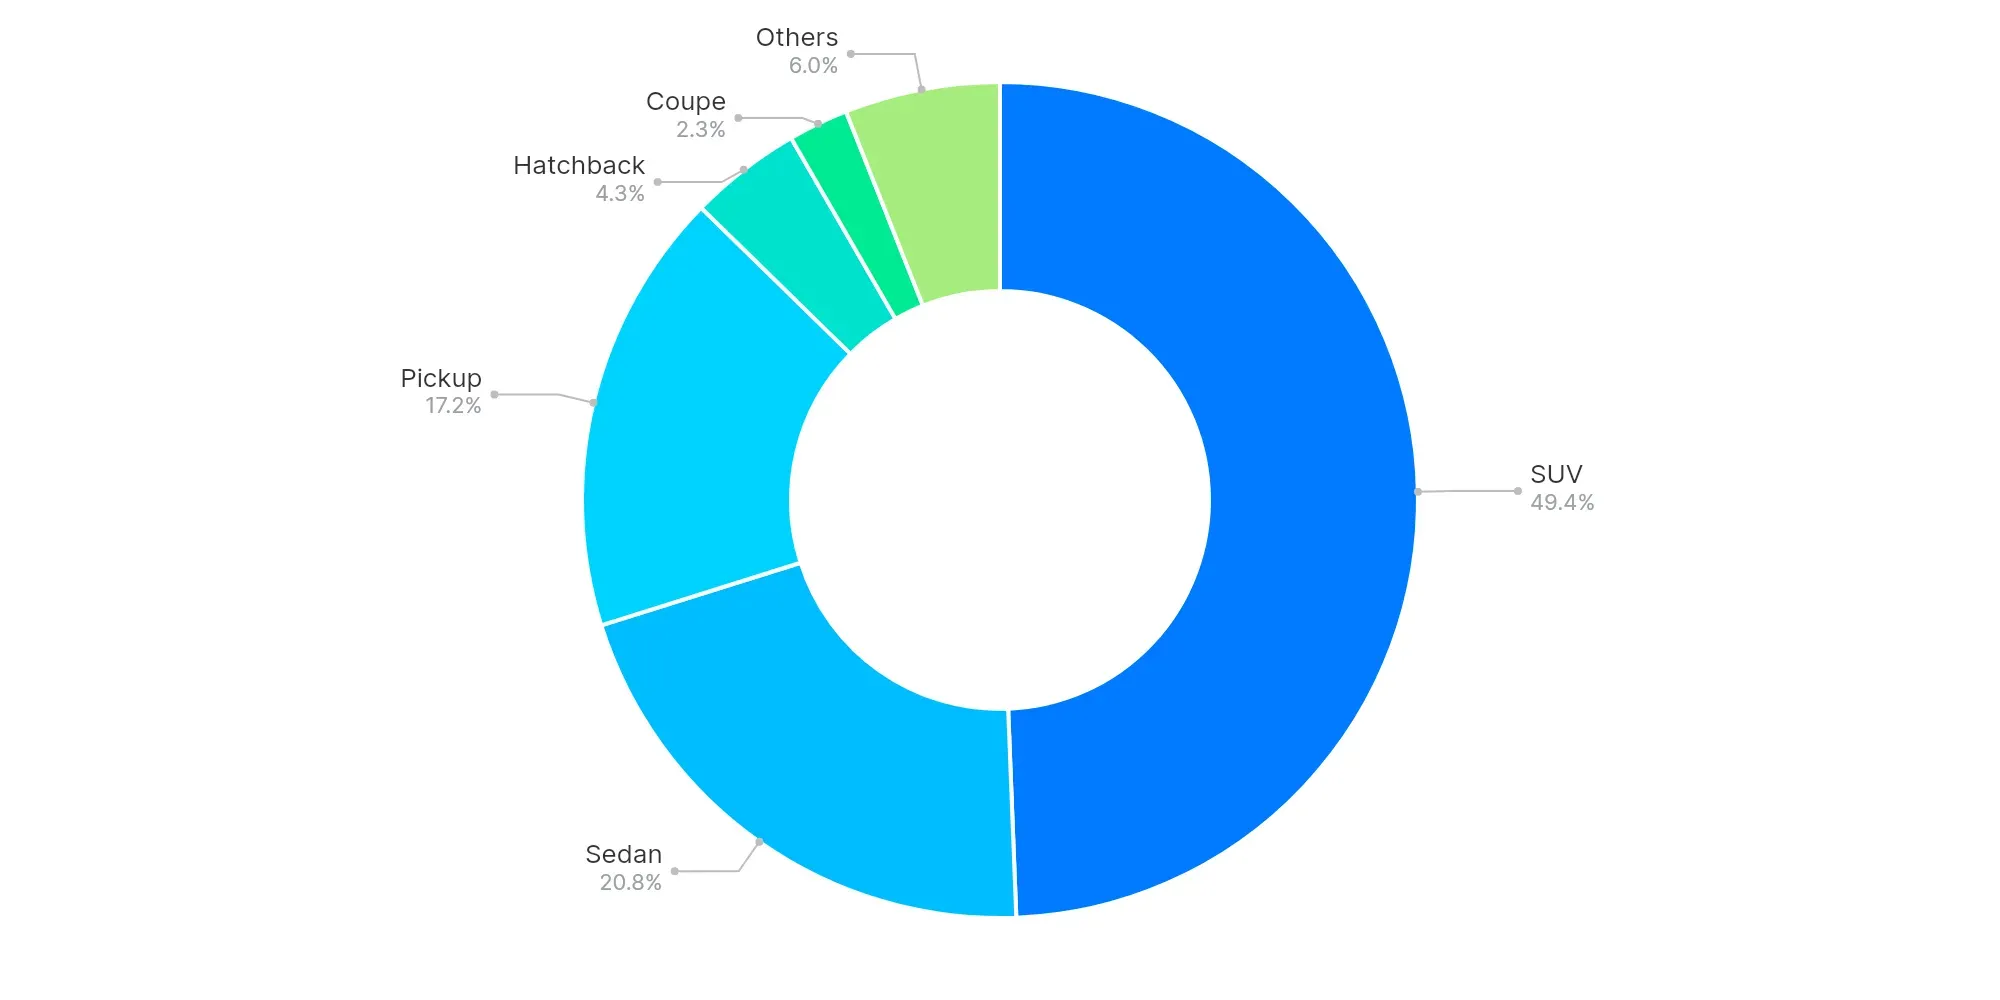
SUVs (49.4%), Sedans (20.8%), and Pickups (17.2%) dominate the market. Larger vehicle segments like SUVs and Pickups show strong consumer preference, underscoring an enduring trend towards versatile and utility-capable vehicles.
High-Volume vs Low-Volume States (Executive Insights)
- Top-performing states: Texas, California, Florida
- Underpenetrated regions: American Samoa, Northern Mariana Islands, Guam
- Key price bands: $20K–$30K, $10K–$20K
- EV trend: Rising but niche with premium pricing
- Buyer preferences: Predominantly SUVs and larger vehicles
The market direction points toward stability with strong regional performances in large states like Texas and California. For dealers, optimizing inventory to match local consumer preferences and focusing on targeted regional marketing can prove beneficial. Analysts should consider these trends for strategic planning to sustain momentum in high-demand vehicle segments and fuel types.