

US Monthly Used Car Market Data – December 2023
The December 2023 report provides an in-depth analysis of the US used vehicle market, examining dealer activity, sales volume, pricing trends, fuel type distribution, body type preferences, and regional market dynamics. This report highlights the ongoing shifts in consumer behavior, regional performances, and the implications for stakeholders in the industry.
Number of Dealerships by State
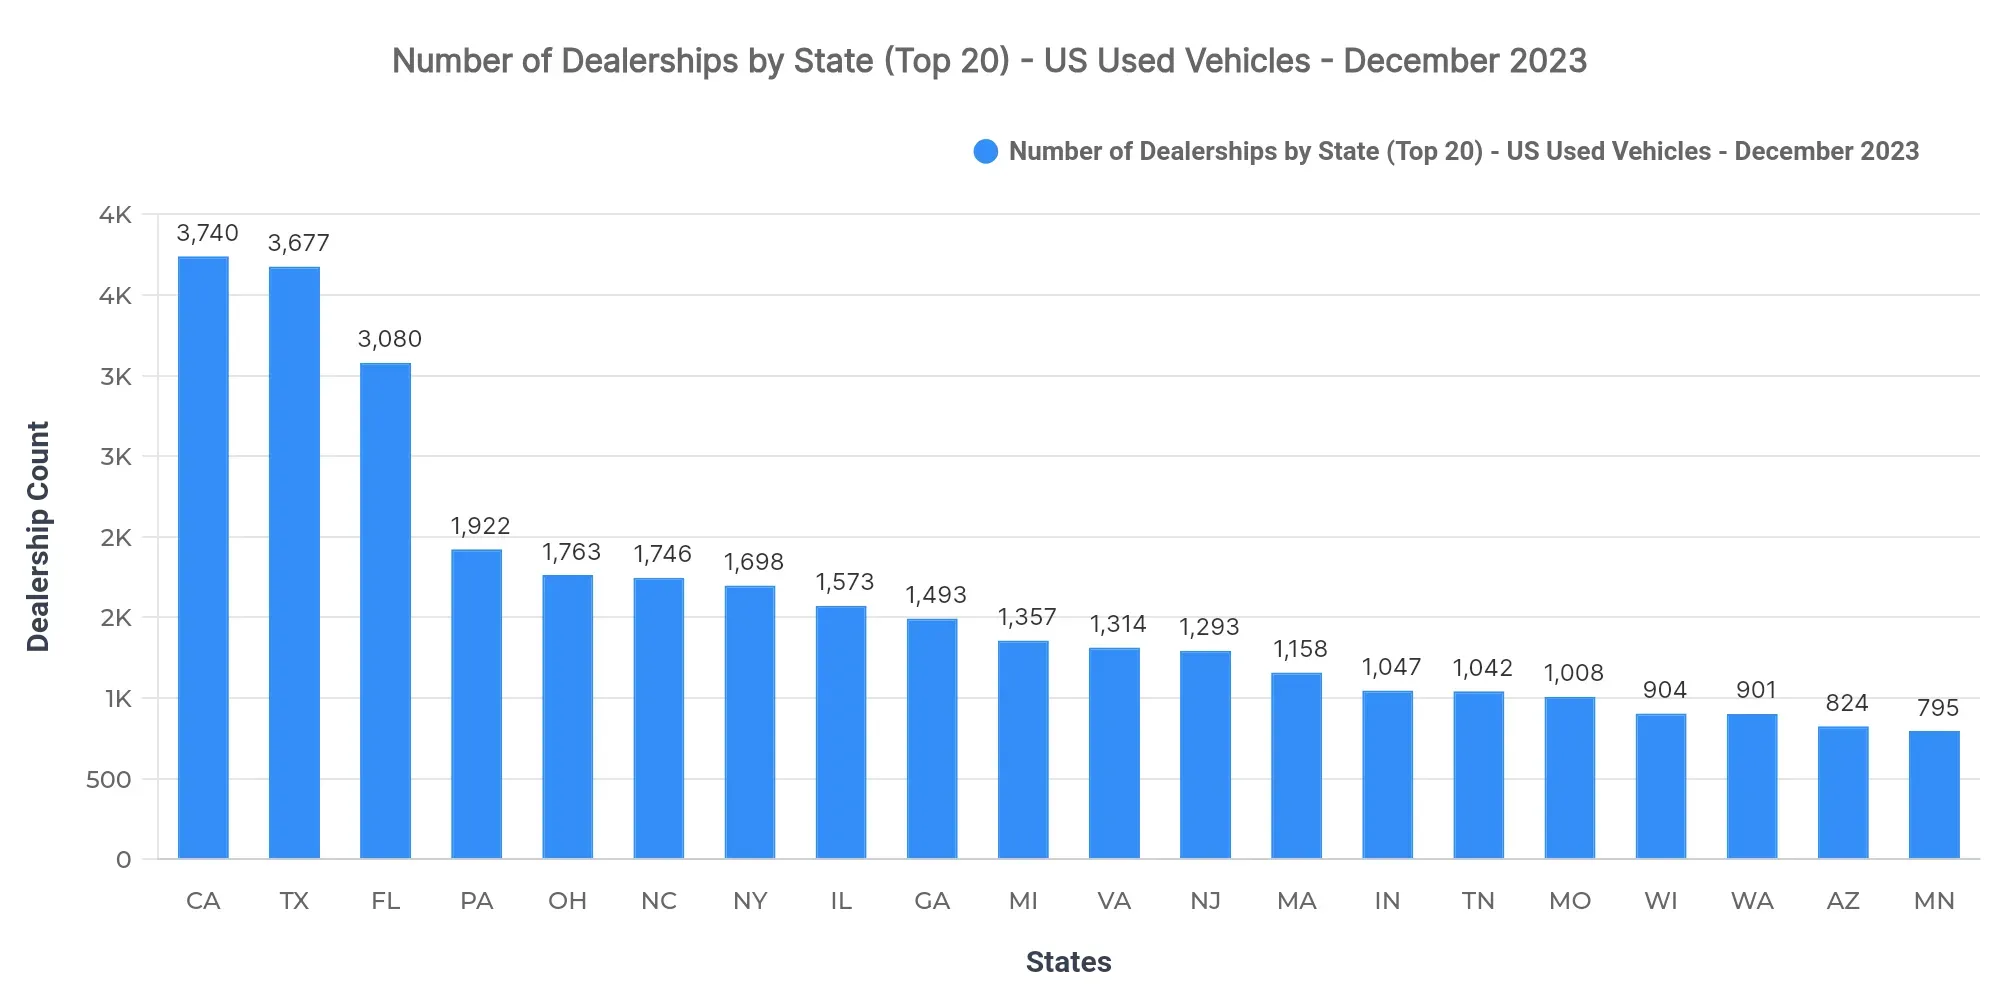
California (3,740), Texas (3,677), and Florida (3,080) lead in the number of dealerships. These states indicate a high market concentration, likely reflecting their large populations and diverse economies. The concentration of dealerships in these states suggests a mature market with intense competition, necessitating strategic differentiation for dealers.
Top 10 States by Sold Volume
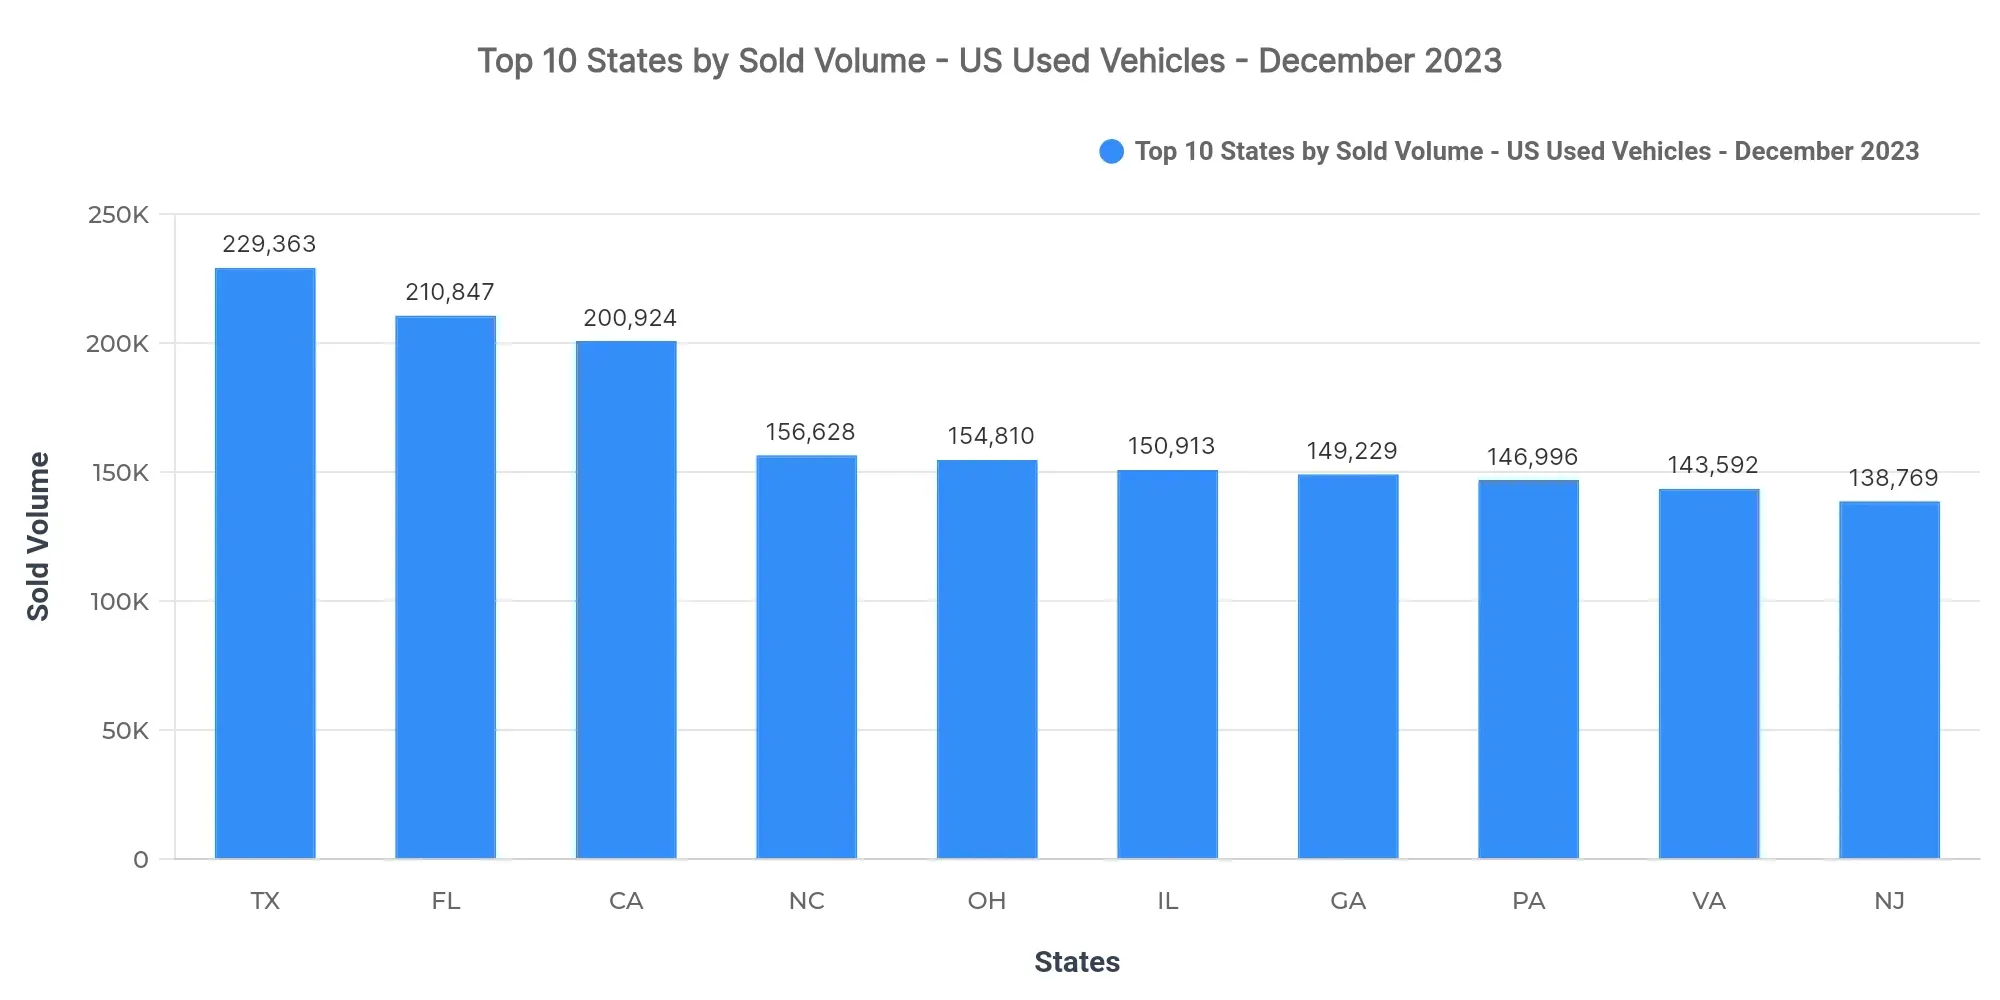
Texas (229,363), Florida (210,847), and California (200,924) lead in sold volume, collectively accounting for 12.2% of the national sold volume. The remaining top-10 states are North Carolina, Ohio, Illinois, Georgia, Pennsylvania, Virginia, and New Jersey.
The high concentration of sales within these top states highlights the regional saturation and a potential need for expansion into less penetrated areas. Regional demand patterns show a strong preference for affordability and utility, typical in populous and economically diverse states.
Price Breakdown: Top 10 States by Sold Volume
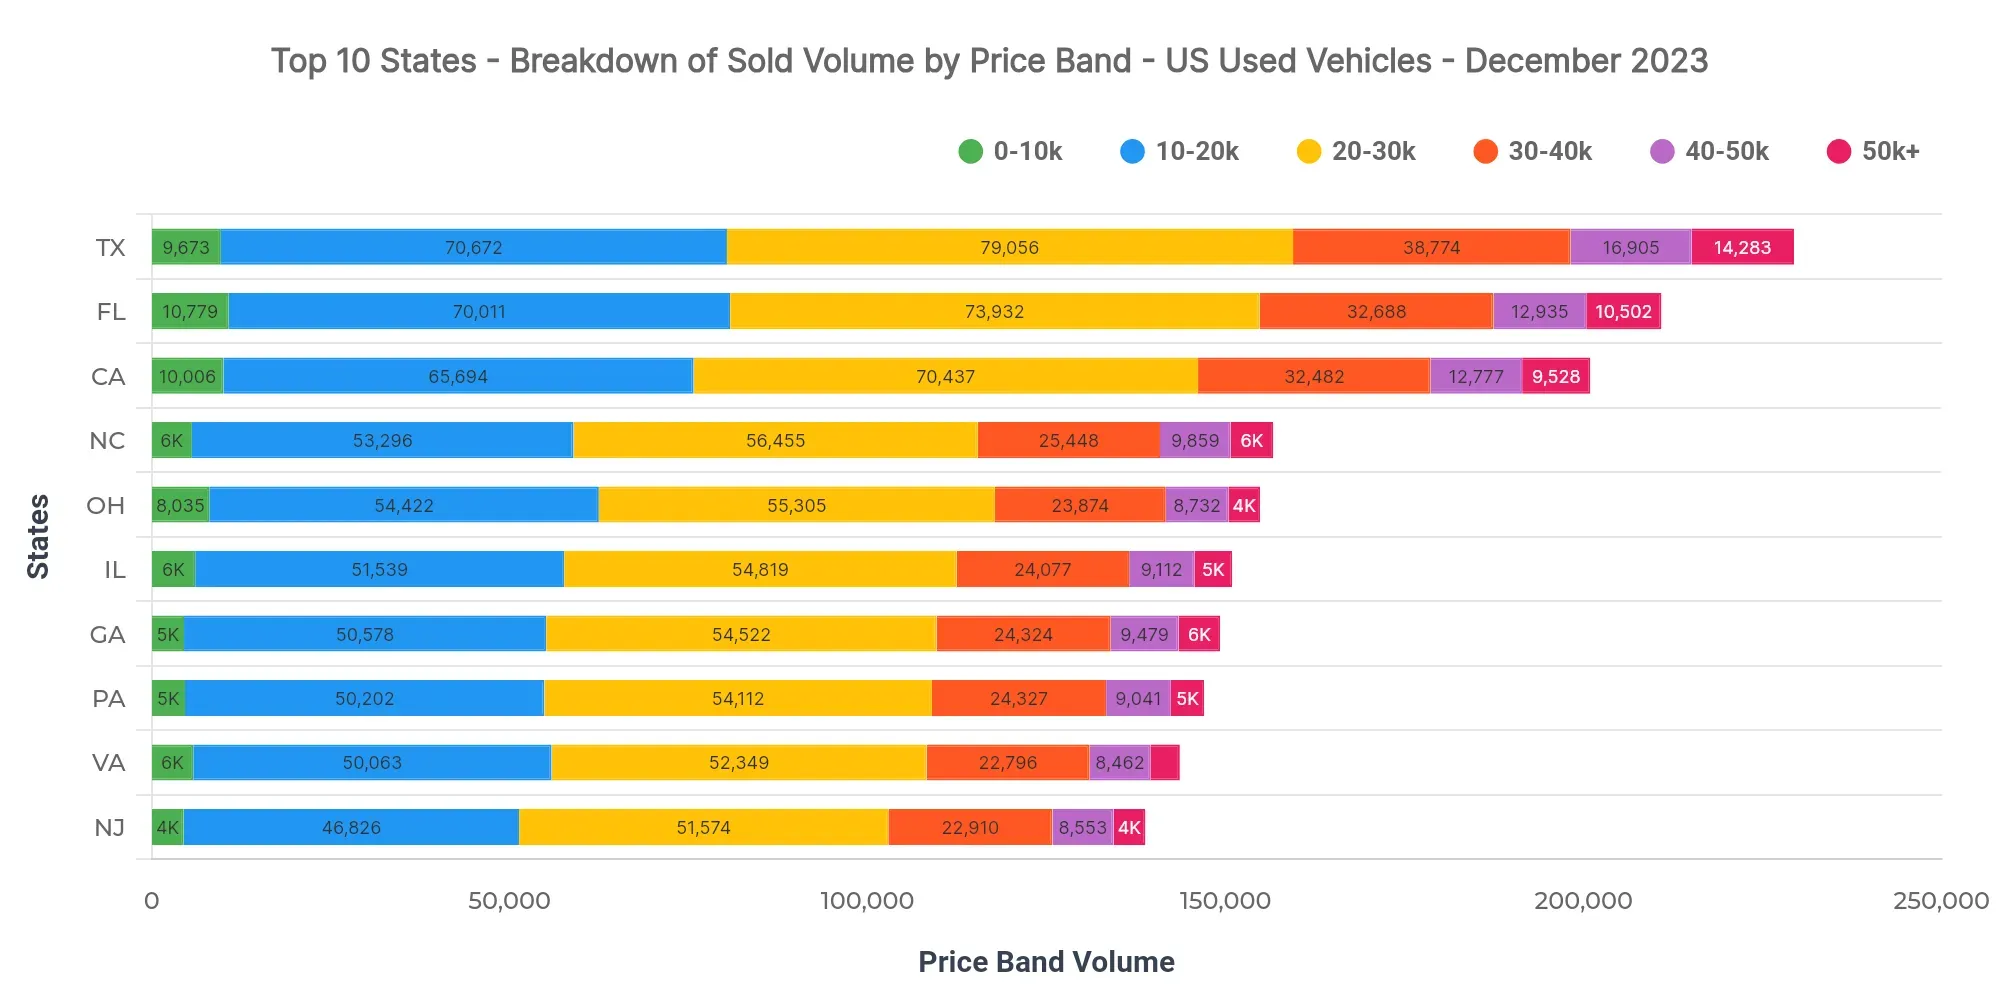
Focusing on Texas, the dominant price bands are $20K–$30K (34.5%), $10K–$20K (30.8%), and $30K–$40K (16.9%). The $40K–$50K band holds a 7.4% share, indicating a modest upper-price segment. Comparatively, Florida's average sold price is $25,822 and California's is $26,469.
For dealers, these price bands highlight the critical need to stock varied inventory across different price points. Pricing insights suggest lenders focus on competitive financing options in the most popular bands to attract more buyers.
Market Breakdown by Fuel Types
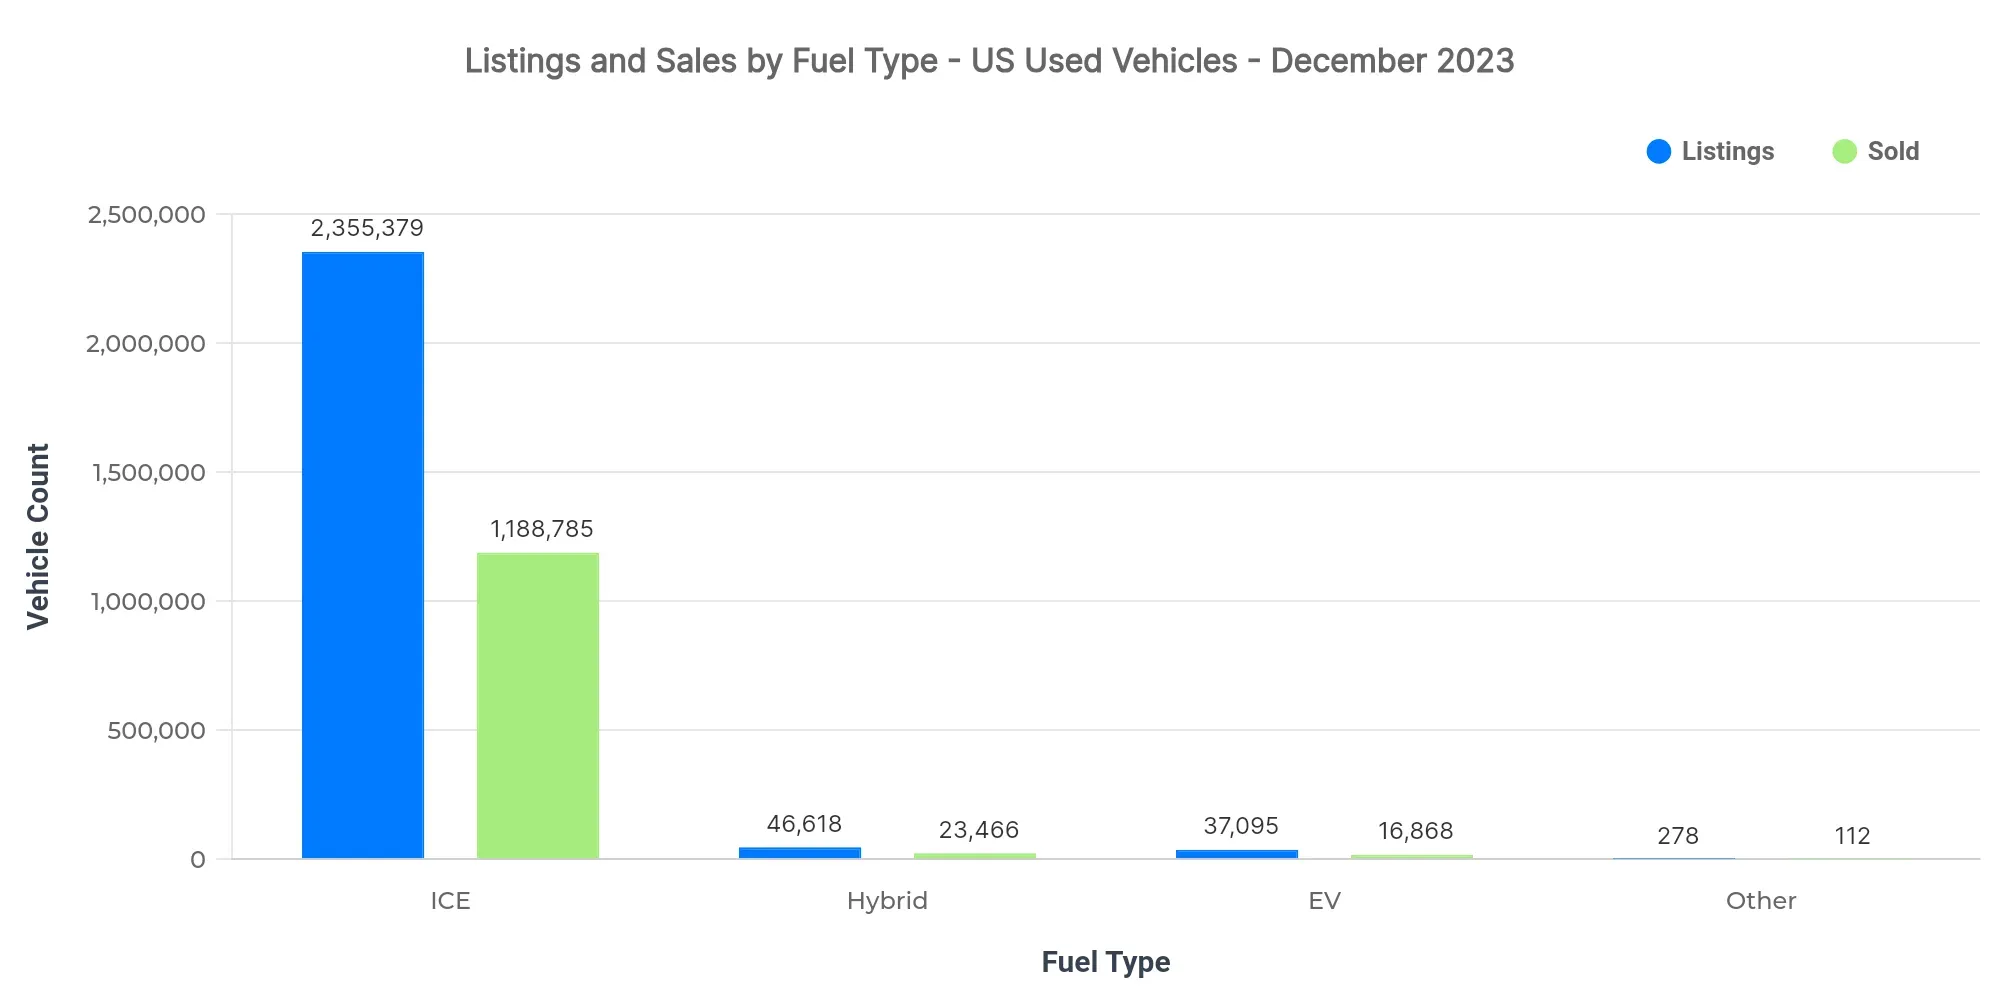
| Fuel Type | Listings Count | Sold Count | Avg Listing Price | Avg Sold Price |
|---|---|---|---|---|
| ICE | 2.36M | 1.19M | $26,436 | $25,499 |
| Hybrid | 46.62K | 23.47K | $28,747 | $26,483 |
| EV | 37.10K | 16.87K | $40,249 | $38,062 |
| Other | 278 | 112 | $16,058 | $14,876 |
- EV adoption remains modest but with higher listing and sold prices, indicating premium positioning.
- ICE vehicles dominate both listings and sold counts, emphasizing their market stability and continuing consumer demand.
- Price differentiation across fuel types suggests varied consumer interest and price sensitivity, influencing market dynamics.
Market Share by Body Types
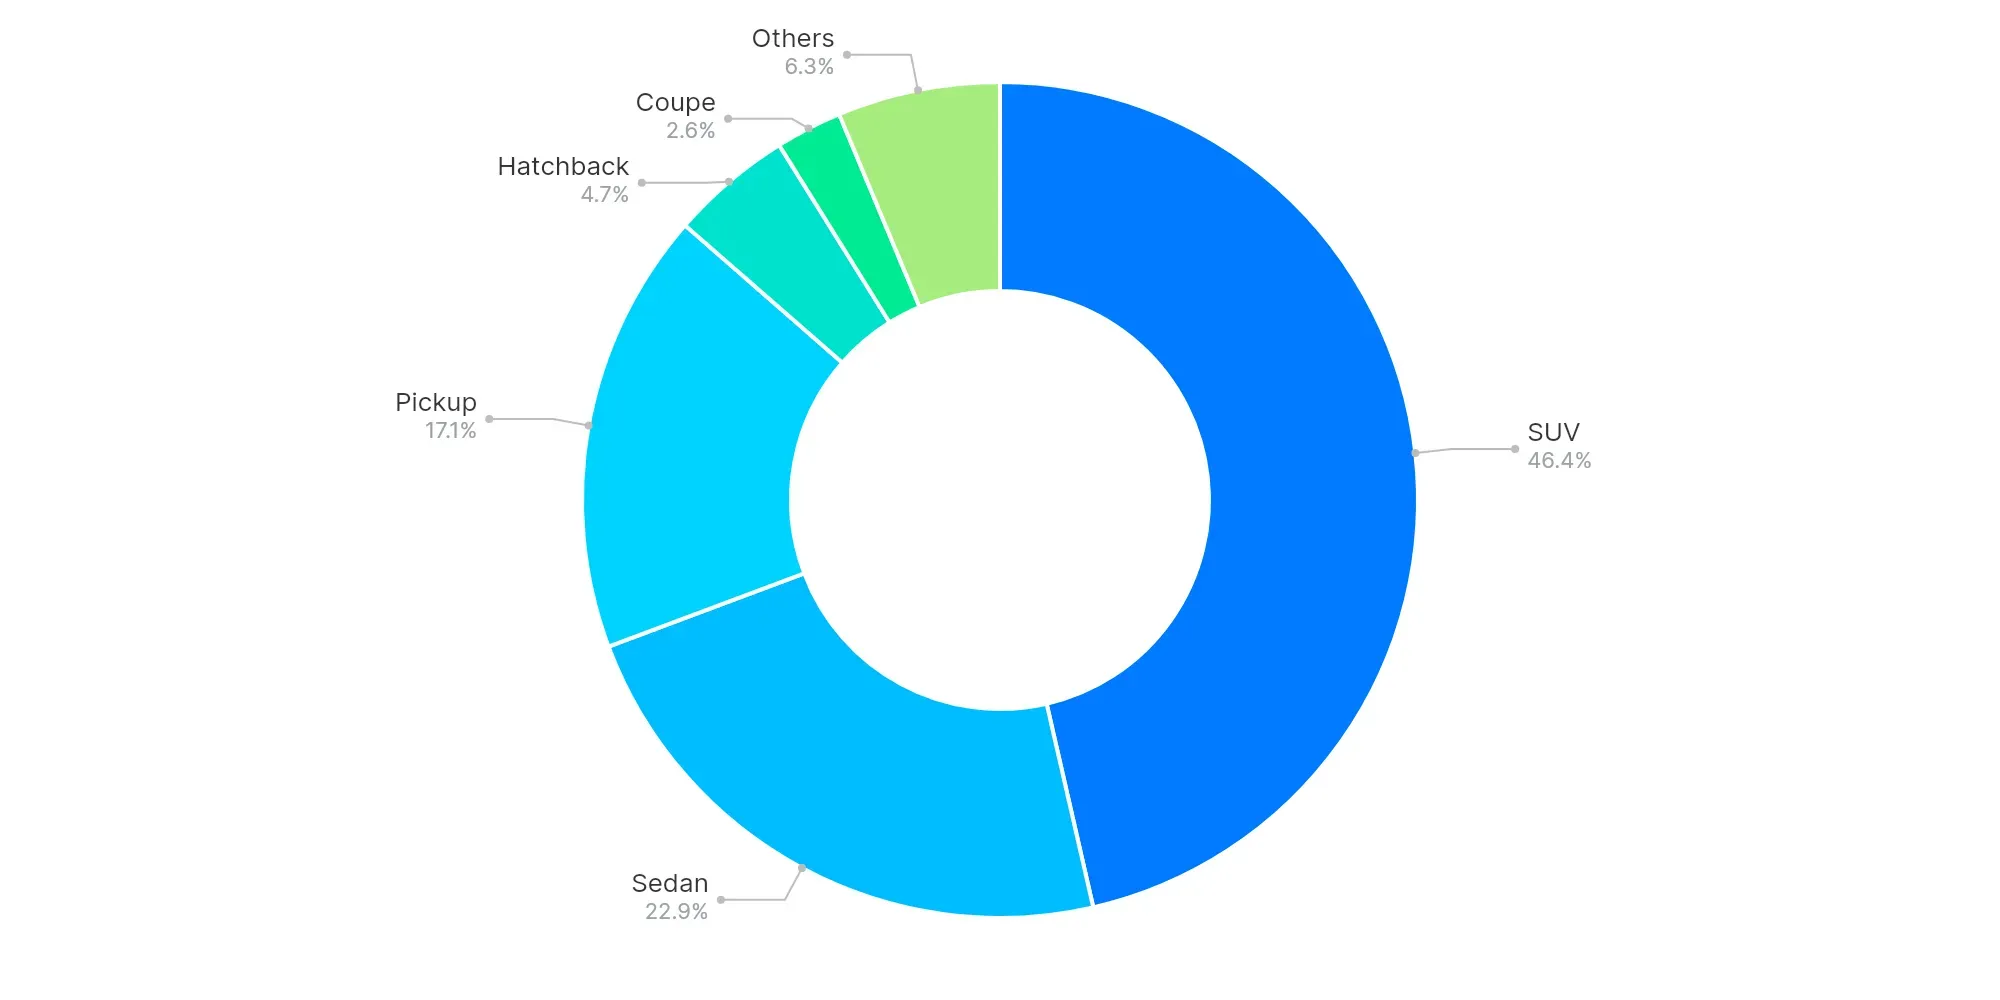
SUV (46.4%), Sedan (22.9%), and Pickup (17.1%) dominate the market, reflecting consumer preference for larger vehicle segments like SUVs and Pickups. This trend underscores the American consumer's sustained inclination toward more spacious and versatile vehicles.
High-Volume vs Low-Volume States (Executive Insights)
- Texas, Florida, and California lead sold volumes.
- Underpenetrated regions include Virgin Islands, American Samoa, and Northern Mariana Islands.
- Key price bands include $20K–$30K, $10K–$20K, and $30K–$40K.
- EV adoption remains niche but growing.
- Buyers prefer SUVs and Pickups, emphasizing utility and space.
The US used car market continues to evolve, with strong regional variances and significant trends in pricing and vehicle preference. Dealers should focus on strategic inventory management and customer engagement to capitalize on regional market strengths and emerging trends in fuel and body type preferences.