

US Monthly Used Car Market Data – December 2024
This report analyzes the US used vehicle market's December 2024 data, providing insights into dealer activity, sales volume, pricing, fuel types, body types, and regional performance.
Number of Dealerships by State
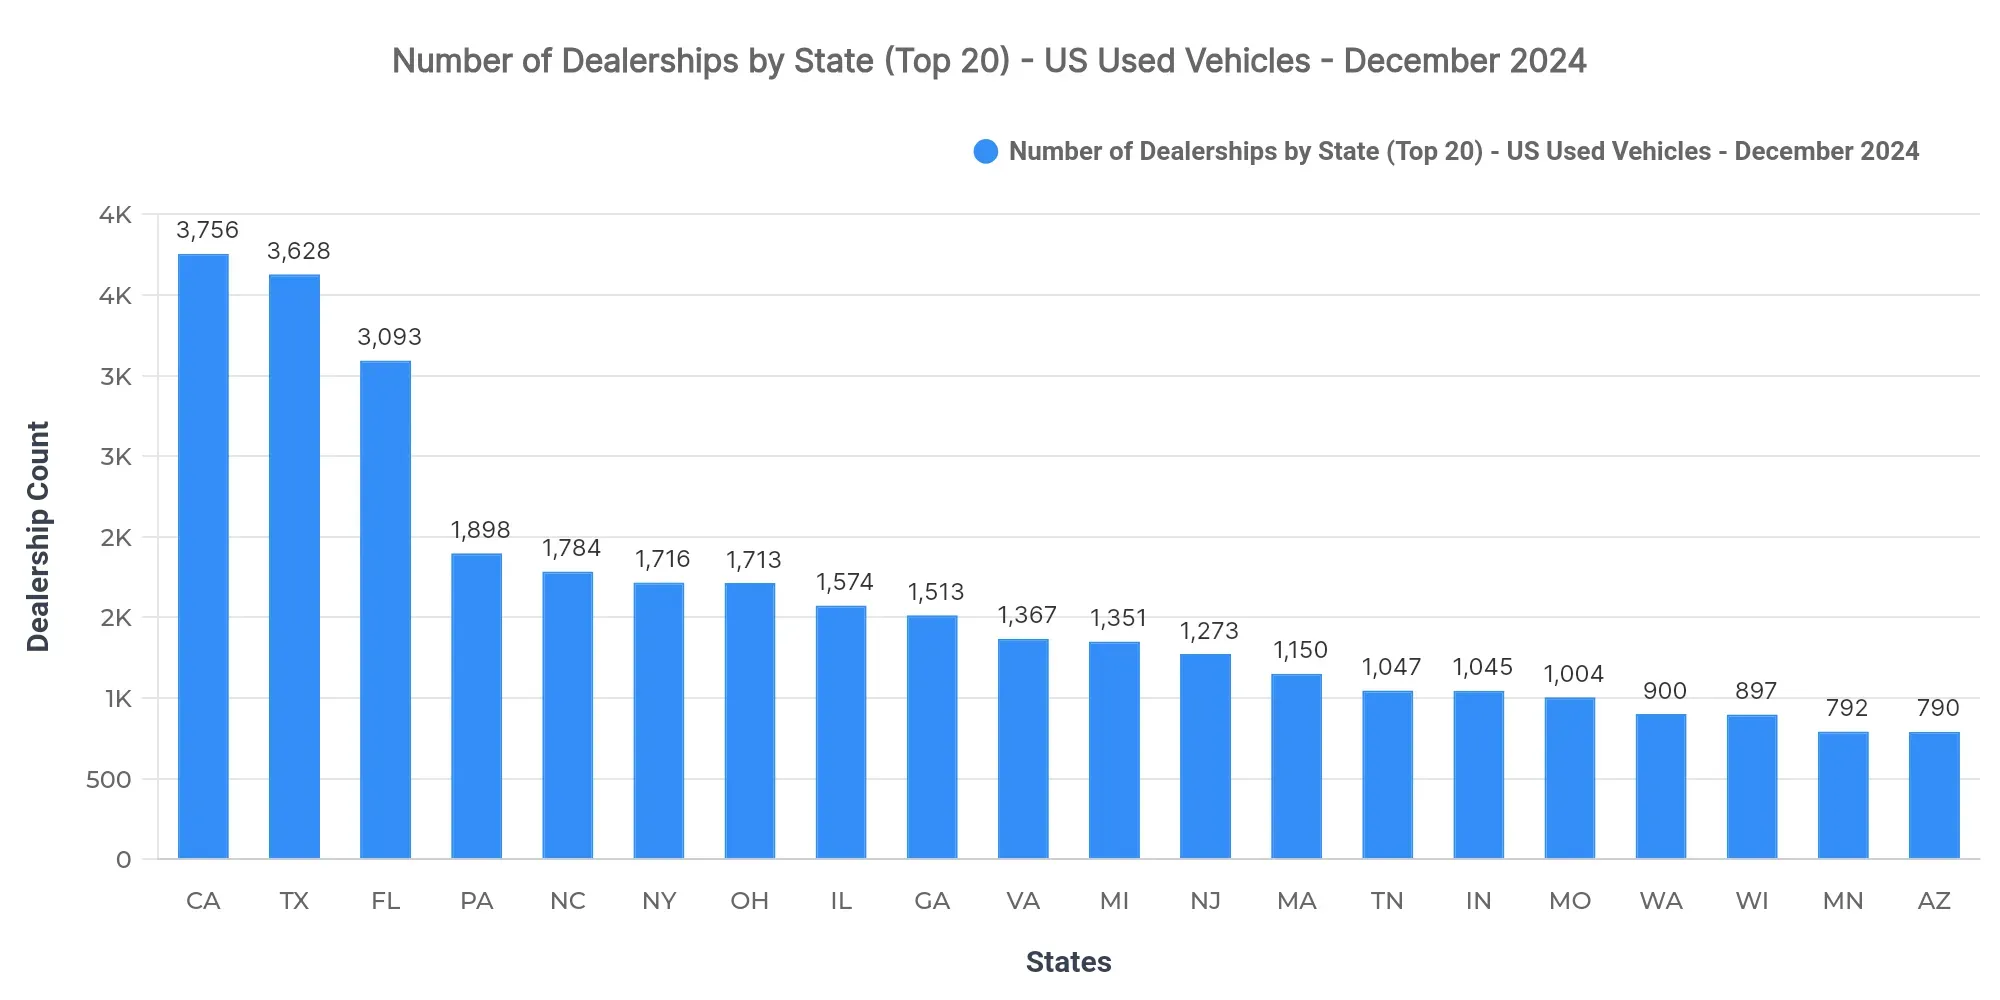
California (3,756), Texas (3,628), and Florida (3,093) lead in the number of dealerships. These states demonstrate significant market concentration, suggesting potential saturation where dealership competition might be fiercest.
Top 10 States by Sold Volume
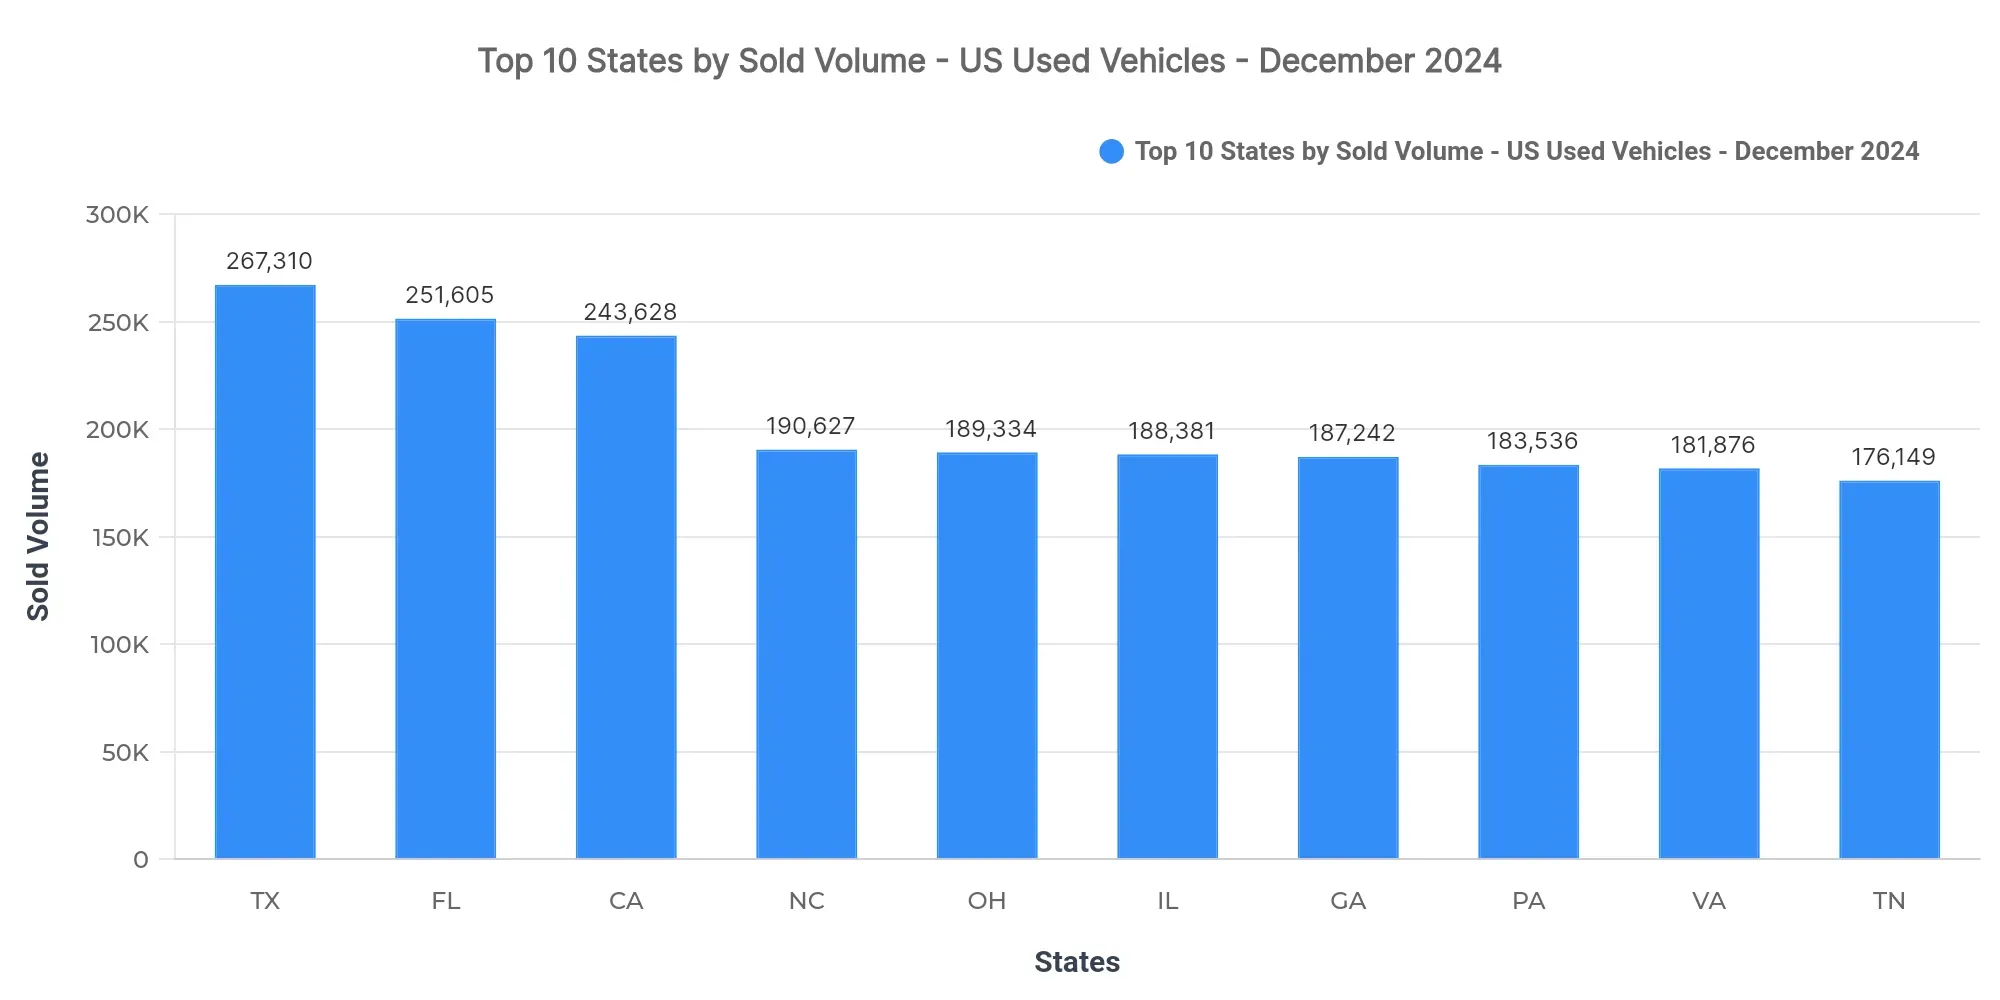
Texas (267,310), Florida (251,605), and California (243,628) lead in sold volume, collectively accounting for 11.4% of the national total. The remaining top-10 states are North Carolina, Ohio, Illinois, Georgia, Pennsylvania, Virginia, and Tennessee.
States dominating the market signify possible high brand loyalty and dealer influence. Conversely, regional demand patterns suggest opportunities for expansion in the Midwest where growth may be paced by economic factors and local preferences.
Price Breakdown: Top 10 States by Sold Volume
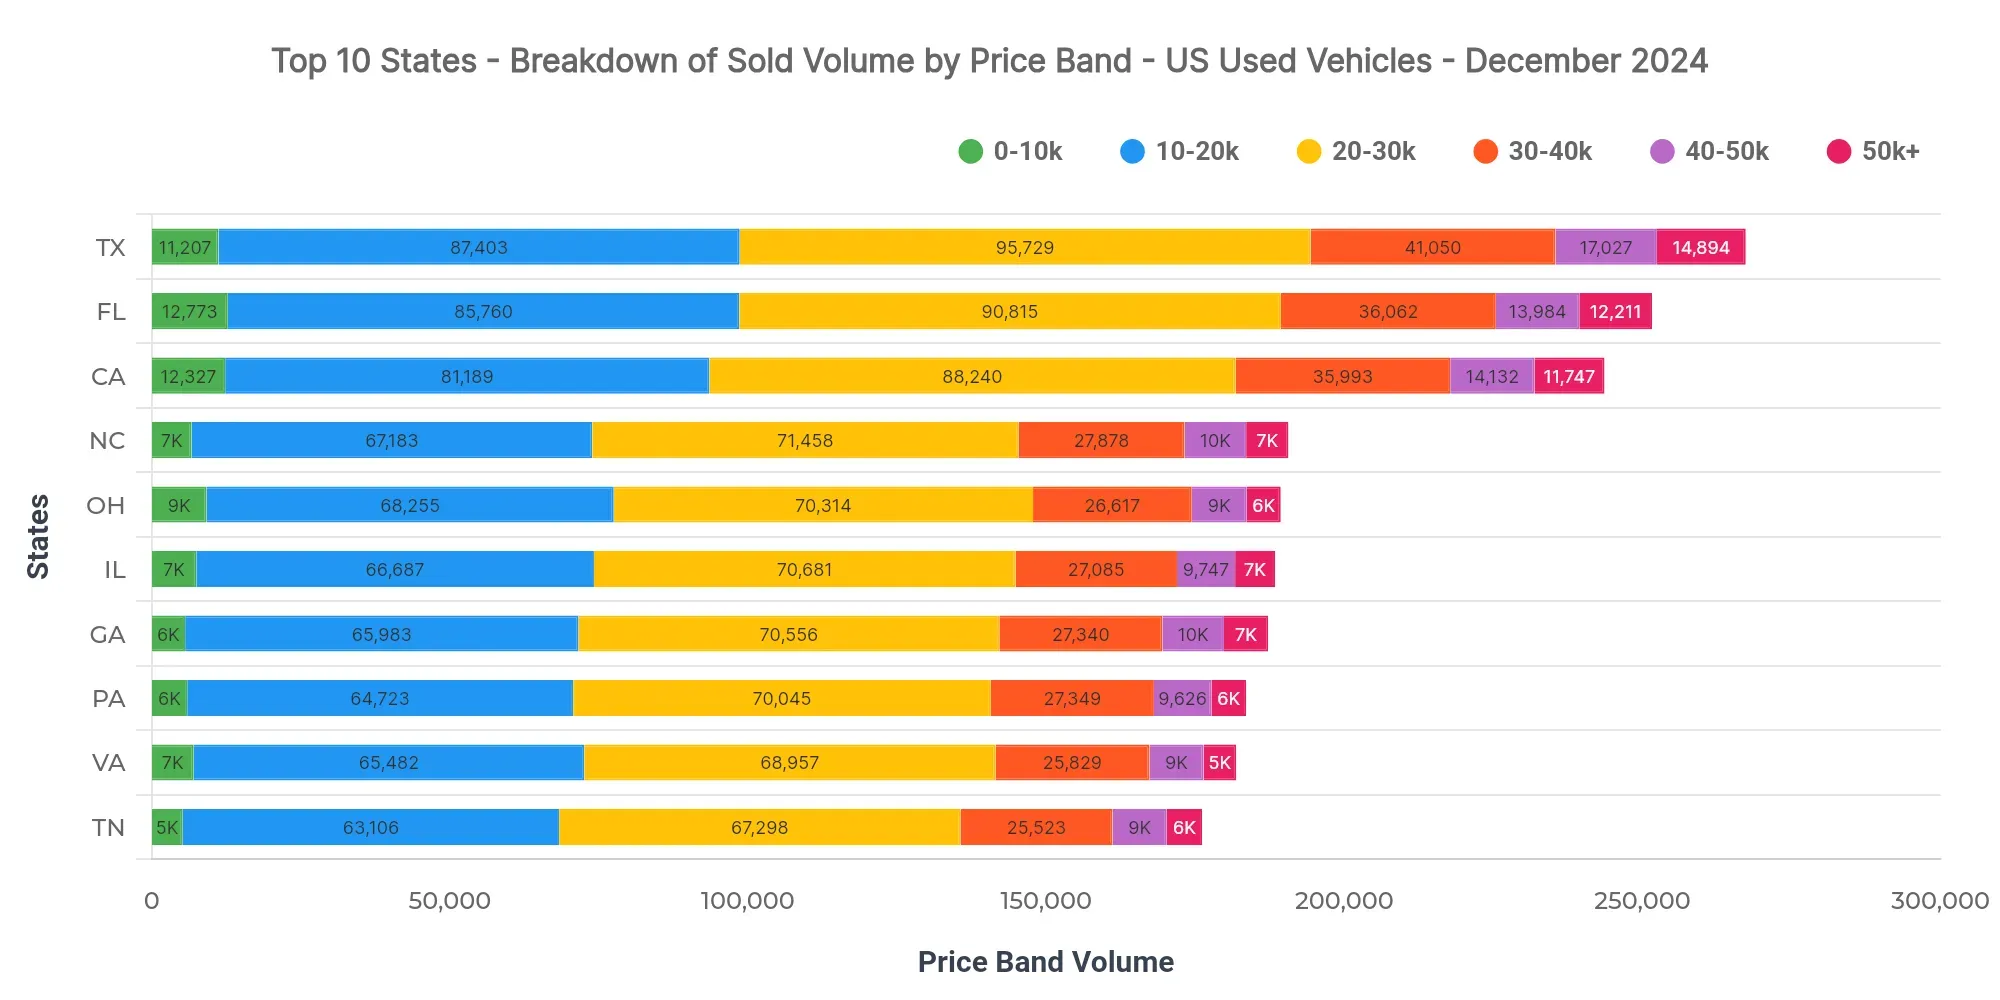
In Texas, the dominant price bands are $20K–$30K (35.8%), $10K–$20K (32.7%), and $30K–$40K (15.4%). The $40K–$50K band also contributes significantly at 6.4%. Comparatively, Florida at $25,457 and California at $25,937 display differing price dynamics.
Dealers can leverage the popularity of mid-range vehicles in Texas, while lenders could focus on tailoring finance packages to fit these bands.
Market Breakdown by Fuel Types
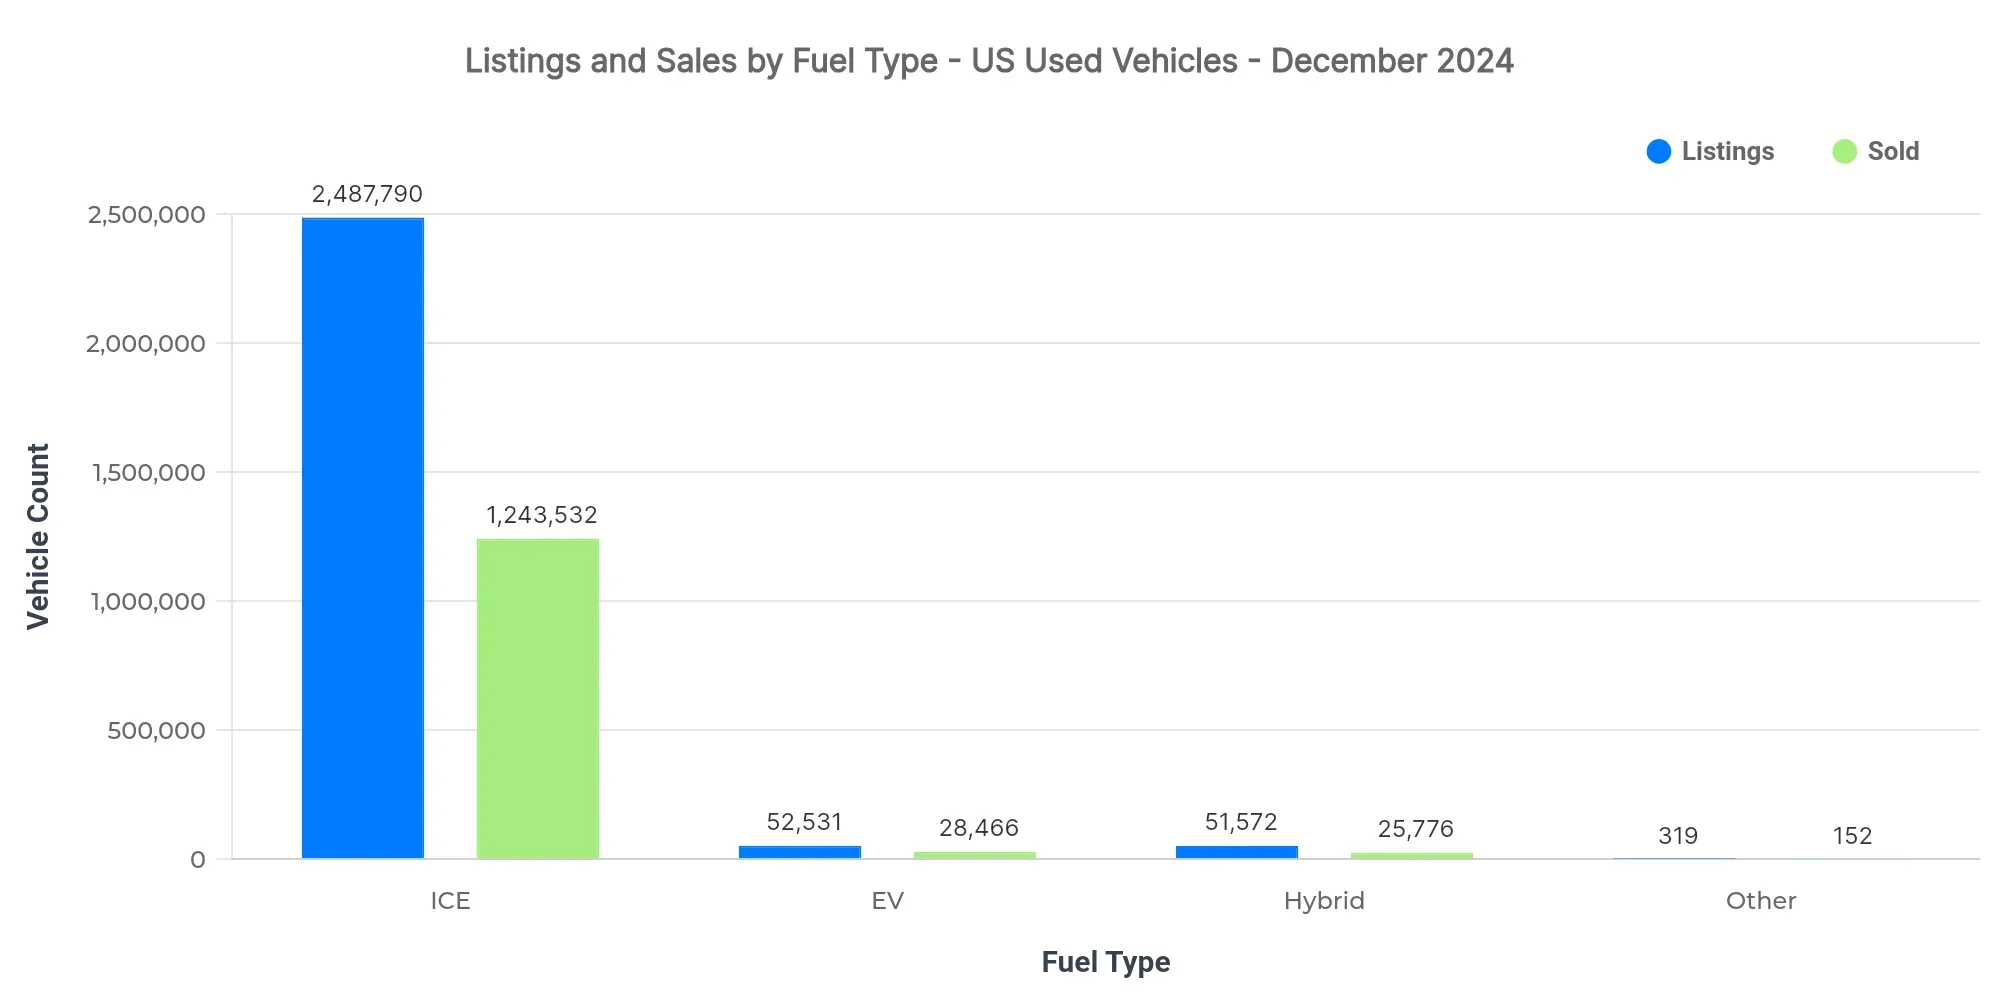
| Fuel Type | Listings Count | Sold Count | Avg Listing Price | Avg Sold Price |
|---|---|---|---|---|
| ICE | 2.49M | 1.24M | $24,980 | $25,370 |
| EV | 52,531 | 28,466 | $34,609 | $31,520 |
| Hybrid | 51,572 | 25,776 | $28,066 | $26,829 |
| Other | 319 | 152 | $15,523 | $18,368 |
- EV adoption remains niche but shows a healthy growth trajectory.
- ICE vehicles dominate traditional markets, presenting more stable pricing.
- Hybrids maintain moderate market penetration, with price positioning influencing adoption levels.
Market Share by Body Types
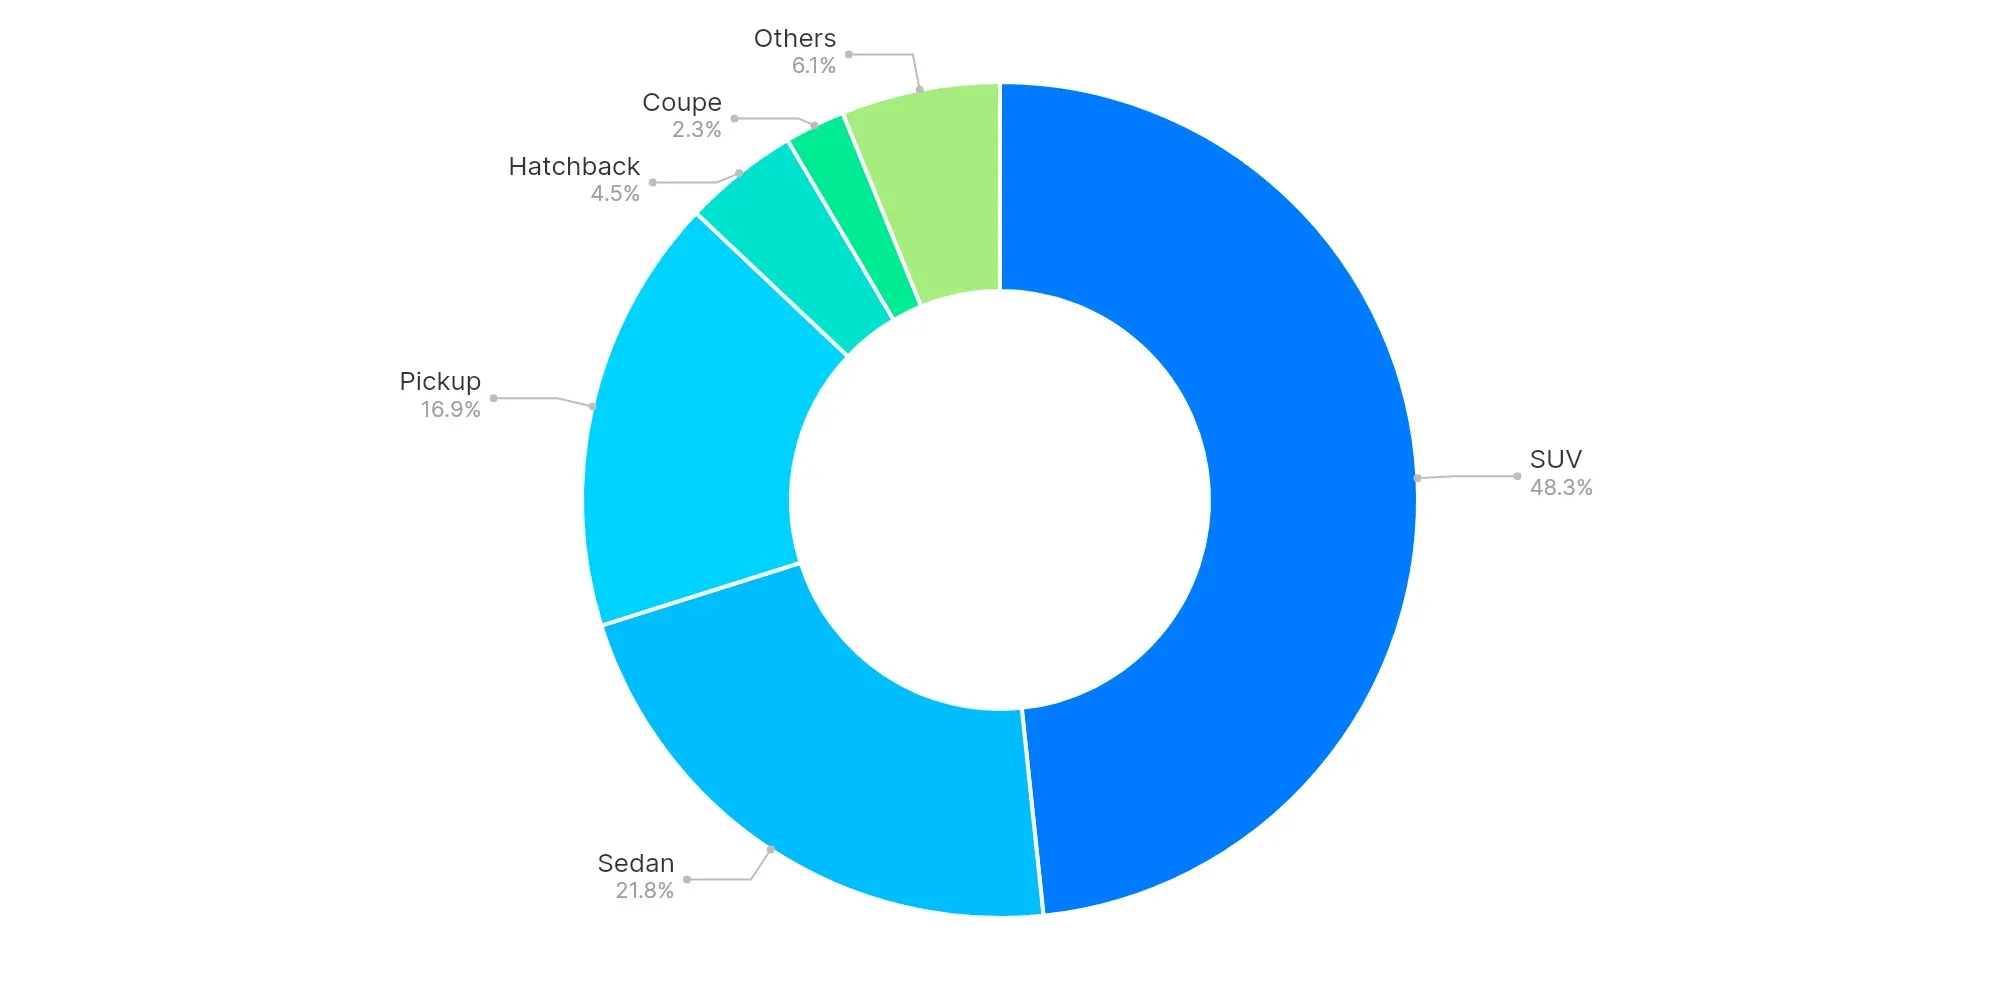
SUV (48.3%), Sedan (21.8%), and Pickup (16.9%) dominate the market. The prominence of SUVs and Pickups underscores consumer inclination towards larger vehicles, pointing to trends in family needs and rural utilization.
High-Volume vs Low-Volume States (Executive Insights)
- Top-performing states: Texas, Florida, California
- Underpenetrated regions: Virgin Islands, American Samoa, Northern Mariana Islands
- Key price bands: $20K–$30K, $10K–$20K, and $30K–$40K
- EV trend: Steady but niche growth
- Buyer preferences: Shift towards larger body types like SUVs and pickups
The used vehicle market showcases dynamic interactions across diverse segments, with significant opportunities for strategic expansion and competitive positioning. Dealers should focus on inventory alignment with regional demands, while analysts should capitalize on emerging trends in EV adoption and larger vehicle preferences to drive growth and revenue.