

US Monthly Used Car Market Data – August 2025
In this report, we analyze August 2025's used car market in the US, focusing on dealer activity, sales volume and pricing, as well as shifts in fuel and body type demands. We also examine regional performance to uncover variations in the market landscape.
Number of Dealerships by State
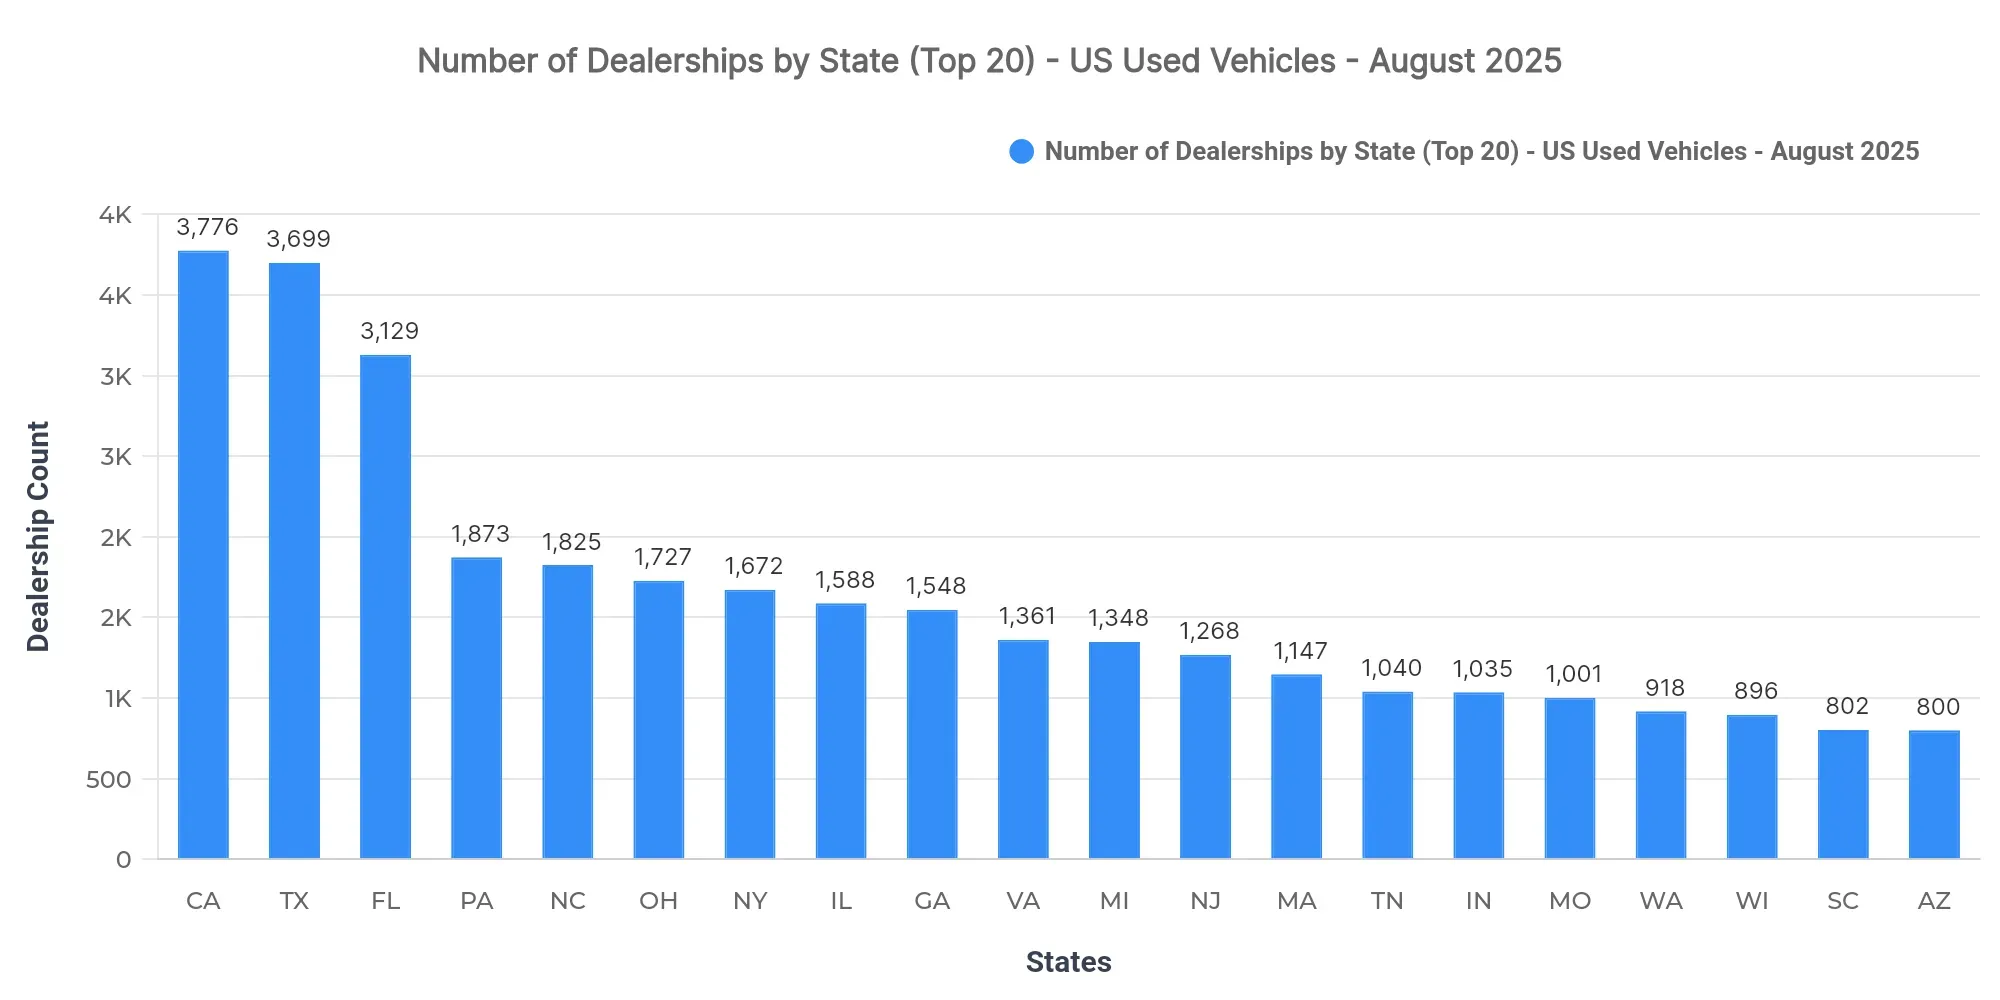
California (3,776), Texas (3,699), and Florida (3,129) lead in dealership counts. This concentration suggests a regional dominance reflective of the states' larger populations and robust automotive networks. A higher dealership count often correlates with increased market saturation, posing both opportunities and competitive challenges for new market entrants.
Top 10 States by Sold Volume
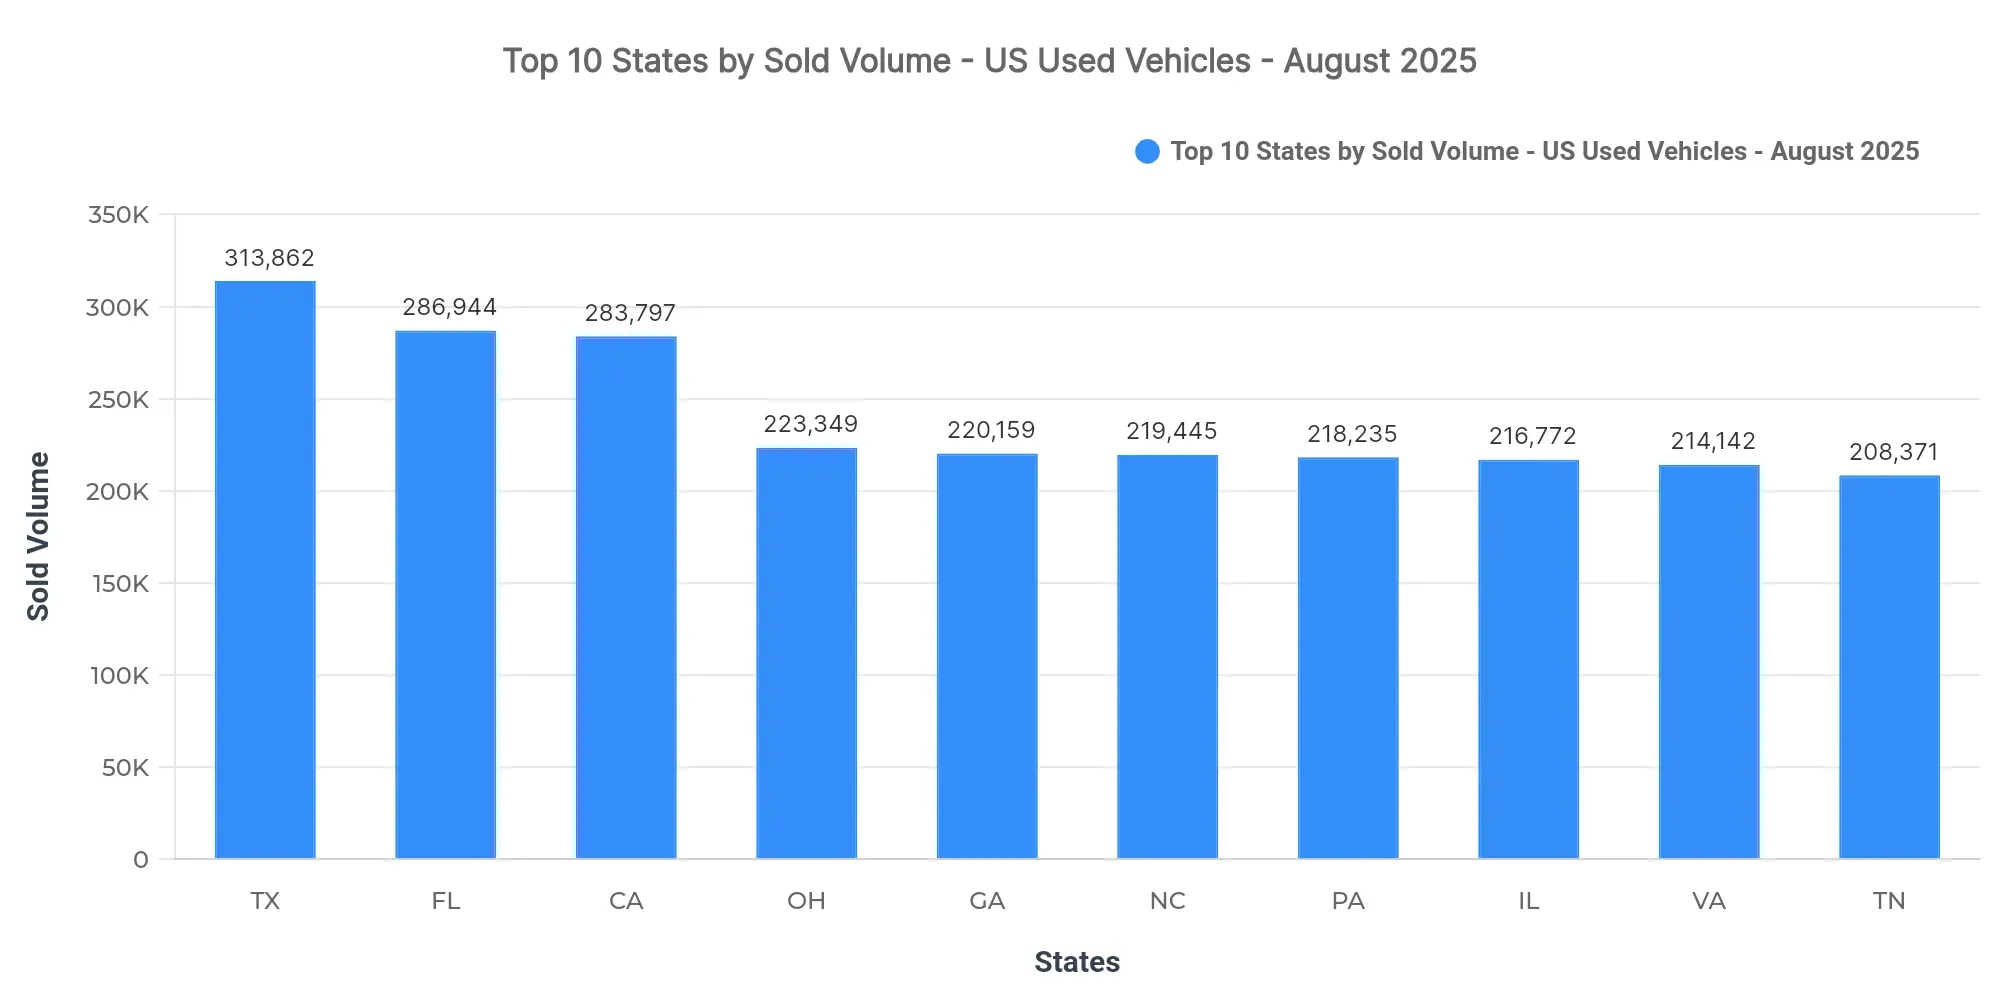
Texas (313,862), Florida (286,944), and California (283,797) lead. These states collectively account for 11.3% of the national sold volume. The remaining top states include Ohio, Georgia, North Carolina, Pennsylvania, Illinois, Virginia, and Tennessee. A notable feature is the prominence of states with larger urban populations in the top echelon, indicating a density of demand.
Market concentration within these states provides stable opportunities for dealers to plan inventories effectively. Regionally, the demand patterns suggest an emphasis on southern and coastal states, likely due to their economic vitality and demographic profiles that favor higher vehicle turnover.
Price Breakdown: Top 10 States by Sold Volume
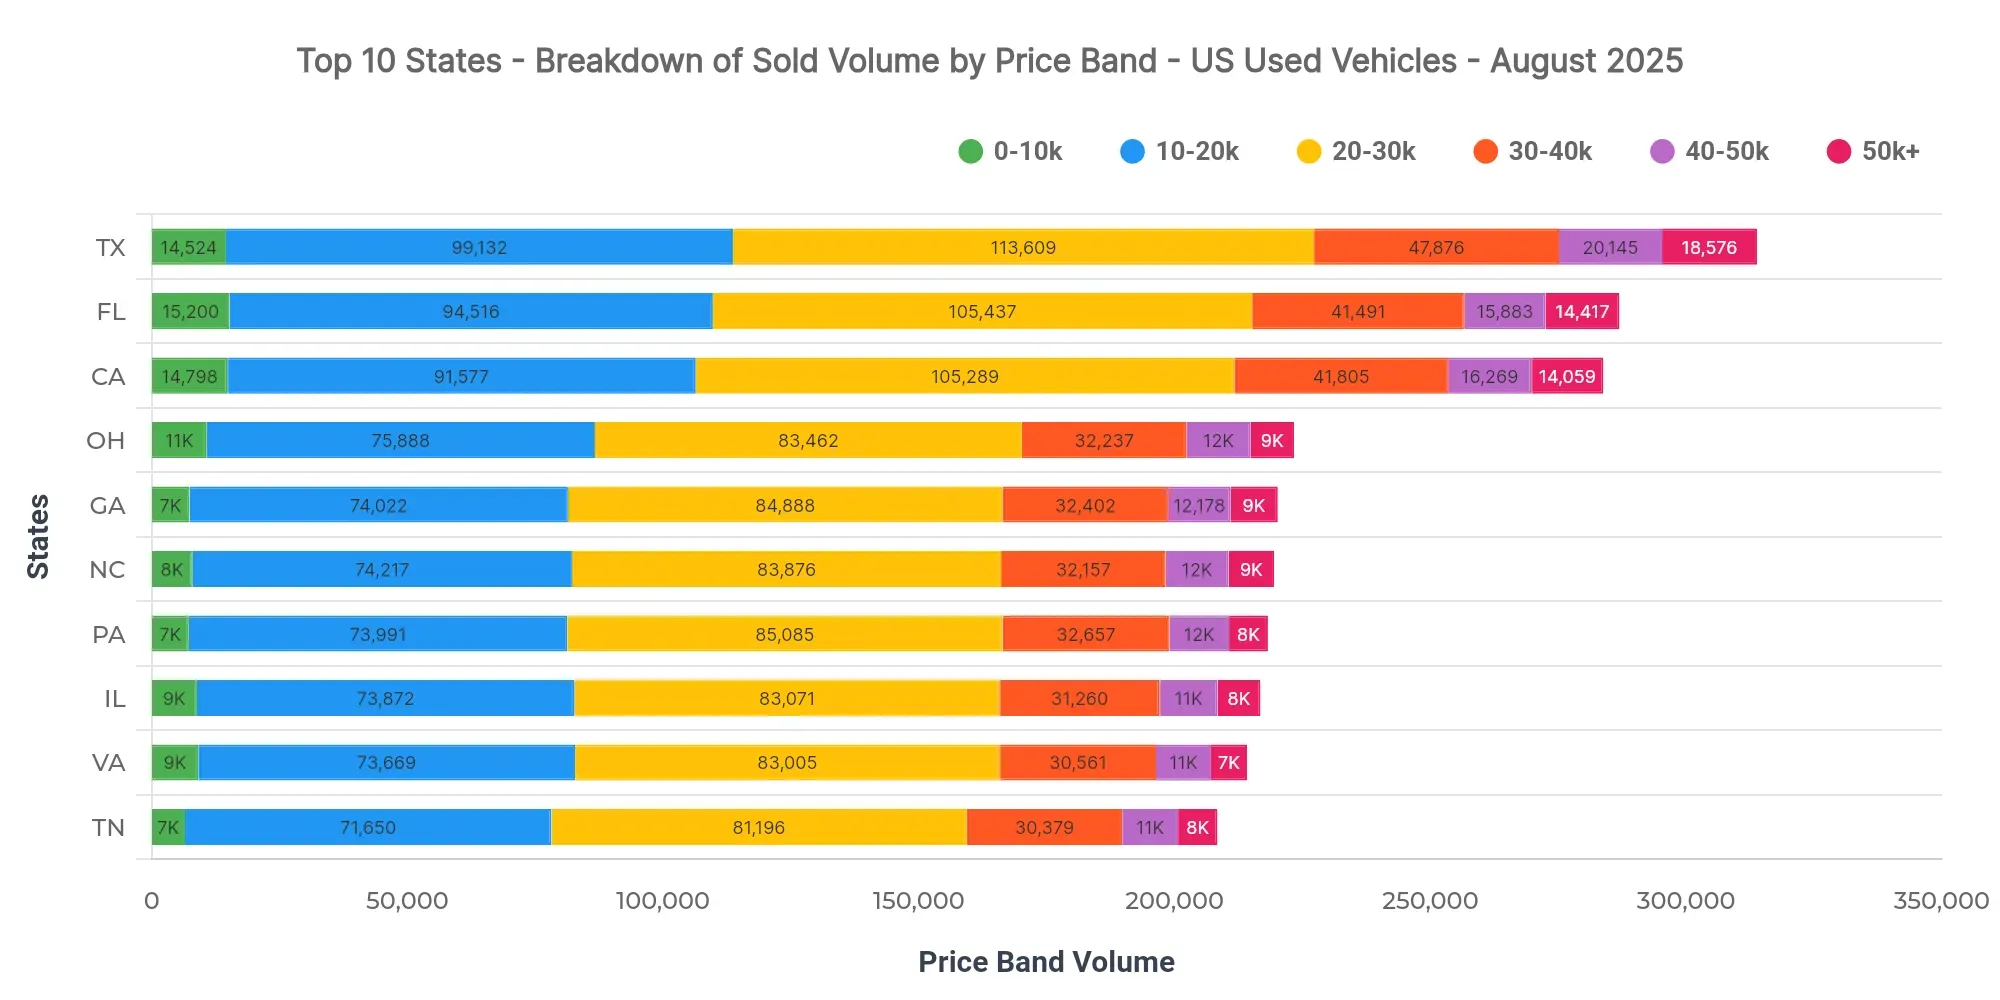
In Texas, dominant price bands include $20K–$30K (36.2%), $10K–$20K (31.6%), and $30K–$40K (15.3%). The $40K–$50K band, with a 6.4% share, represents a notable upper-price tail. Florida at $25,417 and California at $25,957 showcase similar average pricing trends with Texas slightly lower at $25,710.
For dealers, understanding these price bands helps optimize vehicle acquisition strategies. From a pricing and lending perspective, there's a clear sweet spot for mid-range vehicles which plays into favorable financing terms for consumers.
Market Breakdown by Fuel Types
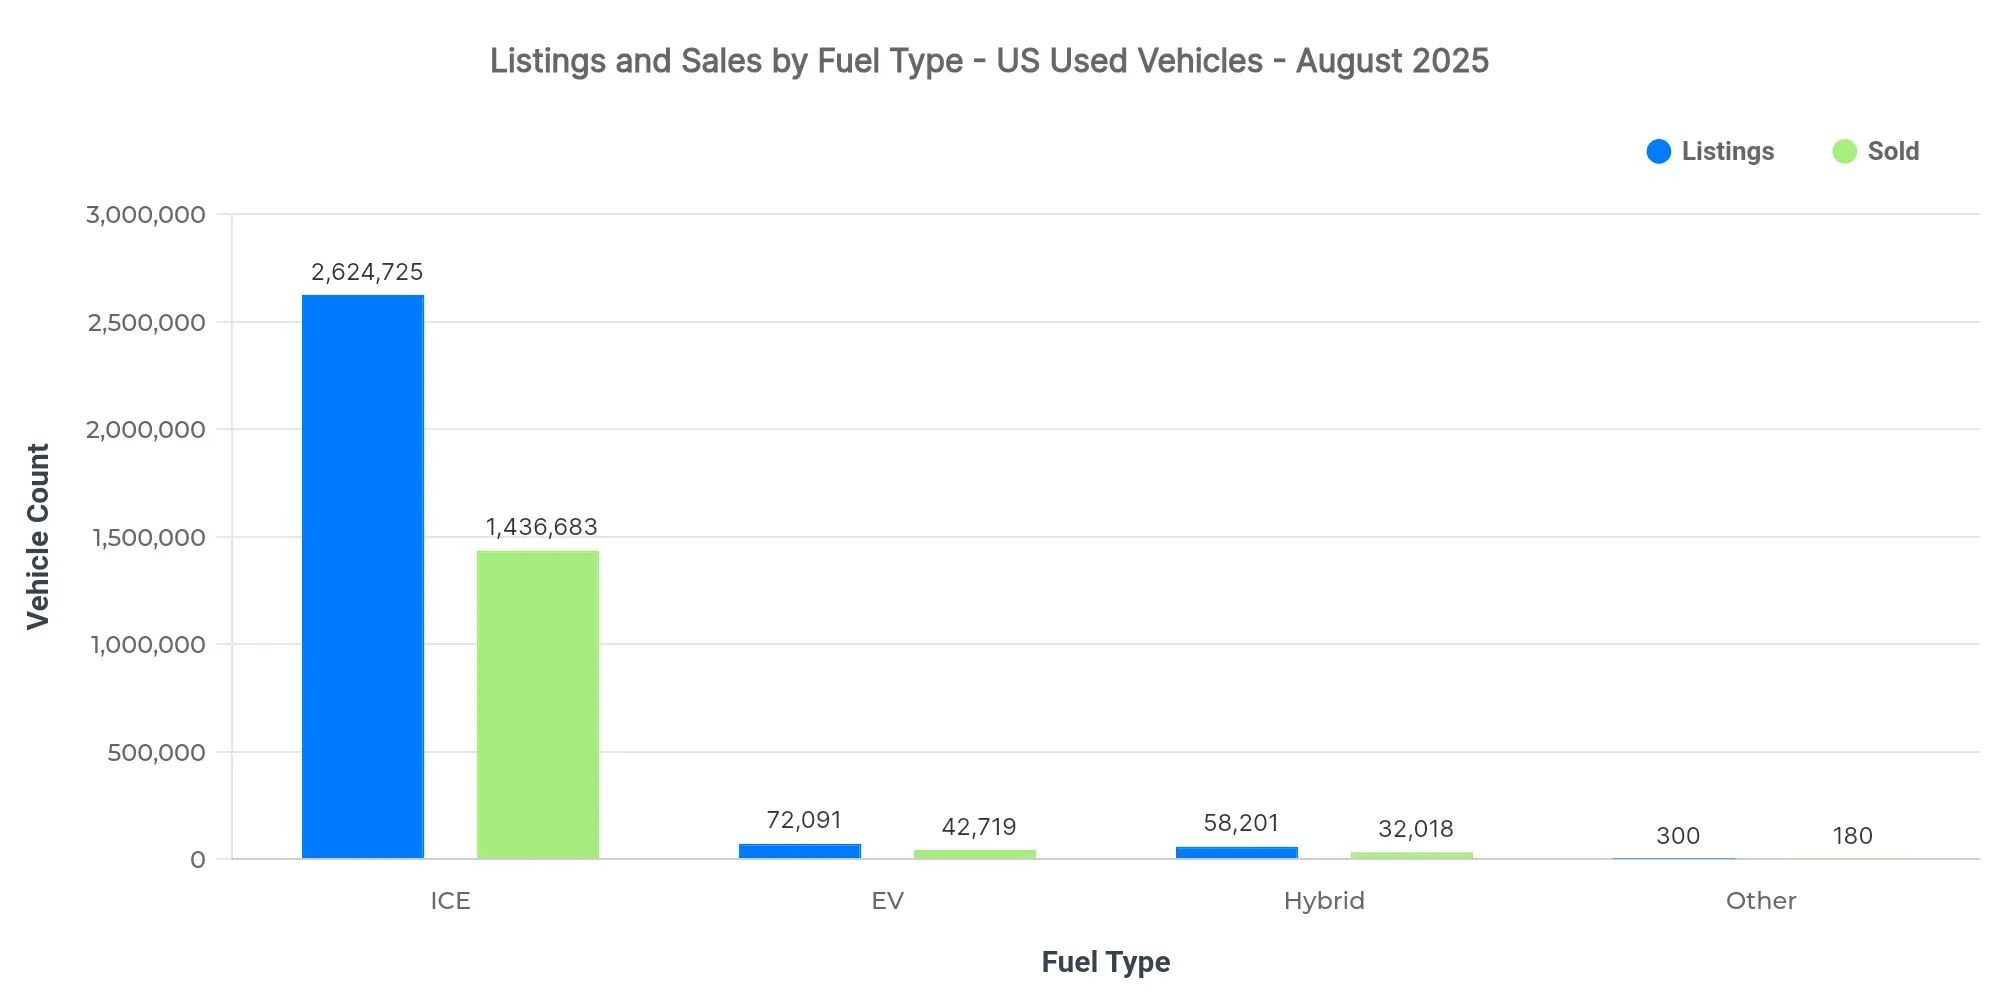
The internal combustion engine (ICE) dominates both listings and sold volumes. Key differences emerge with EVs, commanding premium pricing despite lower volumes, indicating early-stage adoption but high interest. The hybrid segment offers a middle ground, pairing moderate volumes with slightly premium pricing over ICE.
| Fuel Type | Listings Count | Sold Count | Avg Listing Price | Avg Sold Price |
|---|---|---|---|---|
| ICE | 2.62M | 1.44M | $26,087 | $25,397 |
| EV | 72.1K | 42.7K | $33,290 | $30,437 |
| Hybrid | 58.2K | 32.0K | $29,332 | $26,661 |
| Other | 300 | 180 | $13,004 | $12,797 |
- EV adoption is gradual but shows premium market positioning.
- ICE remains a staple, reinforcing its affordability and widespread availability.
- Price positioning highlights the strong consumer interest in hybrids as a practical alternative.
Market Share by Body Types
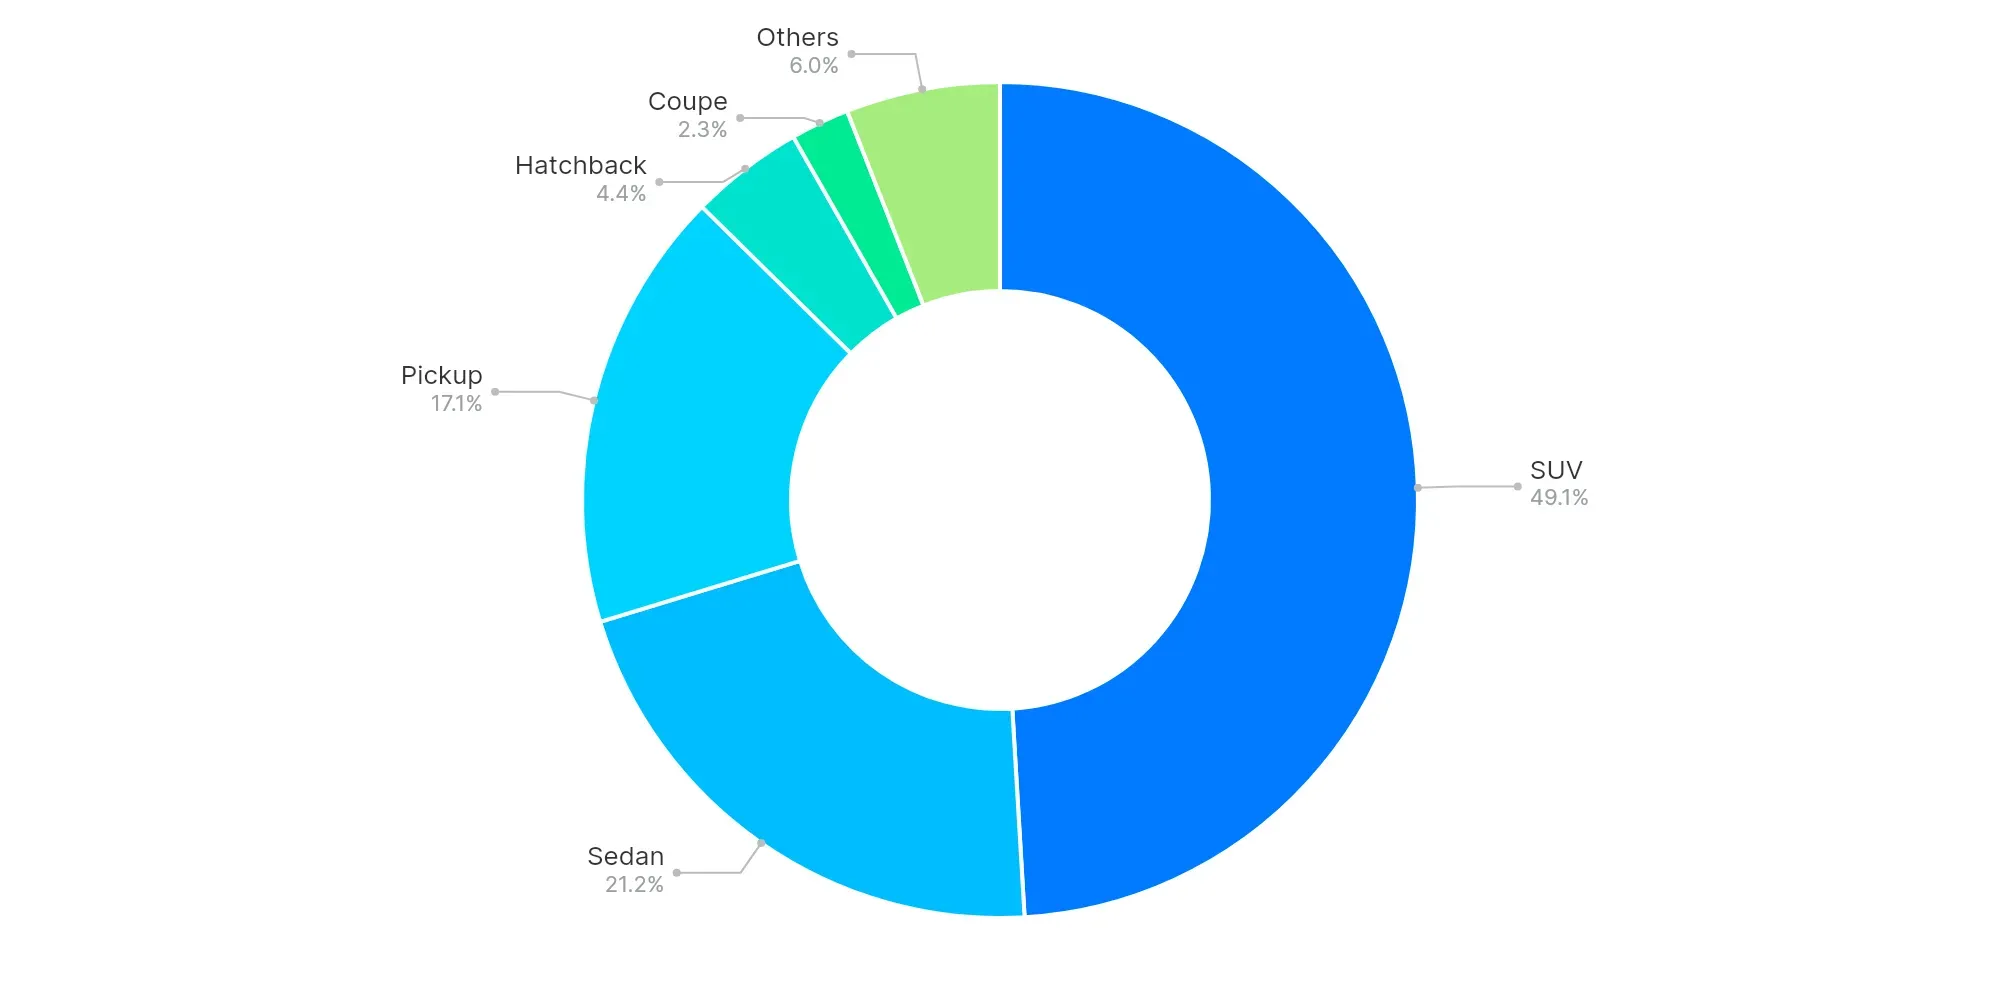
SUV (49.1%), Sedan (21.2%), and Pickup (17.1%) are dominant. The larger segments, SUVs and Pickups, command significant interest, reflecting consumer preference for versatility and utility in vehicle choice. The continued preference for these body types suggests robust consumer demand for both off-road capability and spaciousness.
High-Volume vs Low-Volume States (Executive Insights)
- Top-performing states: Texas, Florida, California
- Underpenetrated regions: American Samoa, Northern Mariana Islands, Guam
- Key price bands: $10K–$30K
- EV trend: Premium pricing, significant interest
- Buyer preferences: Larger body types preferred, growing hybrid interest
Market dynamics demonstrate a fairly stable used car industry with continued growth opportunities, especially in EV and hybrid sectors. Dealers should refine inventory strategies by focusing on mid-range priced vehicles and accommodating the increasing consumer preference for larger vehicles and alternative fuel types. Dealers need to align with these trends to capitalize on emerging consumer preferences and market conditions.