

US Monthly Used Car Market Data – August 2024
This report provides an overview of the US used car market for August 2024, focusing on dealer activity, sales volume, pricing, fuel types, body types, and regional performance. These insights are based on the latest dataset, offering a snapshot of market trends and dynamics without extensive data repetition.
Number of Dealerships by State
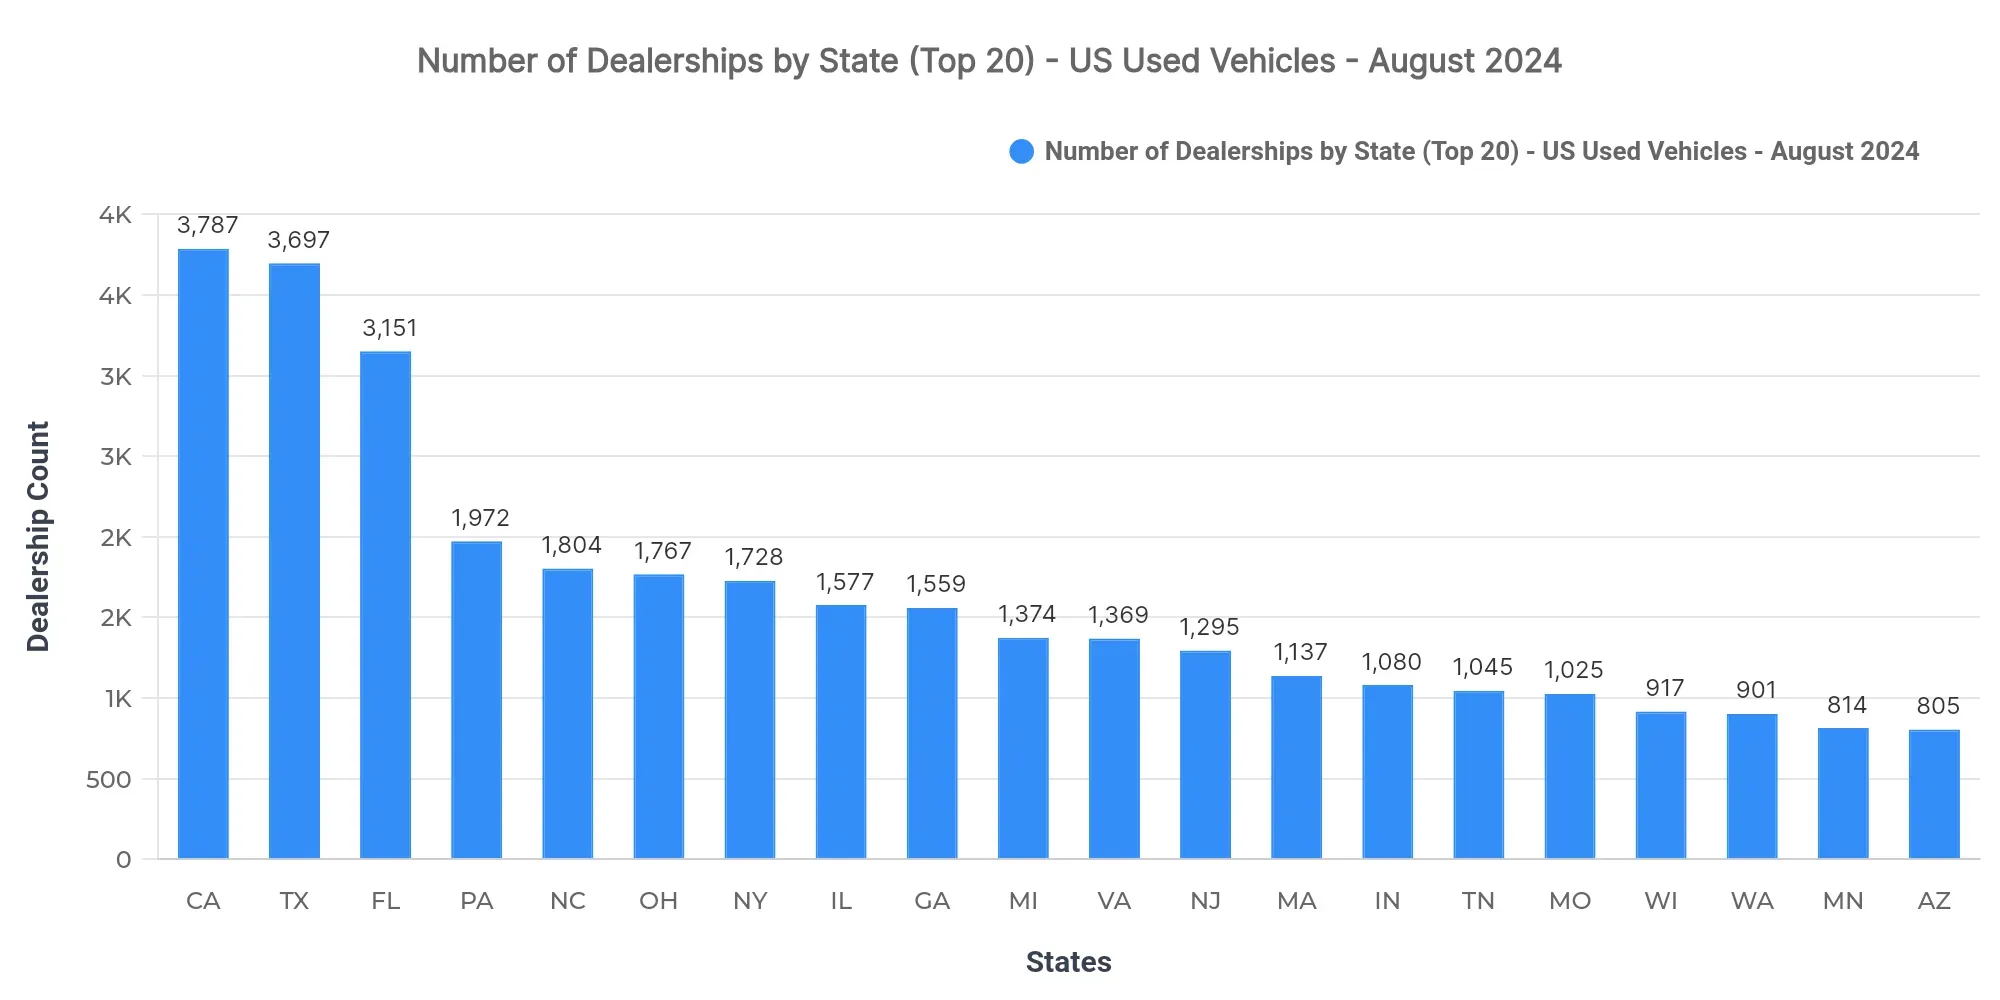
California (3,787), Texas (3,697), and Florida (3,151) lead in dealership counts. This concentration indicates a saturated market, potentially influencing competitive dynamics and pricing strategies within these states. There's an evident emphasis on major economies, capturing a large share of the market infrastructure.
Top 10 States by Sold Volume
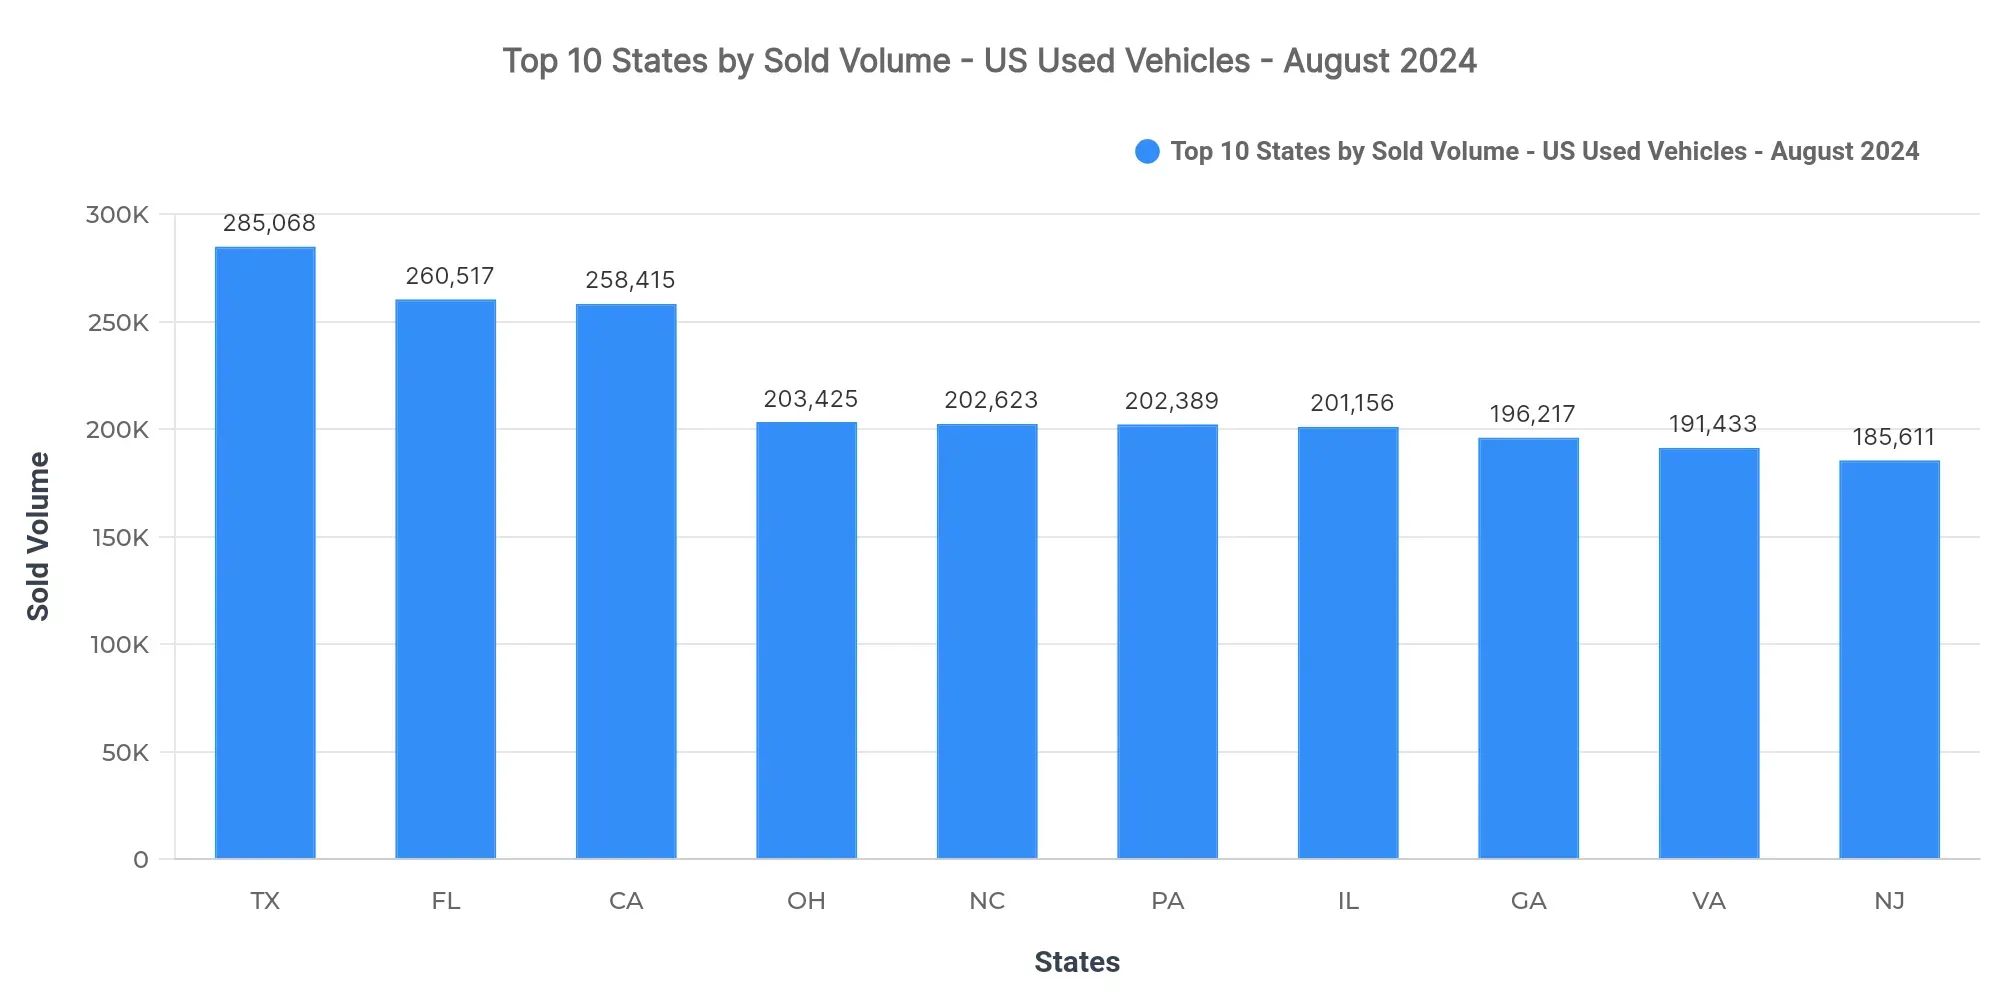
Texas (285,068), Florida (260,517), and California (258,415) lead. The top three states account for 11.3% of the national sold volume, emphasizing their crucial roles in the market. Ohio, North Carolina, Pennsylvania, Illinois, Georgia, Virginia, and New Jersey round out the top ten states.
Market concentration is significant in these three states, reflecting robust economic and demographic conditions. Regional demand patterns suggest higher transaction volumes in the South and West, potentially influenced by population density and economic activity.
Price Breakdown: Top 10 States by Sold Volume
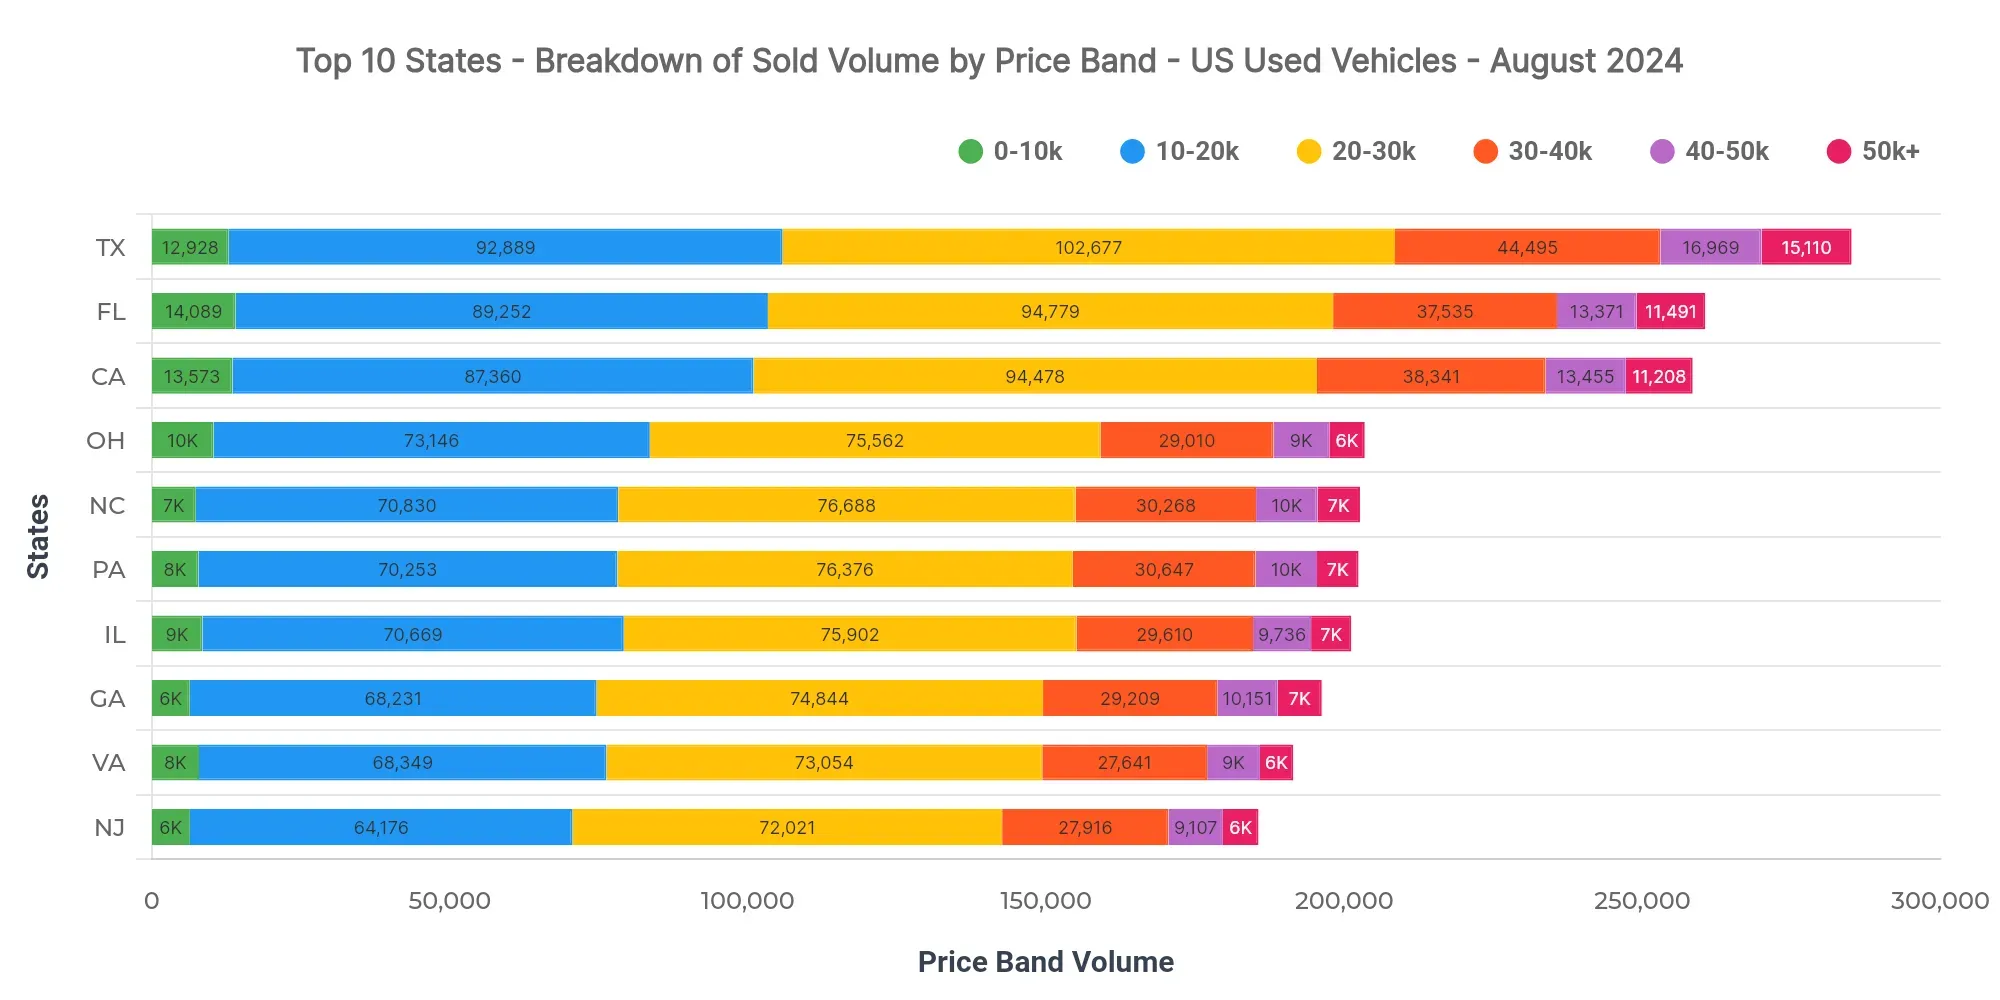
In Texas, the dominant price bands are $20K–$30K (36%), $10K–$20K (32.6%), and $30K–$40K (15.6%). A notable segment exists between $40K and $50K (6%) as an upper-price tail. Comparatively, California at $25,762 and Florida at $25,143 demonstrate similar average sold prices, indicating comparable market pricing across high-volume states.
Dealers in Texas should focus on mid-range vehicles to align with dominant price bands. For pricing and lending institutions, maintaining competitive lending products in the $20K–$30K range could significantly impact market reach and consumer satisfaction.
Market Breakdown by Fuel Types
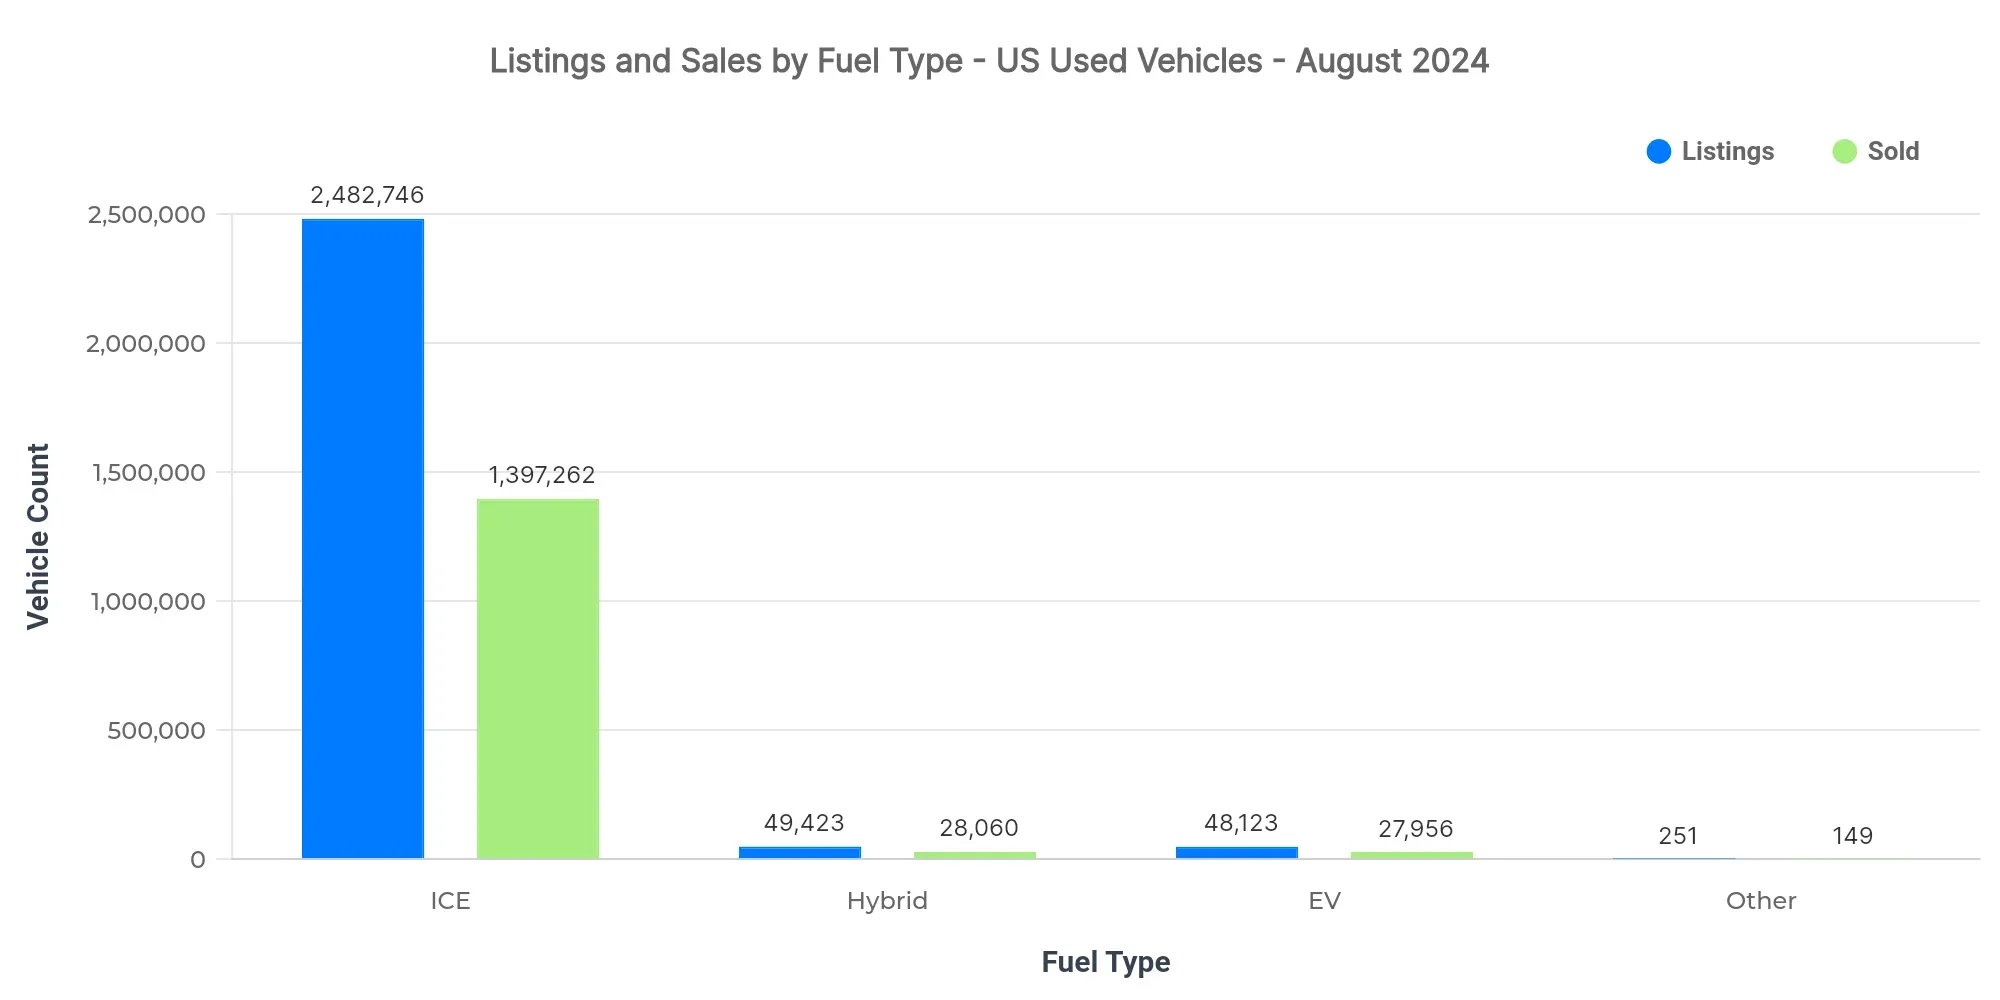
| Fuel Type | Listings Count | Sold Count | Avg Listing Price | Avg Sold Price |
|---|---|---|---|---|
| ICE | 2.48M | 1.40M | $25,553 | $25,051 |
| Hybrid | 49.42K | 28.06K | $27,851 | $26,198 |
| EV | 48.12K | 27.96K | $34,623 | $31,870 |
| Other | 251 | 149 | $16,014 | $16,303 |
Internal Combustion Engine vehicles dominate both sales volume and listings, though EVs command a significant premium in pricing. Hybrid vehicles have competitive pricing and increasing adoption, indicating a transitional consumer market.
- EV adoption is gradual, with premium pricing reflecting higher value perception.
- Price positioning suggests hybrids as an economical alternative to ICE vehicles, encouraging mid-range consumer interest.
- Market dynamics show ICE retaining dominance, but with shifting interests toward hybrid and EV options.
Market Share by Body Types
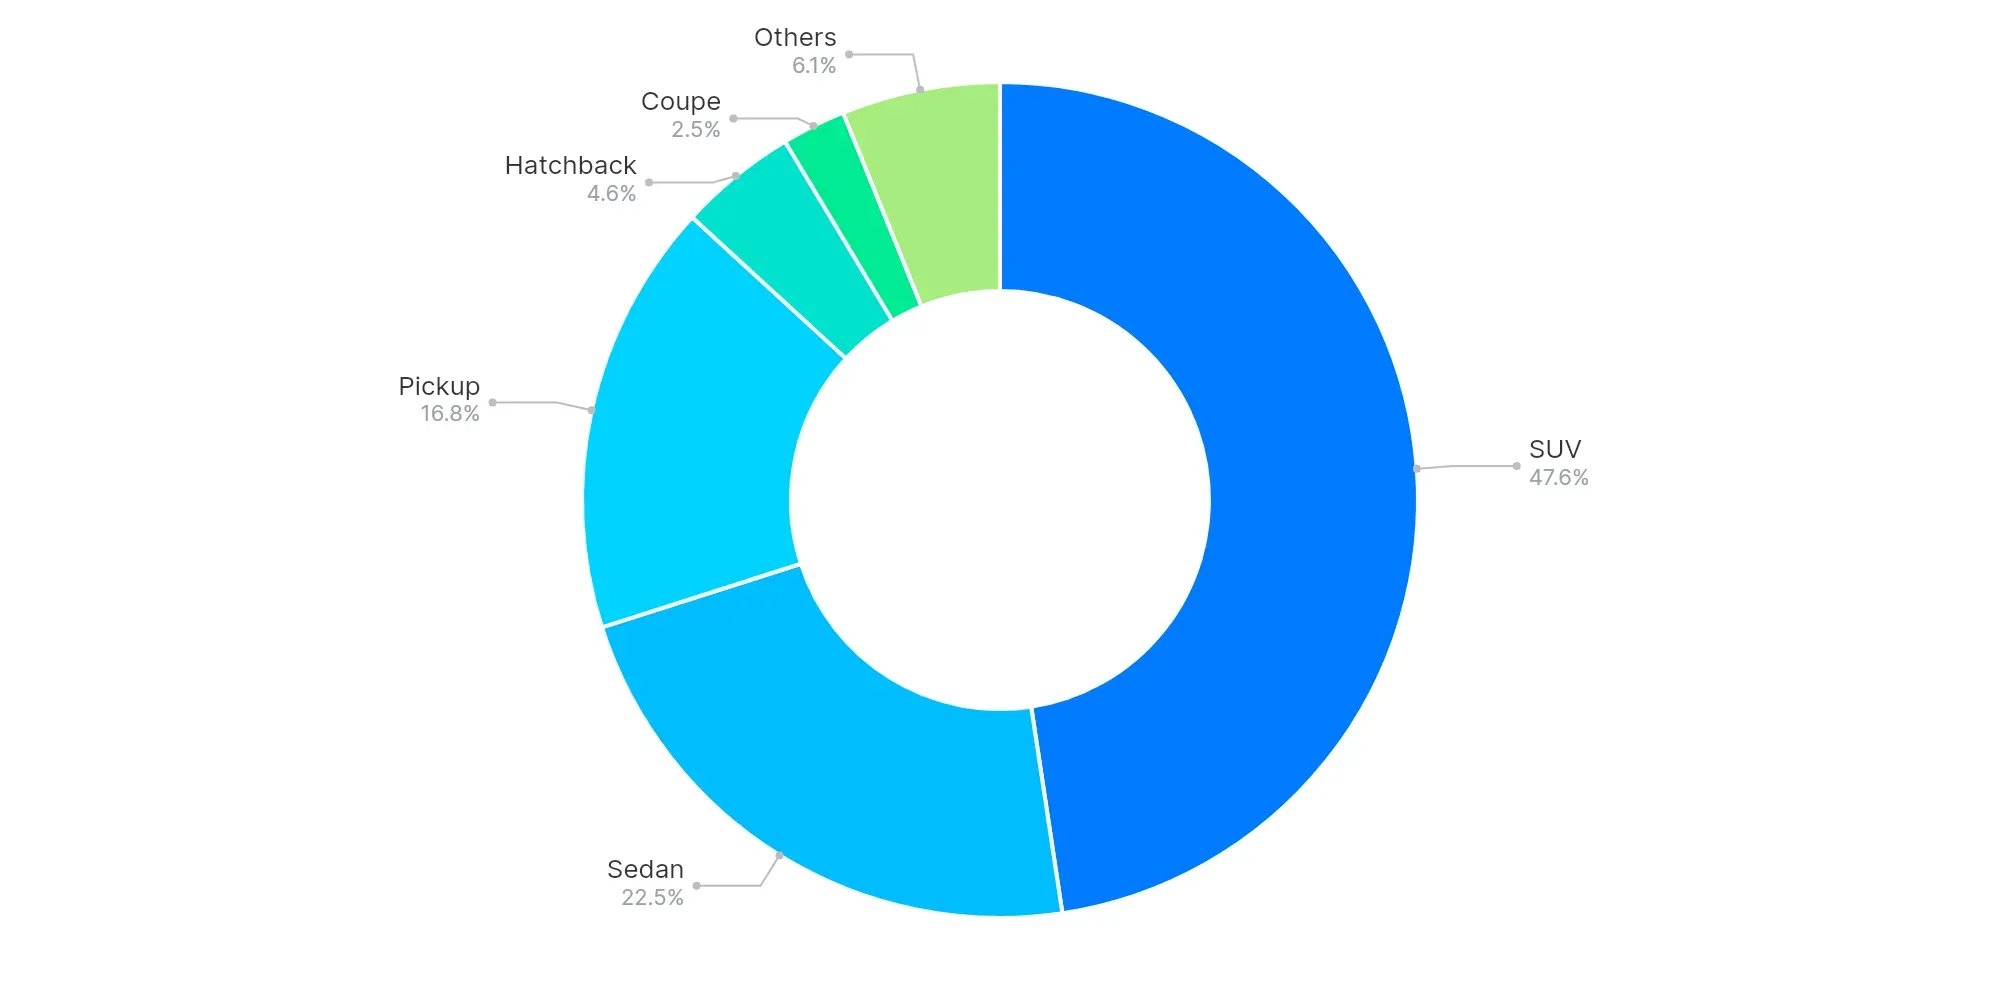
SUVs (47.6%), Sedans (22.5%), and Pickups (16.8%) are the top body types. Larger vehicle segments like SUVs and Pickups dominate, reflecting a preference for versatility and capacity. Consumer trends indicate a preference shift towards SUVs for their practicality and appeal.
High-Volume vs Low-Volume States (Executive Insights)
- Top-performing states: Texas, Florida, California
- Underpenetrated regions: AS, MP, GU
- Key price bands: $20K–$30K, $10K–$20K, $30K–$40K
- EV trend: Growing interest with premium pricing
- Buyer preferences: Shift towards SUVs and fuel-efficient models
The used car market in August 2024 shows a concentrated yet dynamic landscape, driven by consumer preferences for mid-range vehicles and a gradual transition towards more fuel-efficient options. Dealers should prioritize stocking inventory that aligns with dominant price bands and body types, while analysts may find opportunities in emerging fuel type trends and regional market shifts.