

US Monthly Used Car Market Data – April 2025
This report provides a comprehensive overview of the US used vehicle market for April 2025, focusing on dealer activity, sales volume, pricing trends, fuel and body types, and regional performance. It highlights key insights and implications for stakeholders in the industry, ensuring concise and valuable information for decision-makers.
Number of Dealerships by State
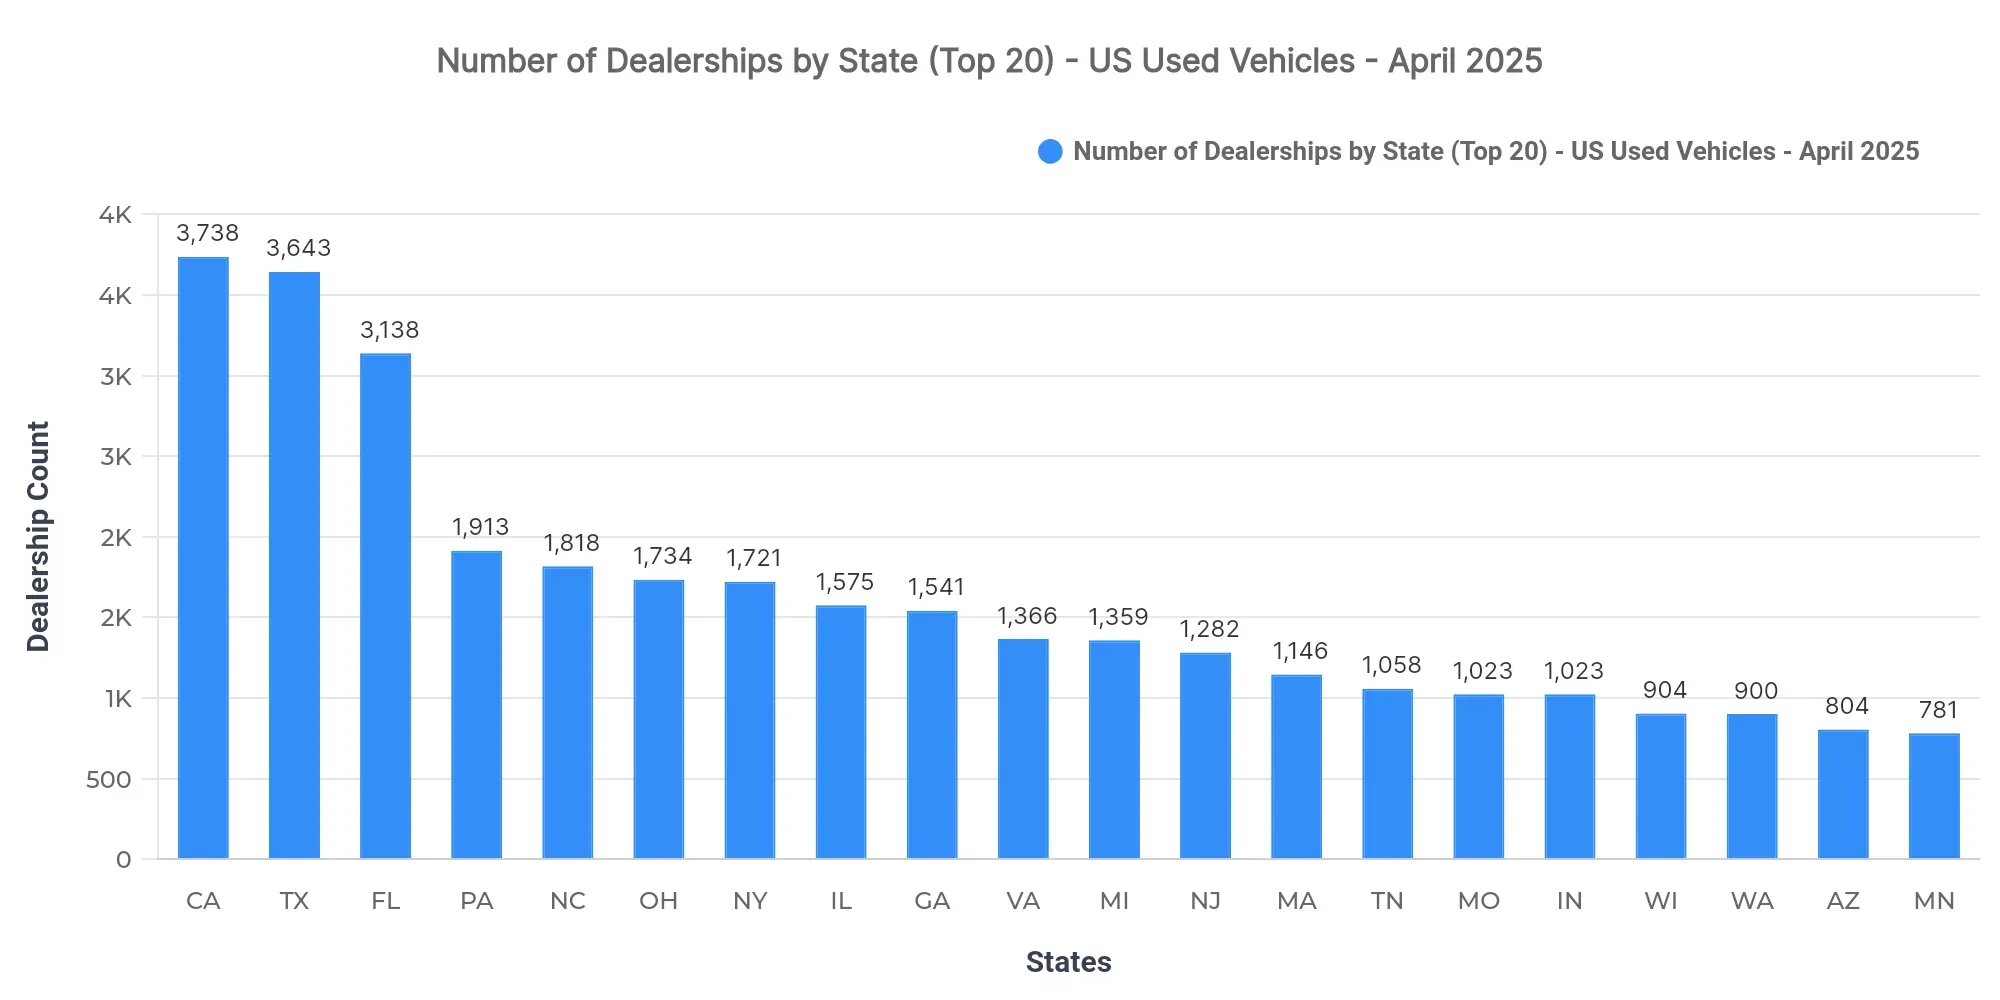
California (3,738), Texas (3,643), and Florida (3,138) lead in dealership counts. The concentration of dealerships in these states suggests a mature market with potentially high competitive pressure. Focusing on untapped regions could yield further growth opportunities for dealers.
Top 10 States by Sold Volume
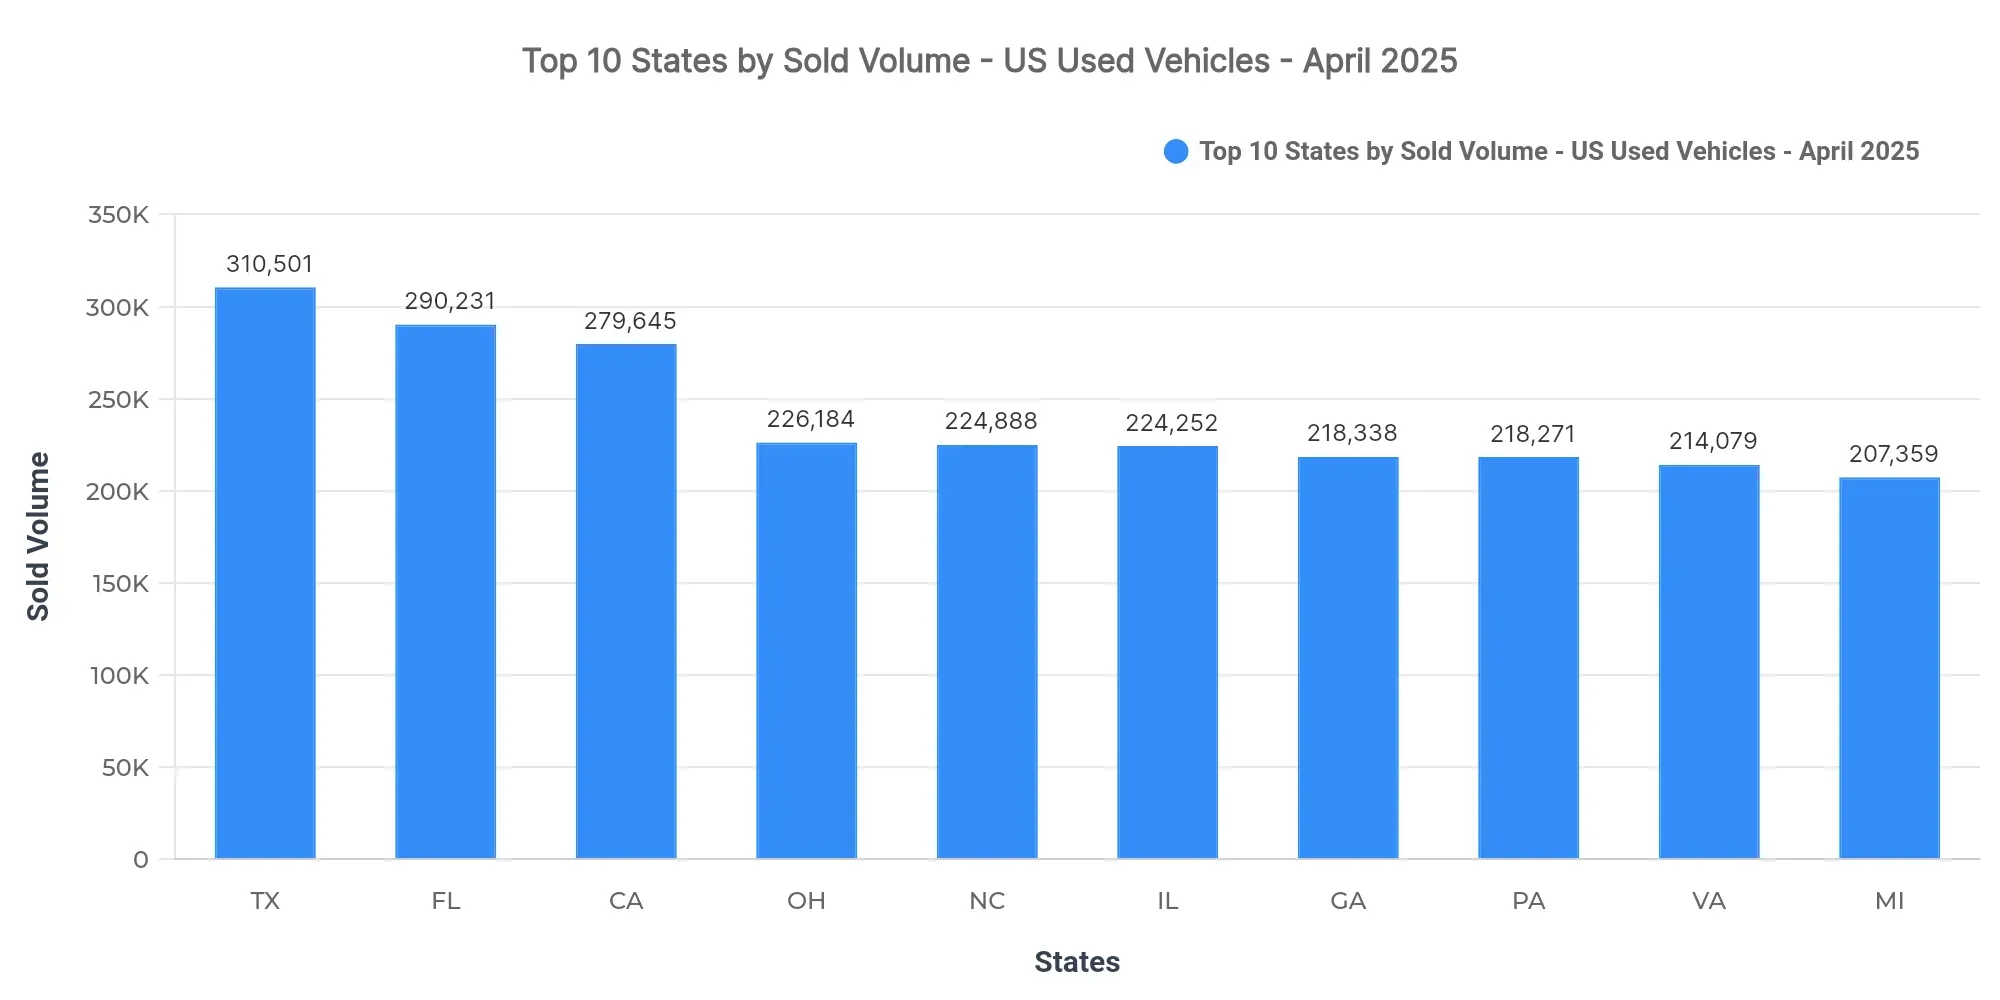
Texas (310,501), Florida (290,231), and California (279,645) lead in sales volume, contributing to 11.1% of the national sold volume. The remaining top-10 states include Ohio, North Carolina, Illinois, Georgia, Pennsylvania, Virginia, and Michigan. The concentration of sales in the top three states displays robust market dynamics.
Market concentration is high among the top performers, showing they dominate a significant portion of the national market. Regional demand patterns indicate that opportunities for growth may exist by focusing marketing efforts in North Carolina and Georgia.
Price Breakdown: Top 10 States by Sold Volume
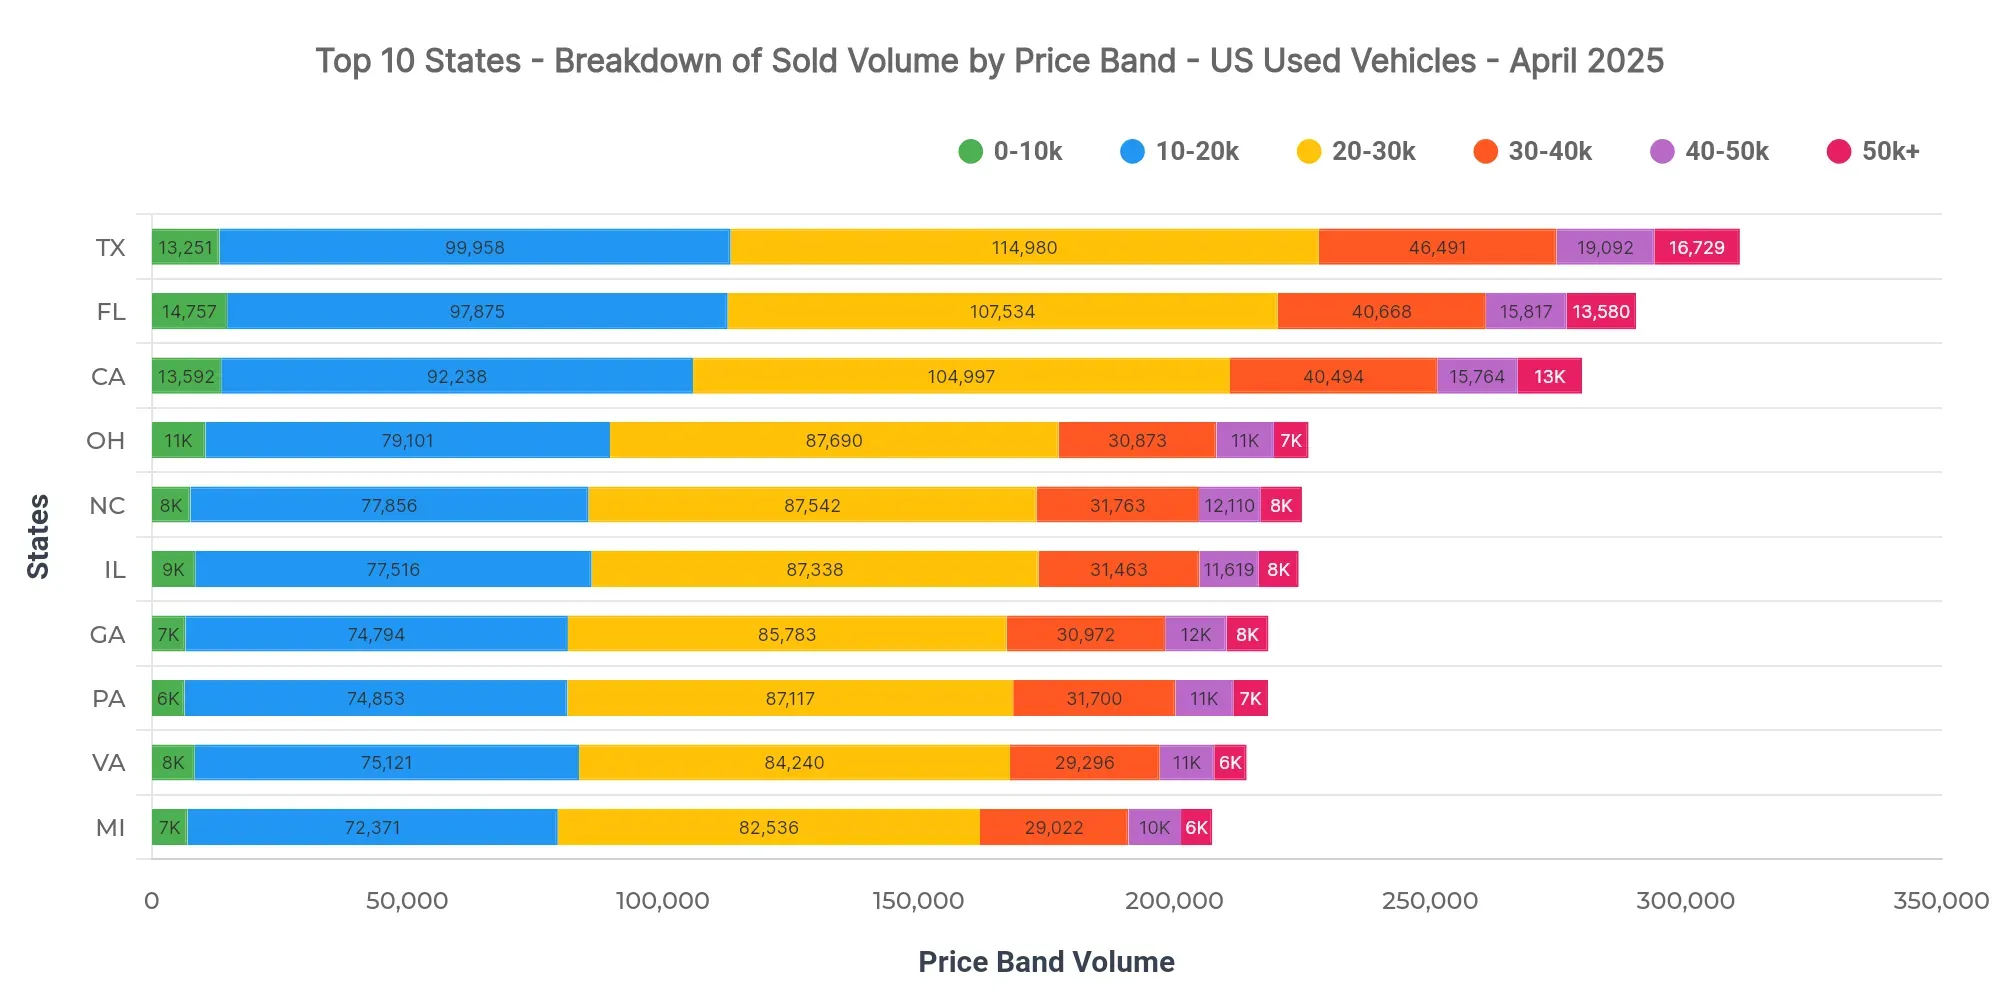
In Texas, the dominant price bands are $20K–$30K (37%), $10K–$20K (32.2%), and $30K–$40K (15%). A notable upper-price tail includes the $40K–$50K band at 6.1%. Compared with other leading states, Florida averages at $25,387 and California at $25,780.
For dealers, focusing inventory on the $20K–$30K segment could drive higher sales in Texas. Pricing strategies should be adjusted to accommodate the demand in lower mid-range price bands.
Market Breakdown by Fuel Types
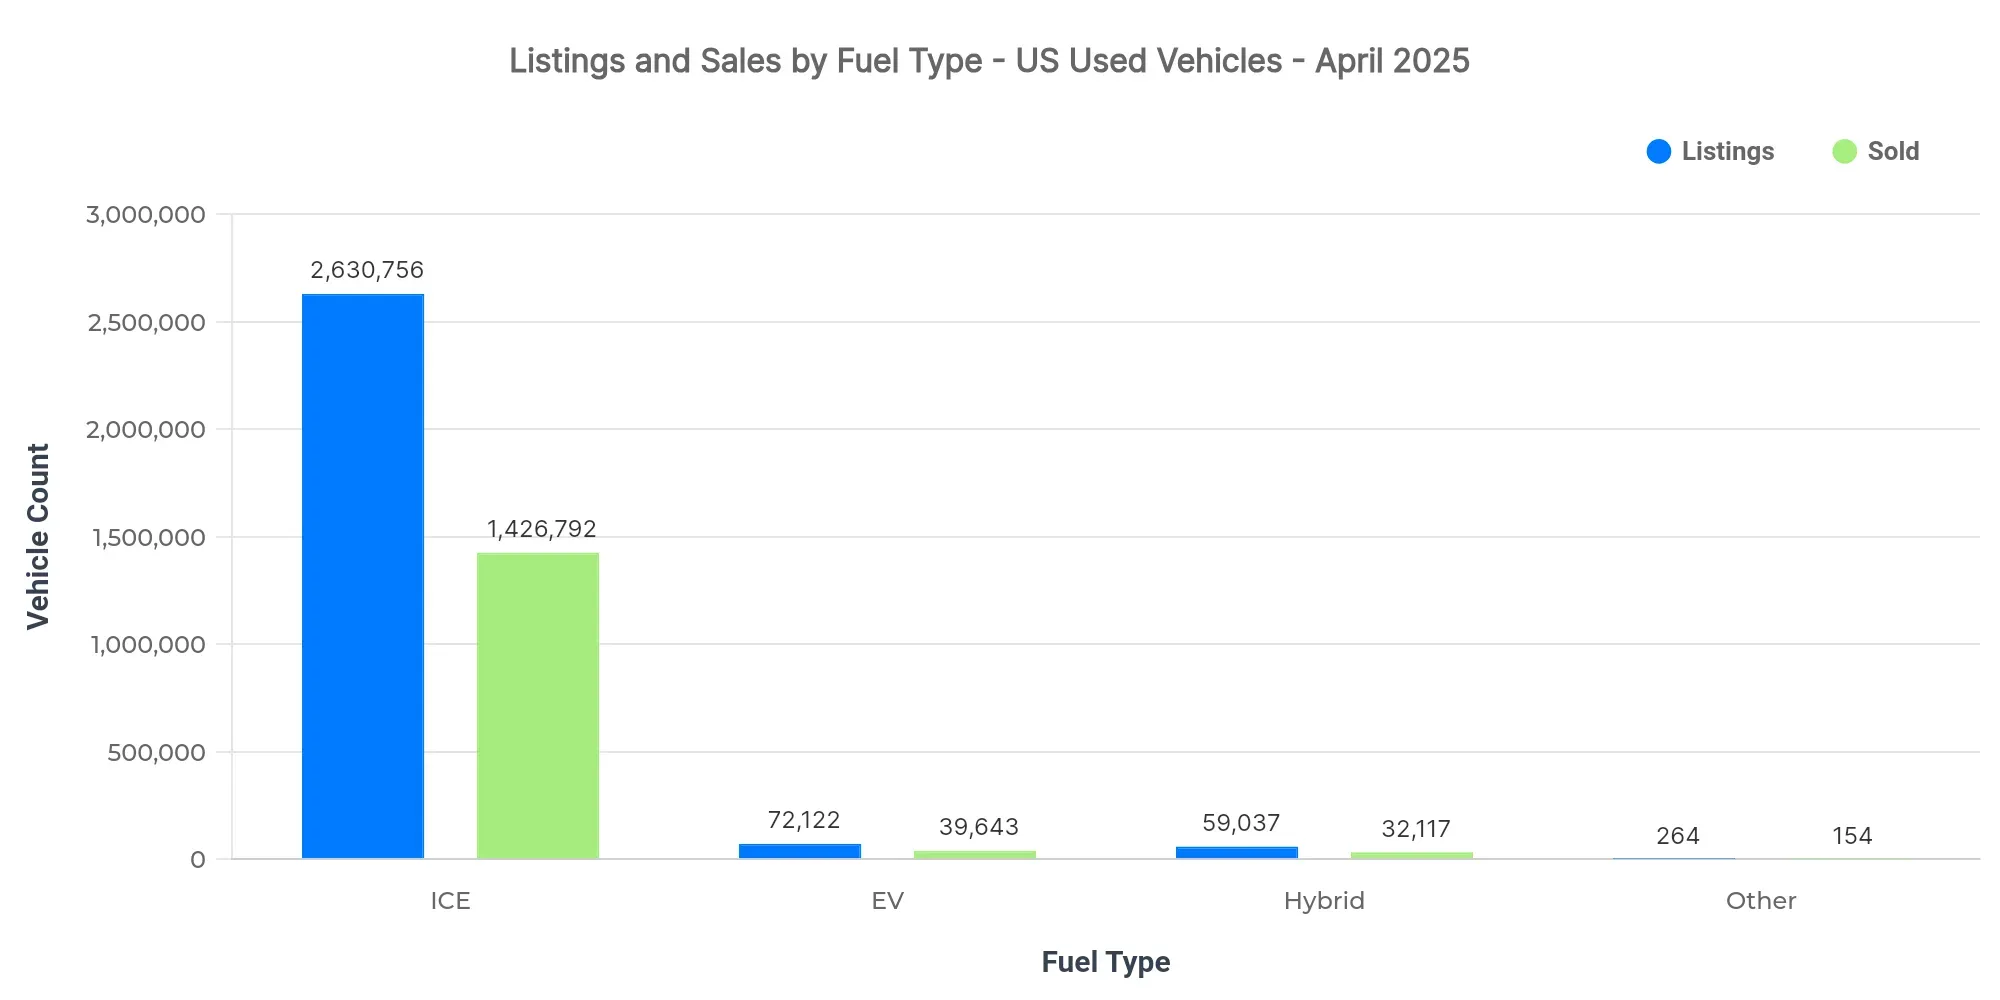
The market breakdown by fuel type shows distinctive variations in listings and sold units alongside pricing. Internal Combustion Engine (ICE) vehicles dominate both listings and sales volume. Meanwhile, Electric Vehicles (EVs) and Hybrids offer premium pricing compared to ICE vehicles.
| Fuel Type | Listings Count | Sold Count | Avg Listing Price | Avg Sold Price |
|---|---|---|---|---|
| ICE | 2.63M | 1.43M | $25,904 | $25,189 |
| EV | 72.1K | 39.6K | $34,320 | $31,287 |
| Hybrid | 59K | 32.1K | $26,448 | $25,721 |
| Other | 264 | 154 | $14,693 | $15,033 |
- EV adoption is gaining momentum, with luxury and premium models leading.
- Hybrids offer competitive pricing, making them attractive alternatives.
- Market dynamics favor ICE, but transitioning opportunities exist for EV and Hybrid promotions.
Market Share by Body Types
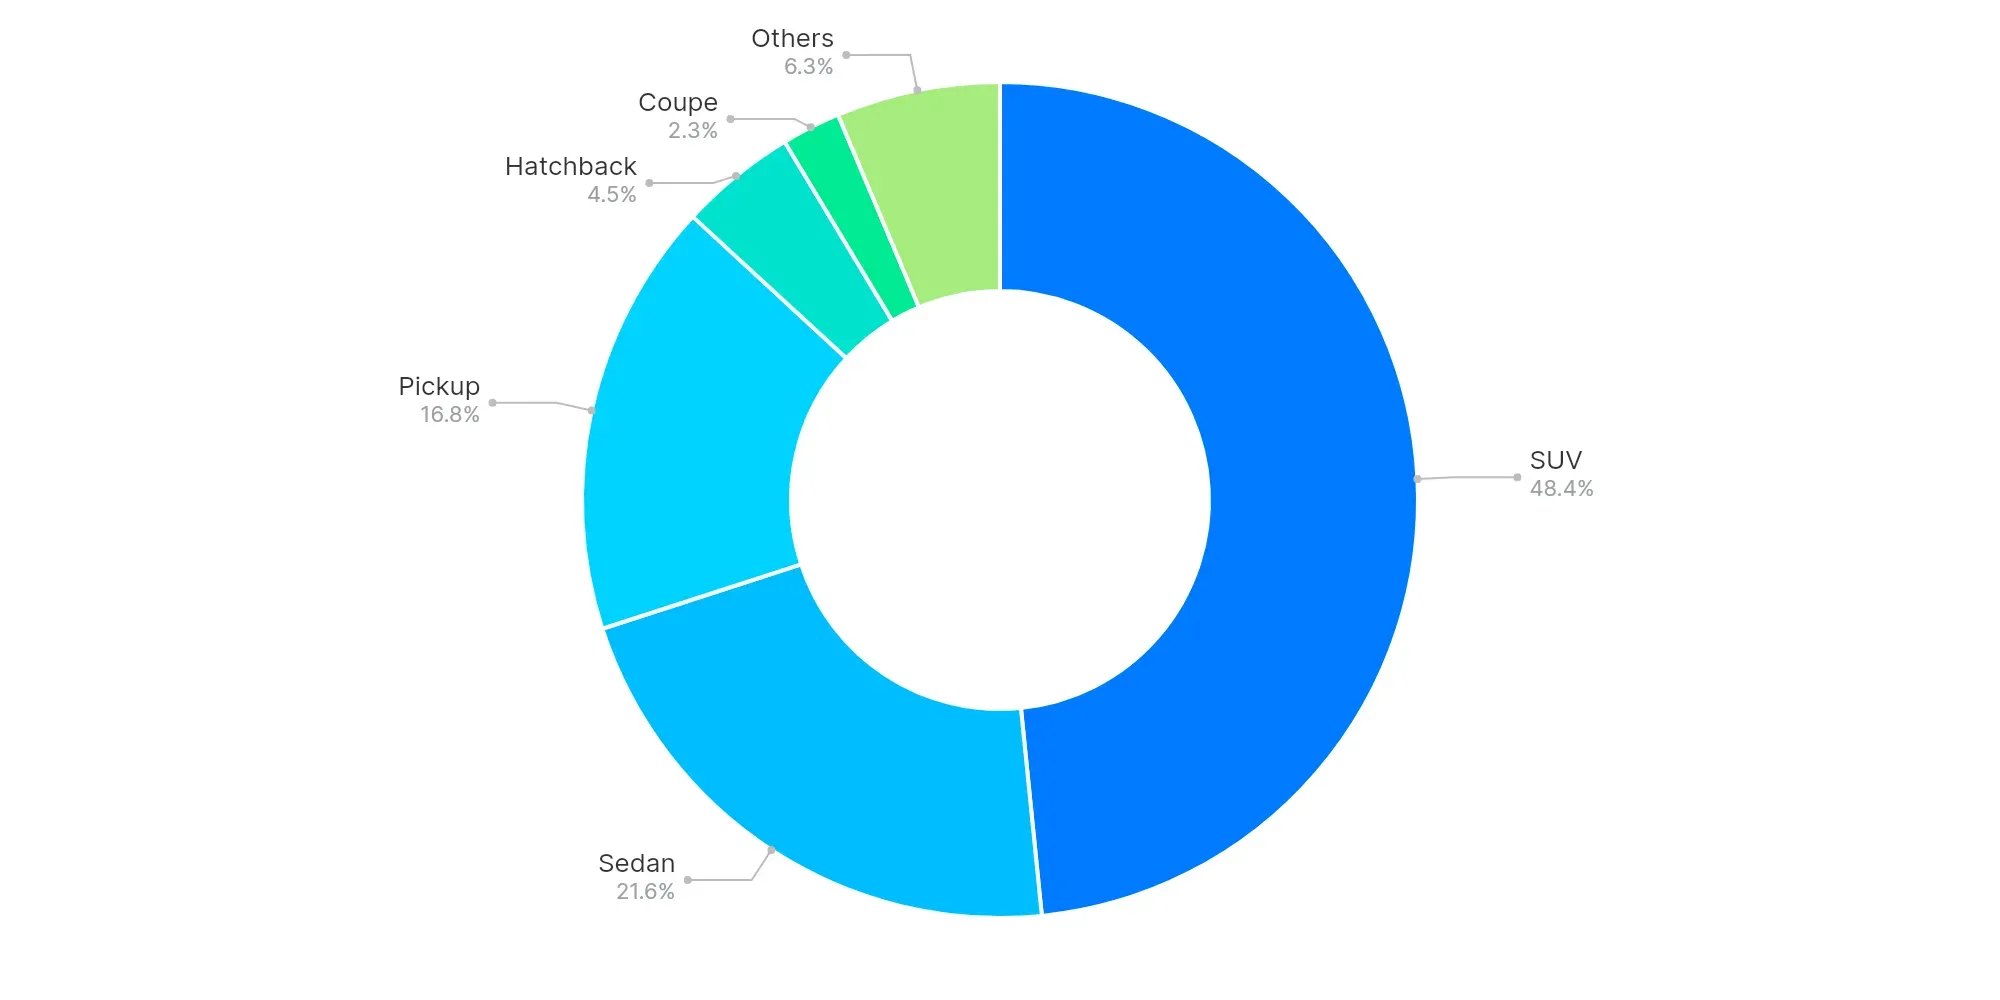
SUVs (48.4%), Sedans (21.6%), and Pickups (16.8%) dominate the market. The larger-vehicle segments like SUVs and Pickups exhibit strong consumer preferences, indicating a trend toward versatility and capacity in vehicle choices. Manufacturers and dealers should align inventory and marketing strategies with this demand.
High-Volume vs Low-Volume States (Executive Insights)
- Top-performing states: Texas, Florida, and California
- Underpenetrated regions: Virgin Islands, American Samoa, and Northern Mariana Islands
- Key price bands: $20K–$30K, $10K–$20K, $30K–$40K
- EV trend: Increasing availability and adoption in premium segments
- Buyer preferences: Favoring larger vehicles like SUVs and pickups
As the market continues its current trajectory, dealers should emphasize stocking and promoting models in high-demand price bands and body types. Embracing the potential of EV and Hybrid models will position them well for future shifts in consumer preferences. Regular review of regional performance will help identify and exploit emerging opportunities.