

US Monthly Used Car Market Data – September 2024
This report provides a detailed analysis of the US used vehicle market for September 2024, focusing on dealer activity, sales volume, pricing, fuel types, body types, and regional performance. The insights drawn here highlight pivotal trends and shifts useful for dealers, analysts, and stakeholders to make informed decisions.
Number of Dealerships by State
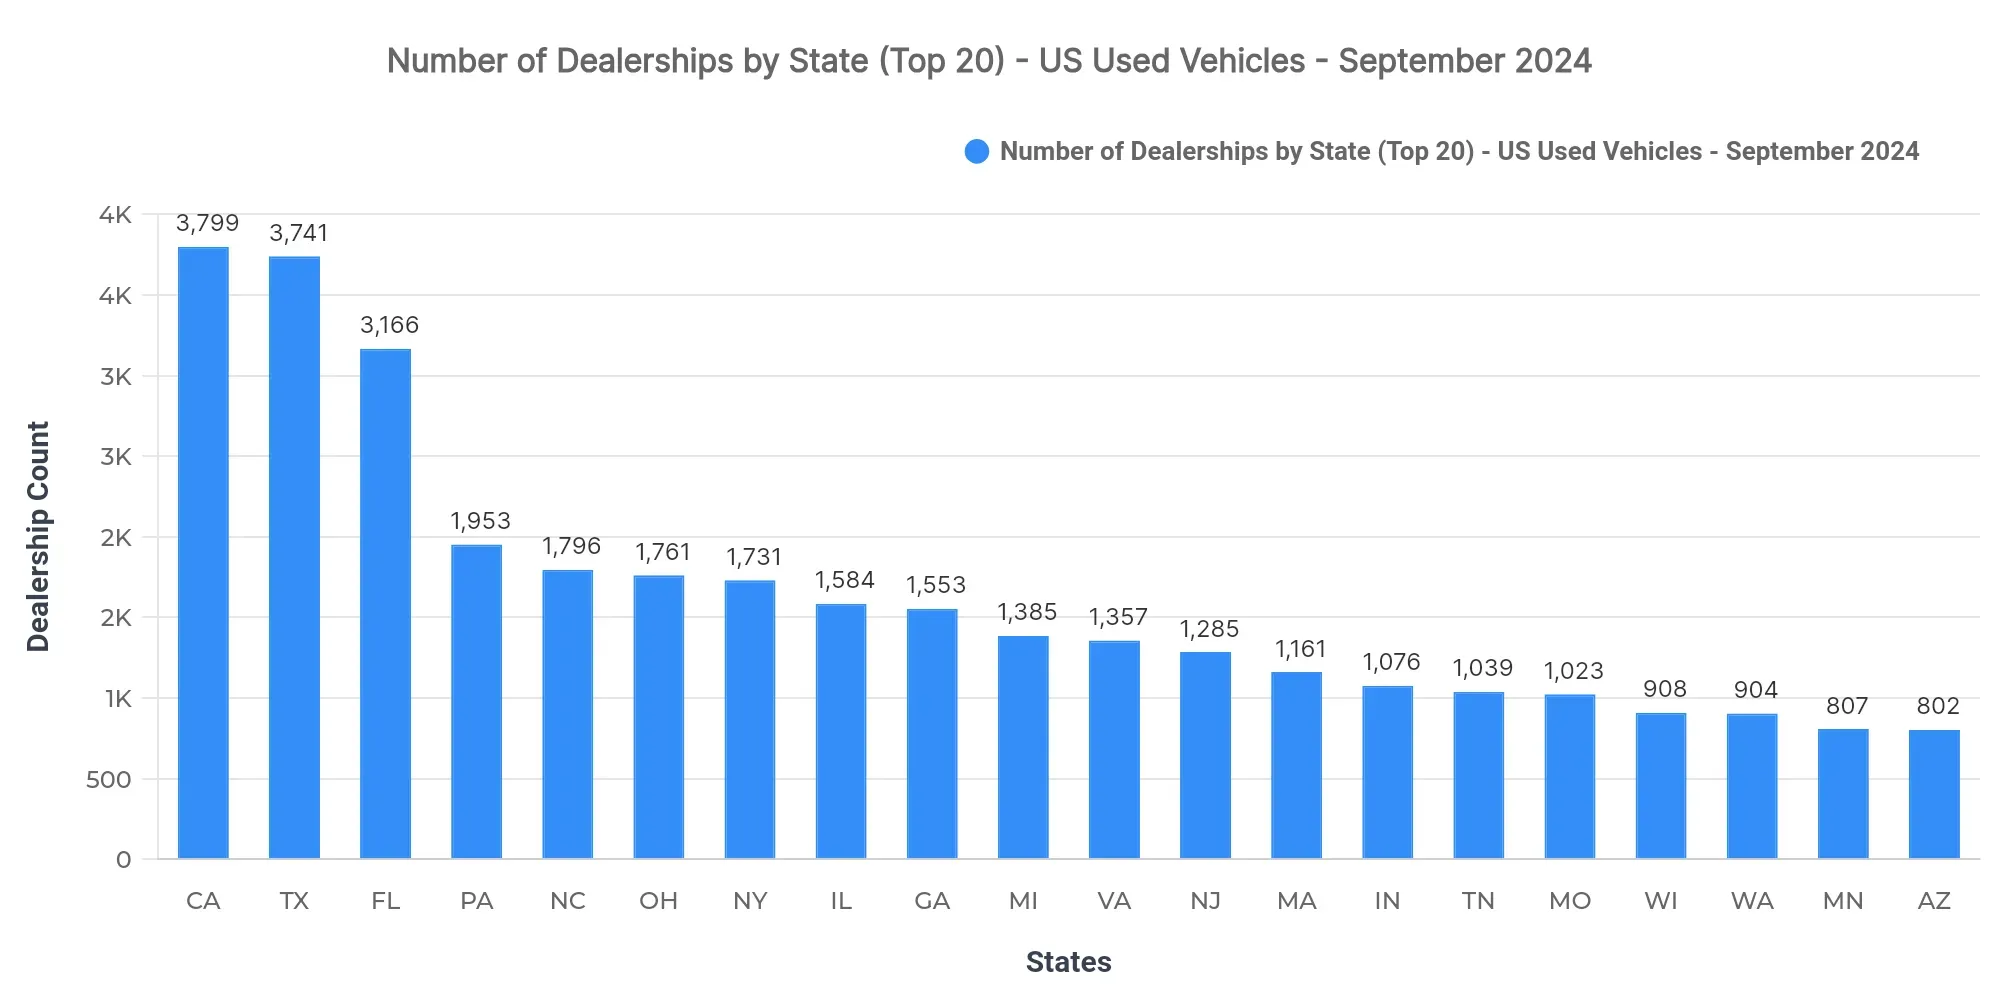
California (3,799), Texas (3,741), and Florida (3,166) lead in the number of dealerships, suggesting a strong concentration in populous states. This indicates a saturation where competition is fierce, potentially affecting margins and motivating dealerships to innovate in customer acquisition strategies.
Top 10 States by Sold Volume
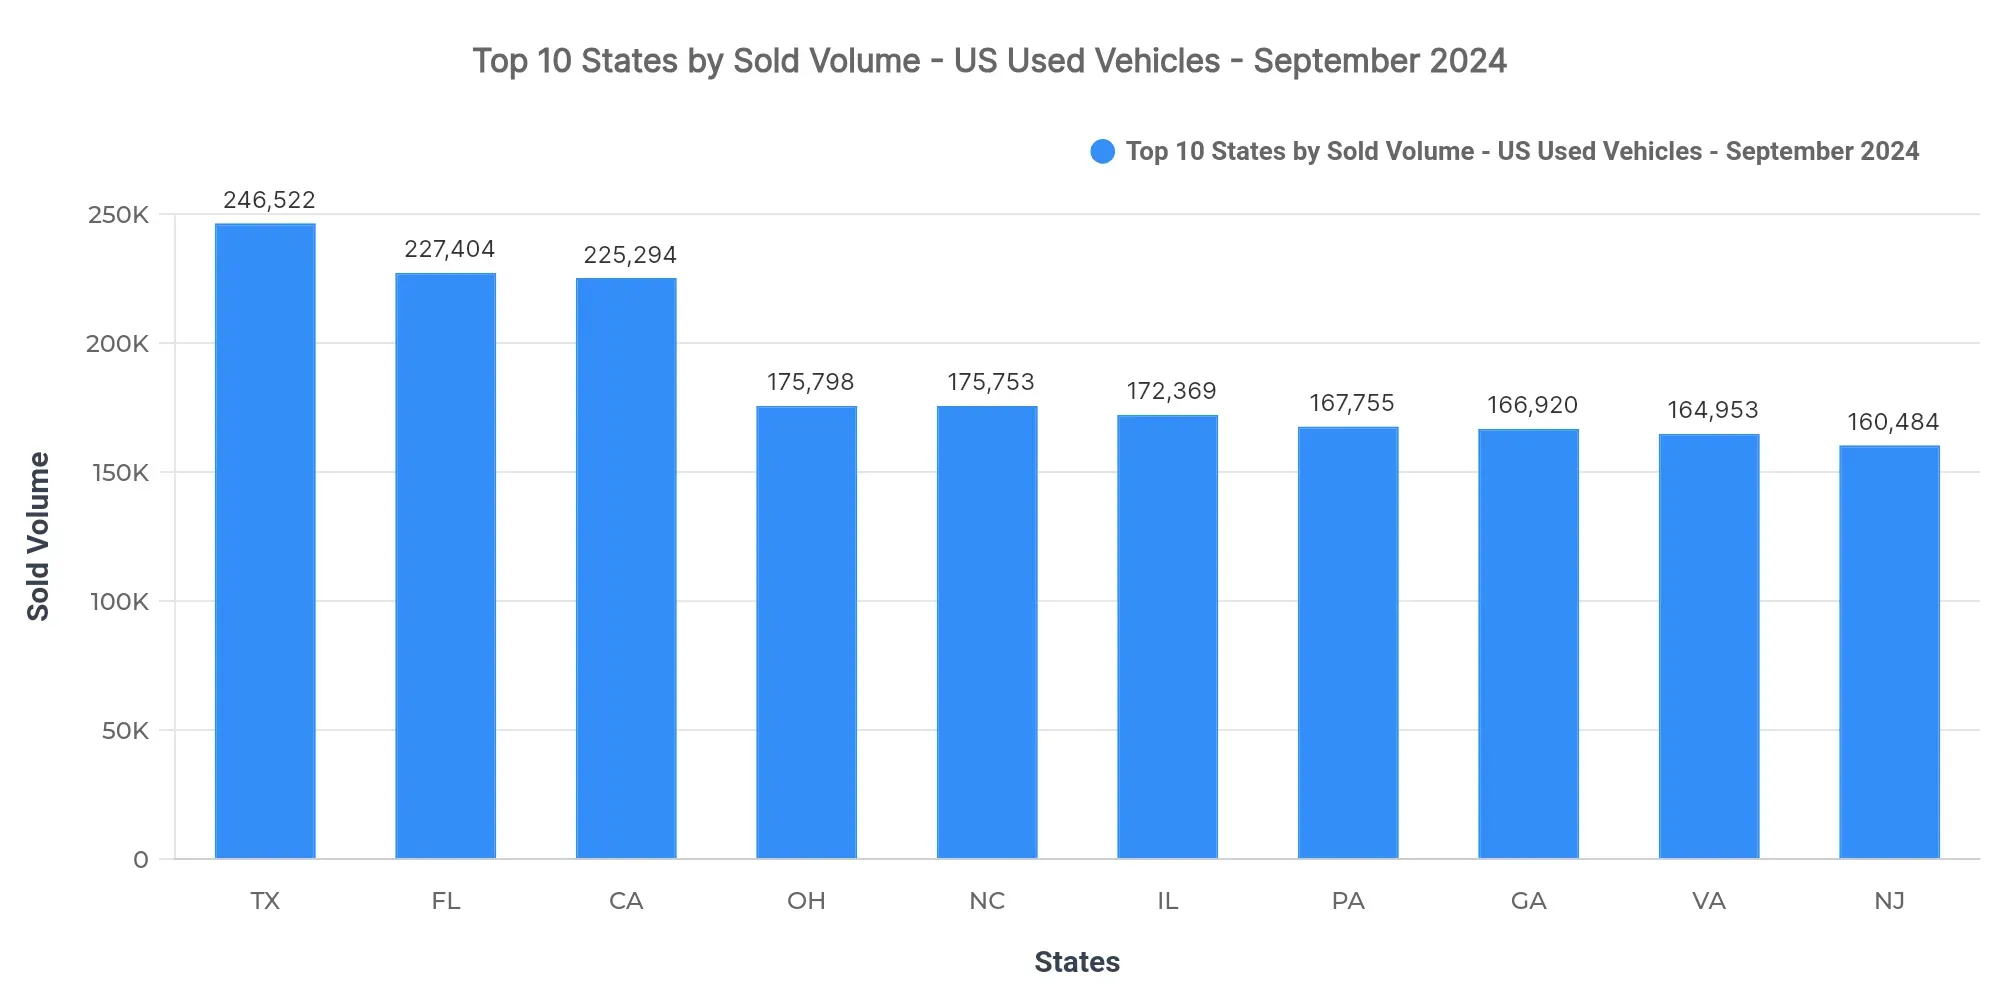
Texas (246,522), Florida (227,404), and California (225,294) lead in sales volume, together accounting for a combined 11.5% of the national sold volume. The remaining top-10 states are Ohio, North Carolina, Illinois, Pennsylvania, Georgia, Virginia, and New Jersey, which also demonstrate high market activity.
The concentration in these top states reflects their large populations and established dealership networks, which facilitate high turnover. Regional demand also aligns with urban centers and economic hubs, suggesting a correlation between population density and market volume.
Price Breakdown: Top 10 States by Sold Volume
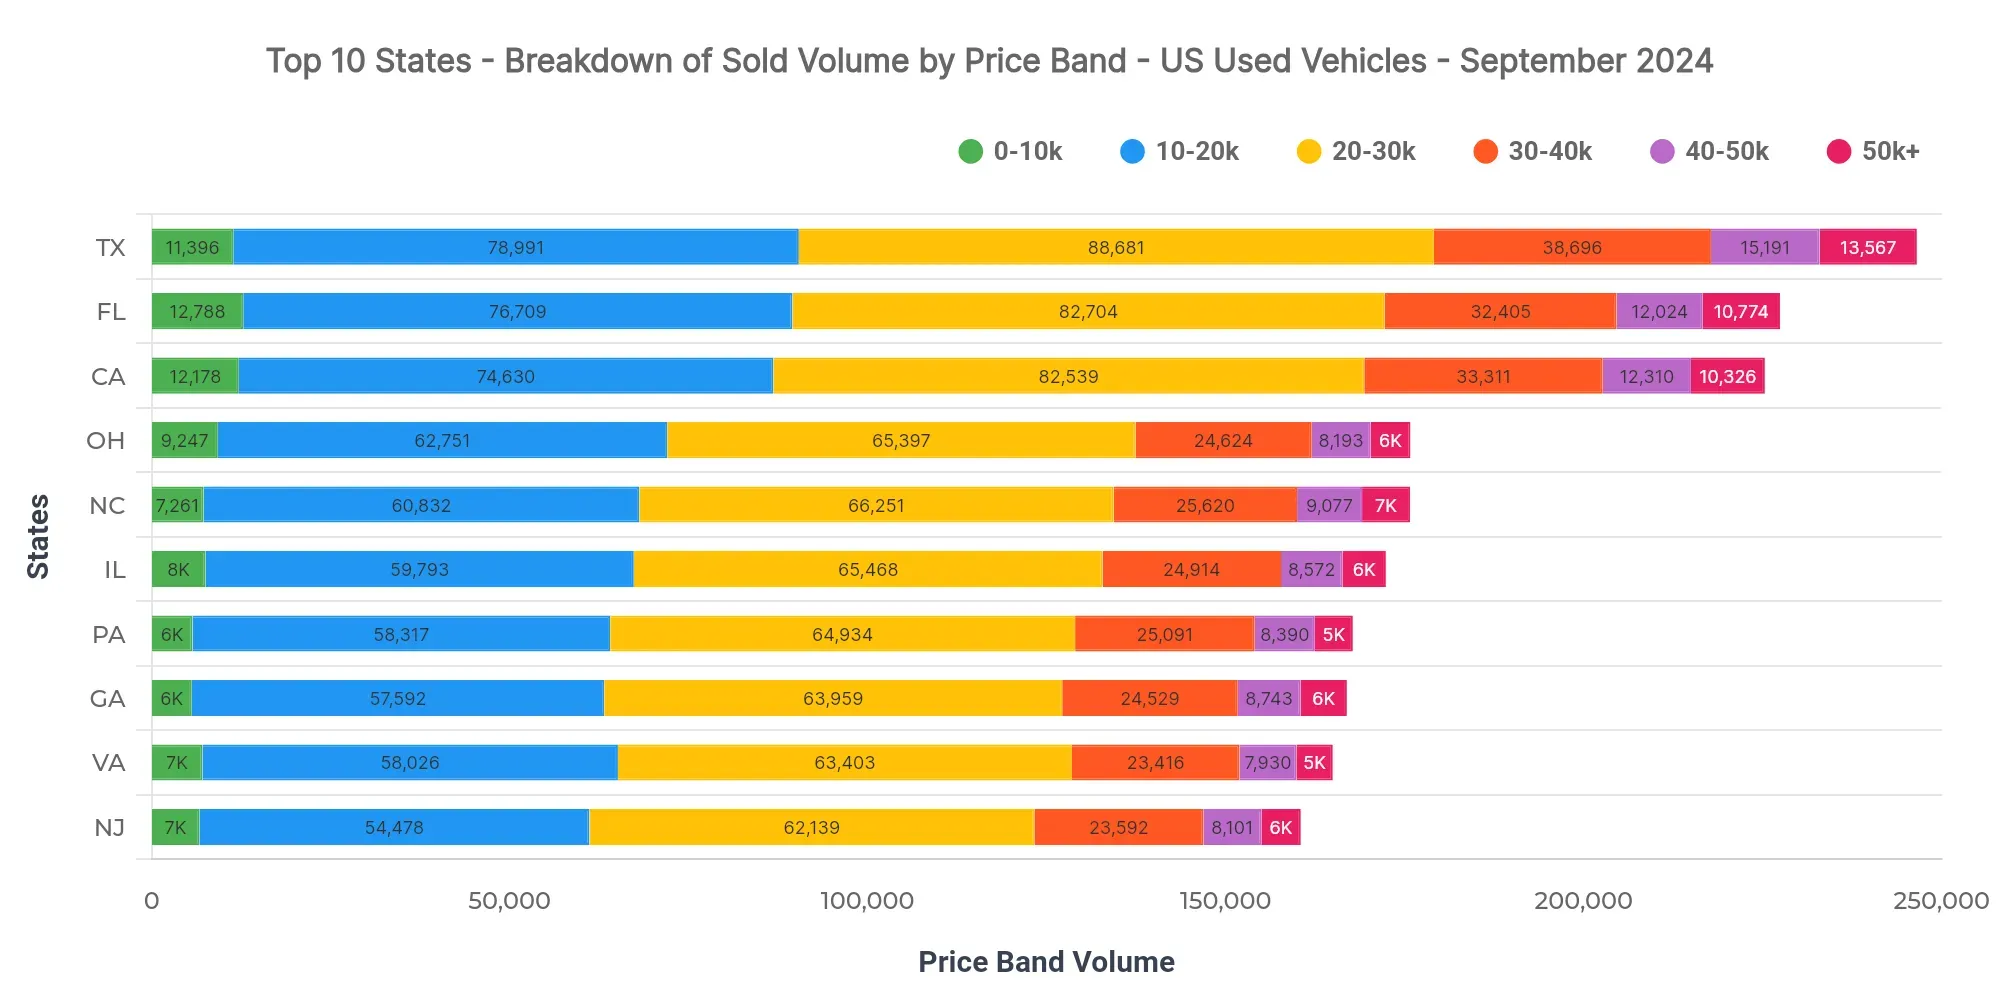
In Texas, the dominant price bands are $20K–$30K (36%), $10K–$20K (32%), and $30K–$40K (15.7%). The $40K–$50K band garners a modest share at 6.2%, while higher segments are even more limited. Comparatively, Florida and California have average sold prices at $25,246 and $25,843, respectively.
For dealers, focusing on the $20K–$30K range in Texas is crucial to tapping the largest customer base effectively. Pricing remains competitive, with implications for financing strategies and inventory management.
Market Breakdown by Fuel Types
| Fuel Type | Listings Count | Sold Count | Avg Listing Price | Avg Sold Price |
|---|---|---|---|---|
| ICE | 2.38M | 1.23M | $25,672 | $25,155 |
| Hybrid | 47.4K | 24.8K | $27,724 | $26,962 |
| EV | 45.9K | 24.3K | $34,052 | $31,855 |
| Other | 224 | 132 | $15,581 | $15,559 |
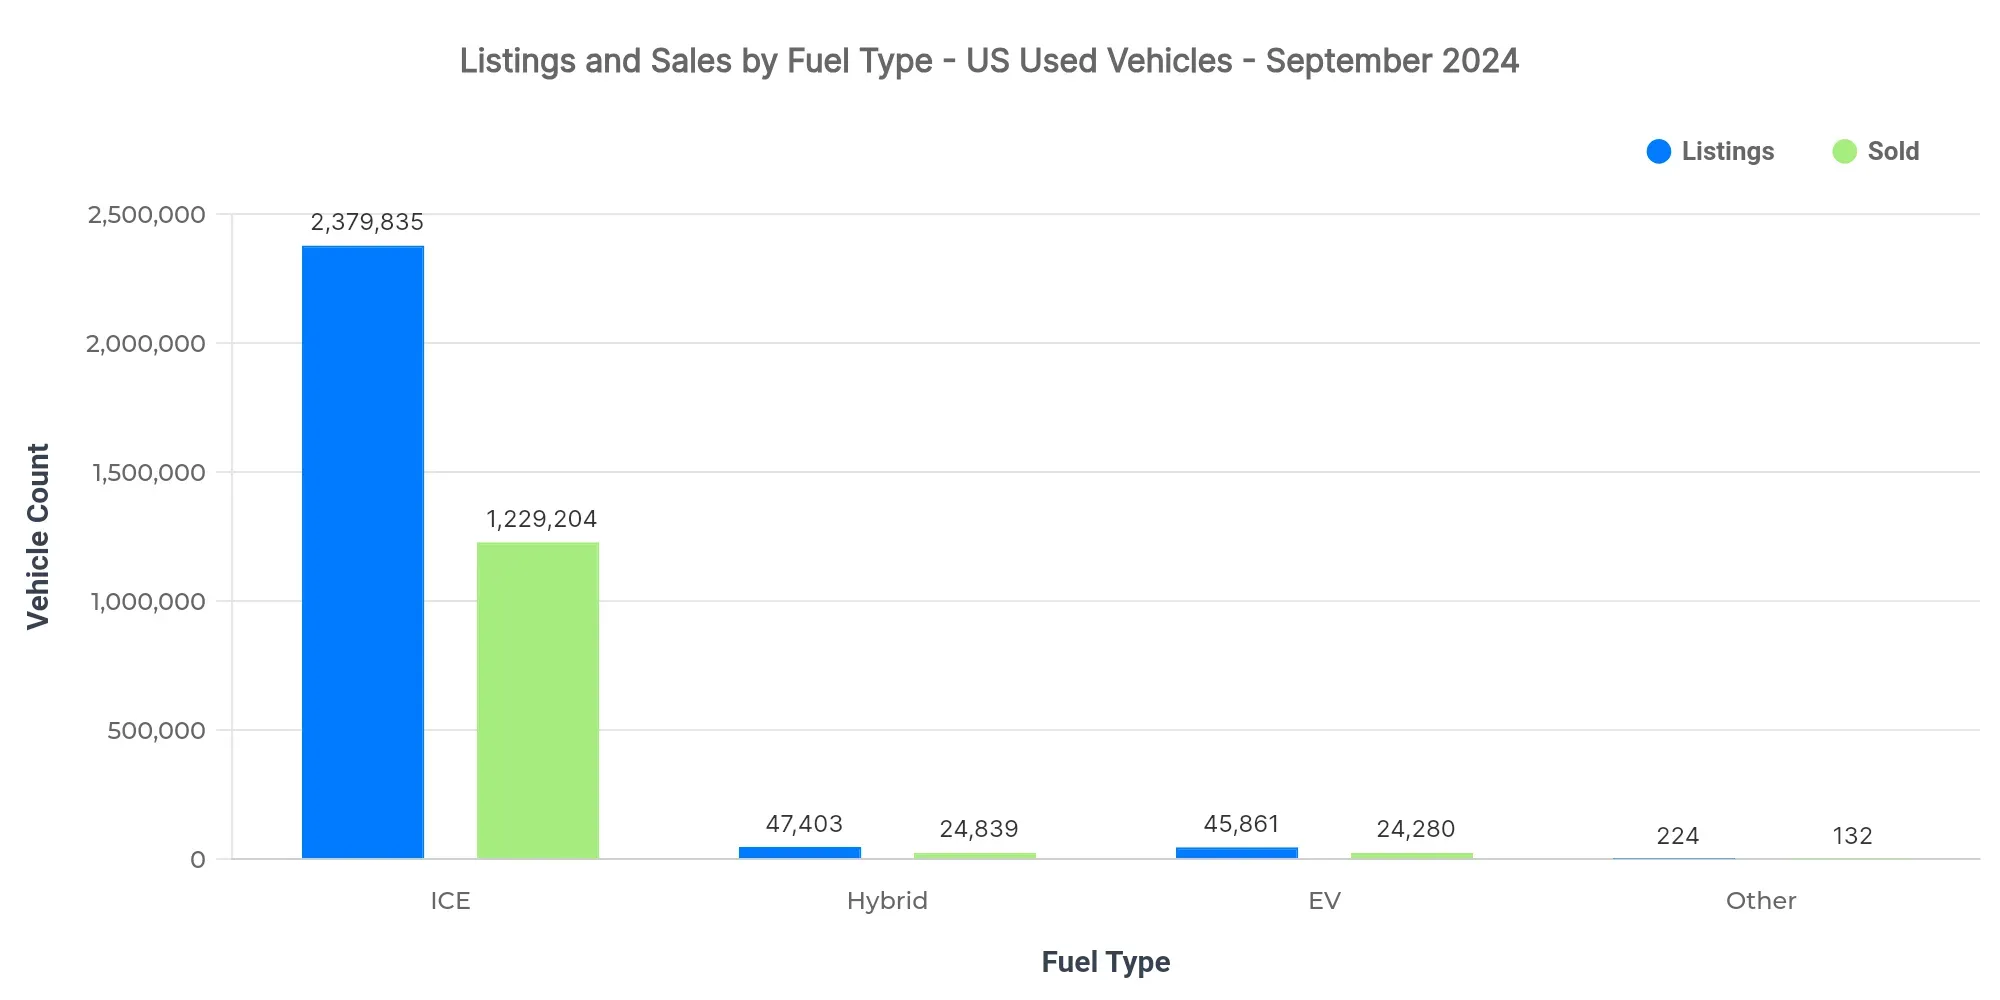
The dominant fuel type by both sales volume and listings is ICE, reflecting its entrenched position in the market. EVs, despite lower volumes, command premium pricing. The hybrid market shows strong involvement but lags in price competitiveness.
- EV adoption remains niche but shows enhanced consumer willingness to pay a premium.
- ICE maintains dominance but price pressure could rise with stricter emission standards.
- Future shifts may hinge on technological advancements and policy incentives.
Market Share by Body Types
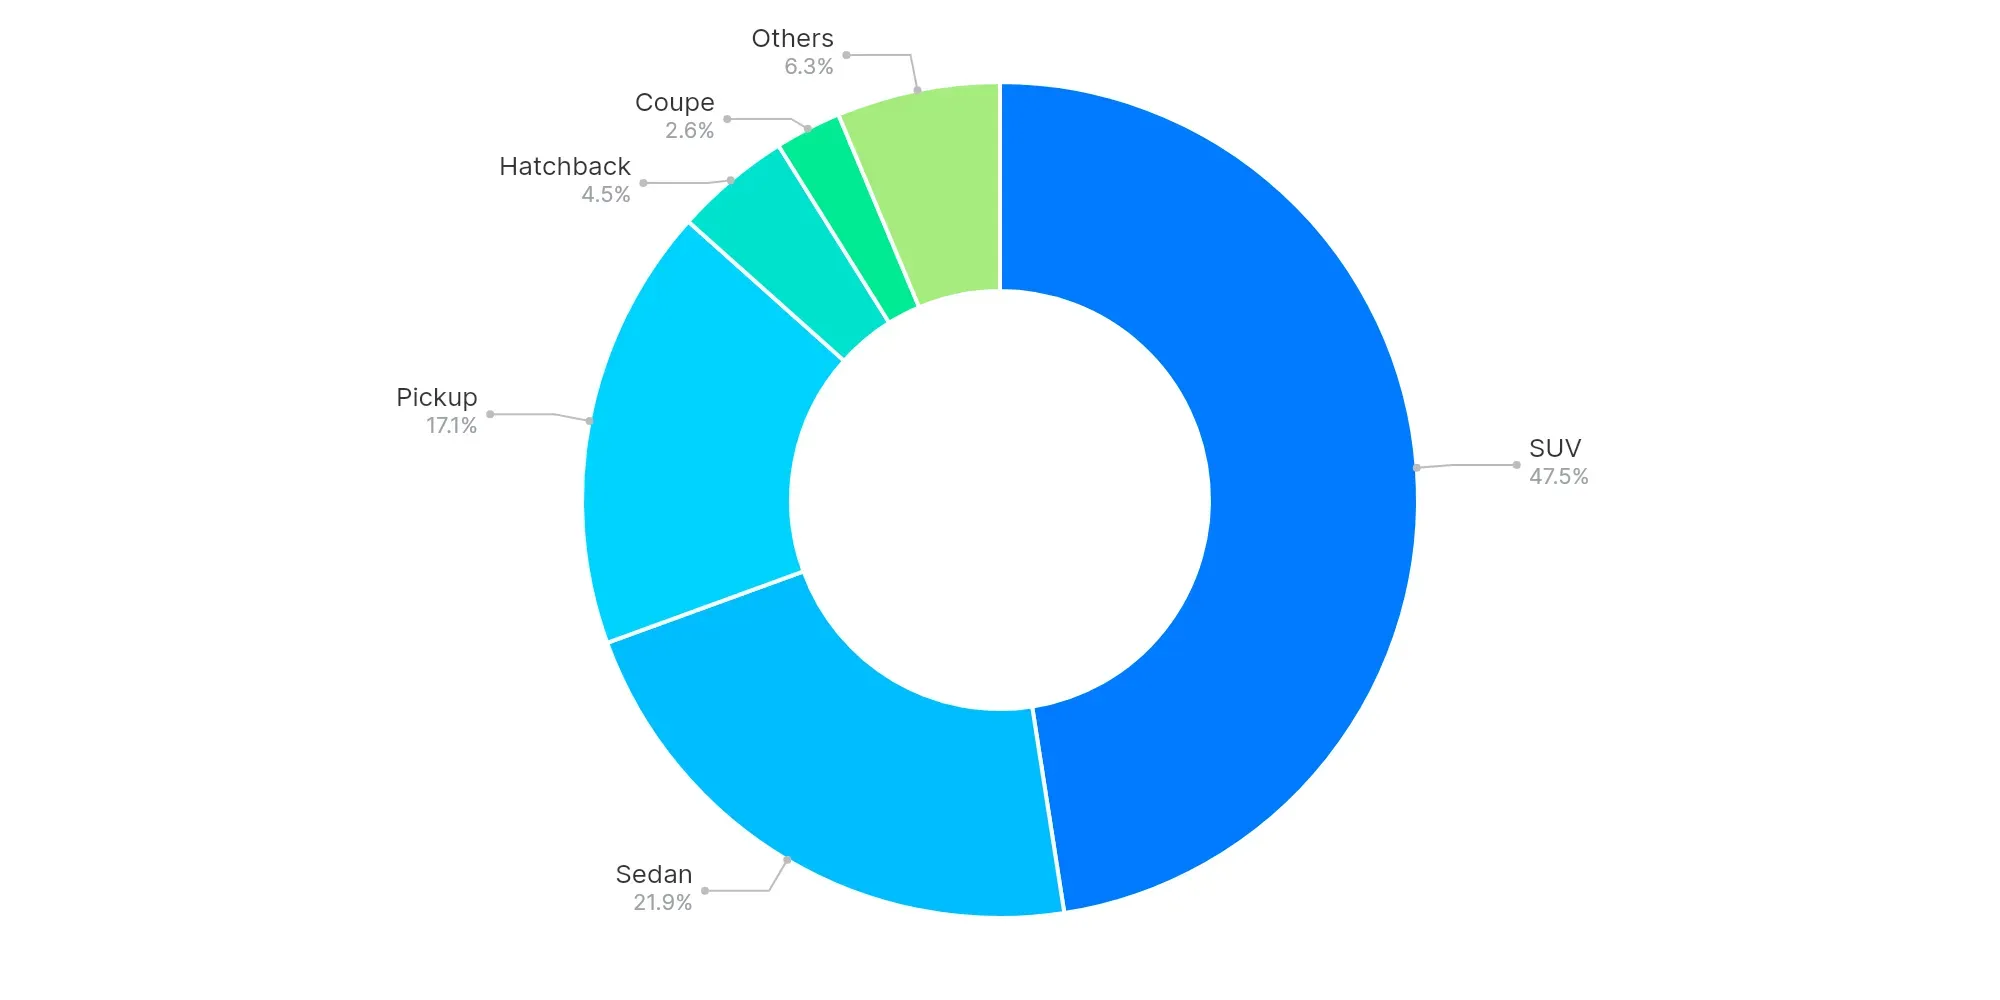
SUV (47.5%), Sedan (21.9%), and Pickup (17.1%) dominate the body type market. Larger vehicle segments like SUVs and Pickups are preferred prominently, indicating a consumer trend towards spacious and versatile vehicles.
The data suggests a strong consumer preference for practicality and comfort, emphasizing opportunities in the SUV and Pickup markets.
High-Volume vs Low-Volume States (Executive Insights)
- Top-performing states: Texas, Florida, California
- Underpenetrated regions: Virgin Islands, American Samoa, Northern Mariana Islands
- Key price bands: $20K–$30K, $10K–$20K, $30K–$40K
- EV trend: Limited yet premium, indicating growth potential in targeted regions
- Buyer preferences: Lean towards SUVs and practical, cost-effective models
In summary, the US used vehicle market in September 2024 indicates robust dealership activities concentrated in populous states with diverse pricing strategies. Insights into fuel type preferences and body type trends provide direction for optimizing market strategies. For dealers, aligning inventories with dominant price bands and consumer preferences will be critical for maintaining competitive advantage. Data-driven approaches and adaptations to evolving consumer demands will remain essential for market leadership.