

US Monthly Used Car Market Data – September 2023
This report delves into September 2023 trends in the US used vehicle market, including dealership activity, sales volume, pricing, fuel types, body types, and regional performance. By highlighting top and bottom performers, the analysis provides essential insights for stakeholders to optimize their strategies.
Number of Dealerships by State
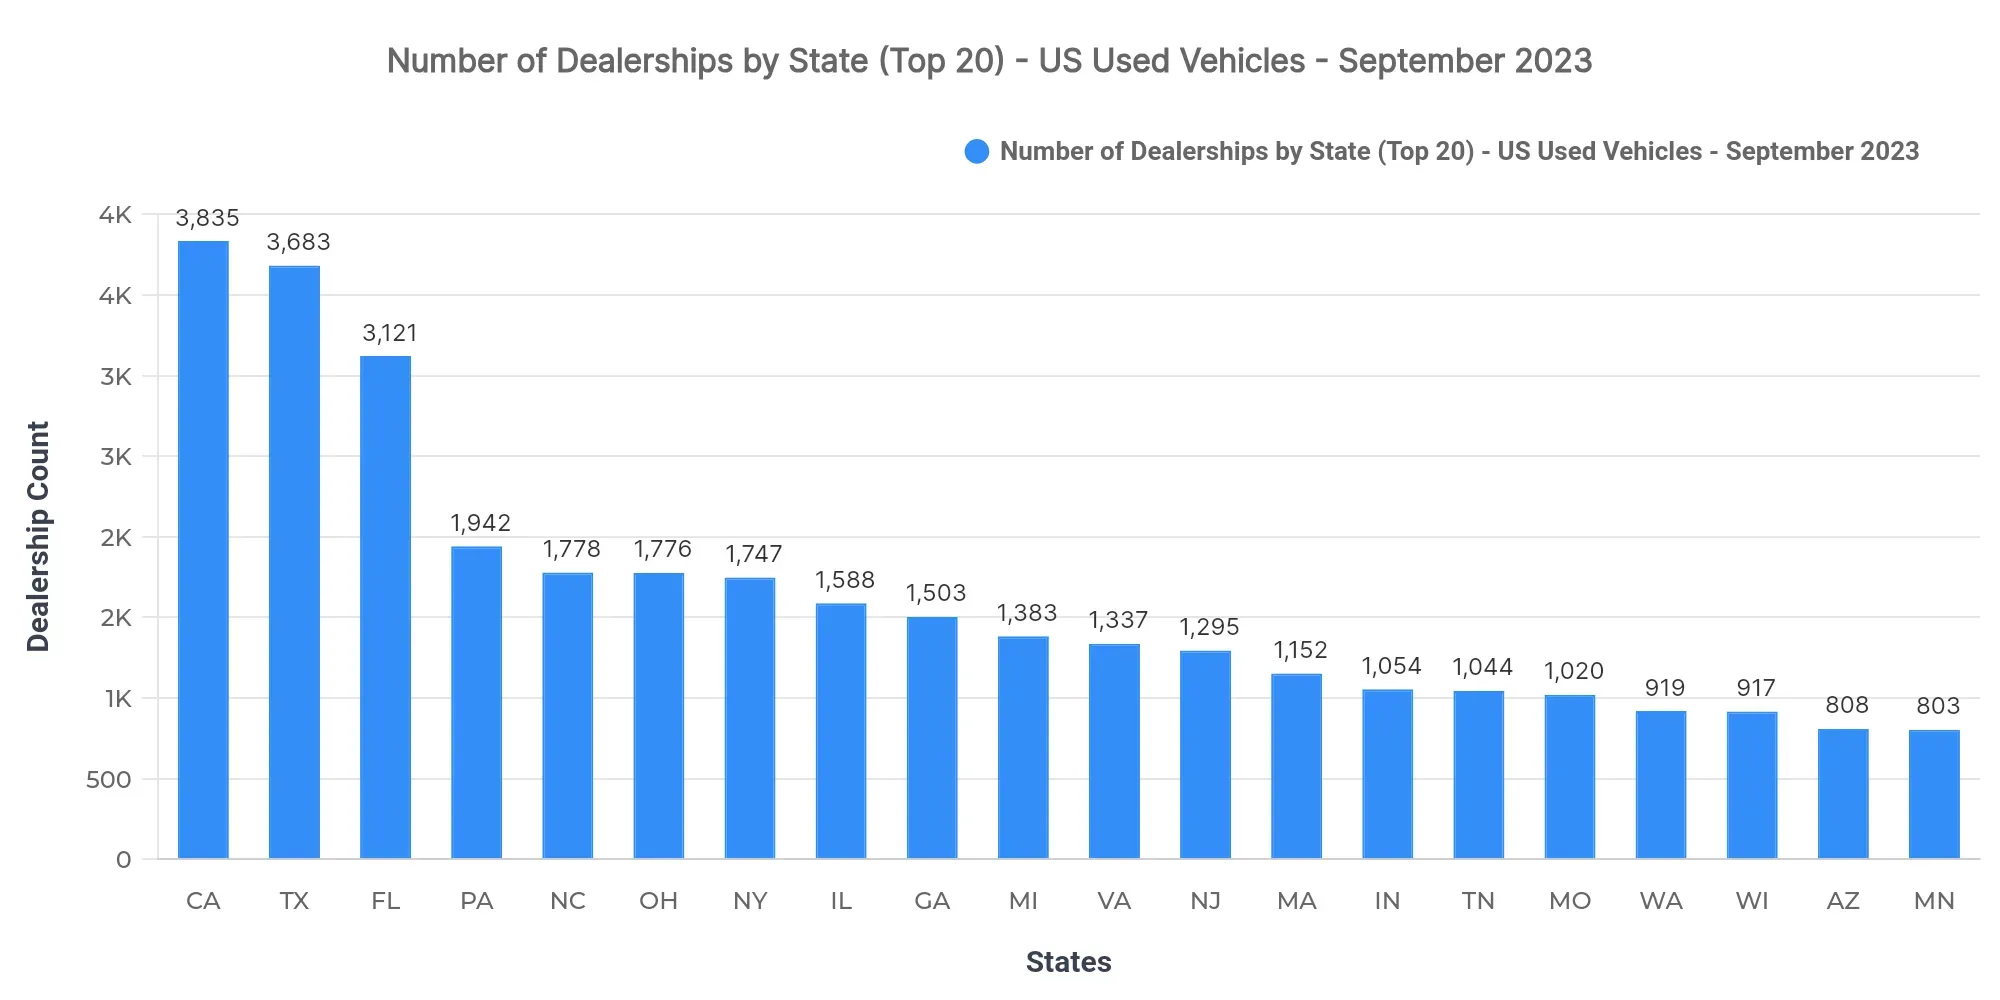
California (3,835), Texas (3,683), and Florida (3,121) lead in dealership counts, indicating a high market concentration in these populous states. The saturation of dealerships here suggests a highly competitive market landscape, potentially pushing dealers to innovate in customer acquisition and retention strategies.
Top 10 States by Sold Volume
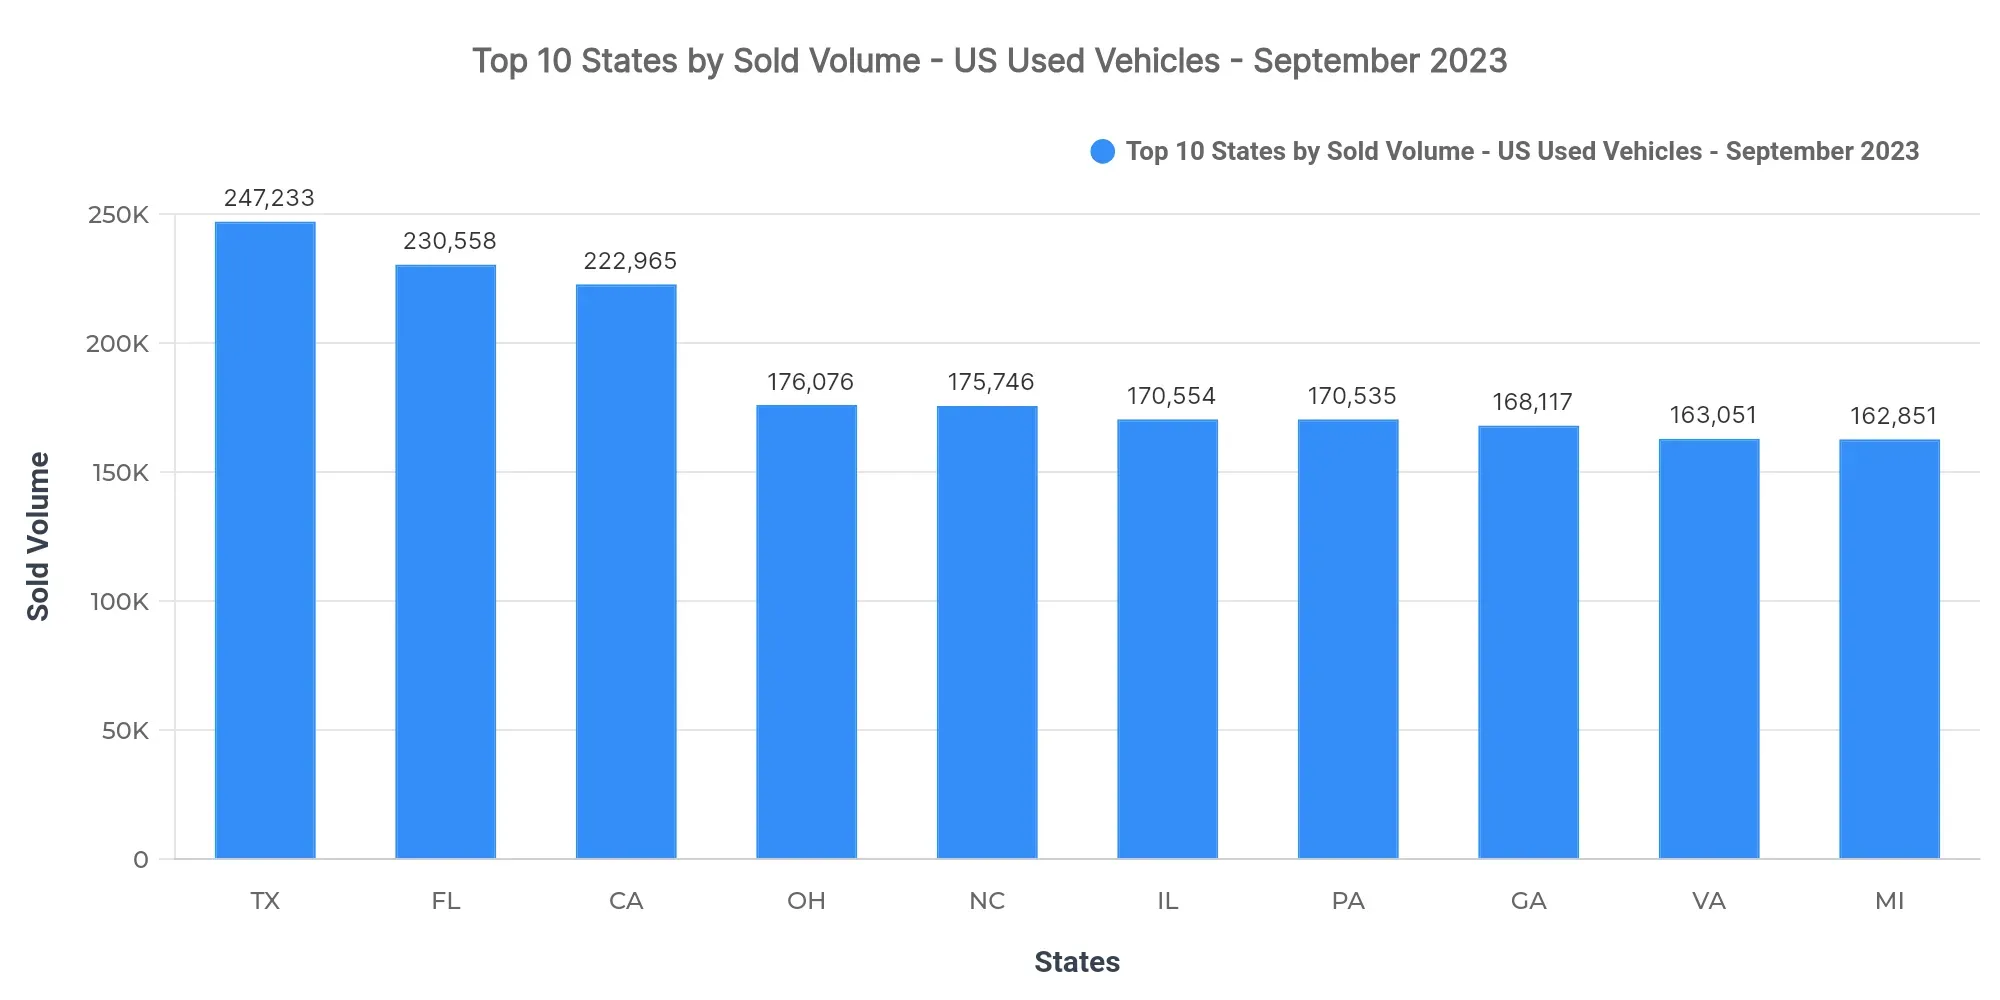
Texas (247,233), Florida (230,558), and California (222,965) lead in sold volume, collectively accounting for 11.3% of the national sold volume. The next top-10 states include Ohio, North Carolina, Illinois, Pennsylvania, Georgia, Virginia, and Michigan. Given their combined influence, these states play a critical role in the national market's sales dynamics. The overarching trend points to robust demand in Southern and Midwestern states, likely driven by economic factors and population mobility.
Price Breakdown: Top 10 States by Sold Volume
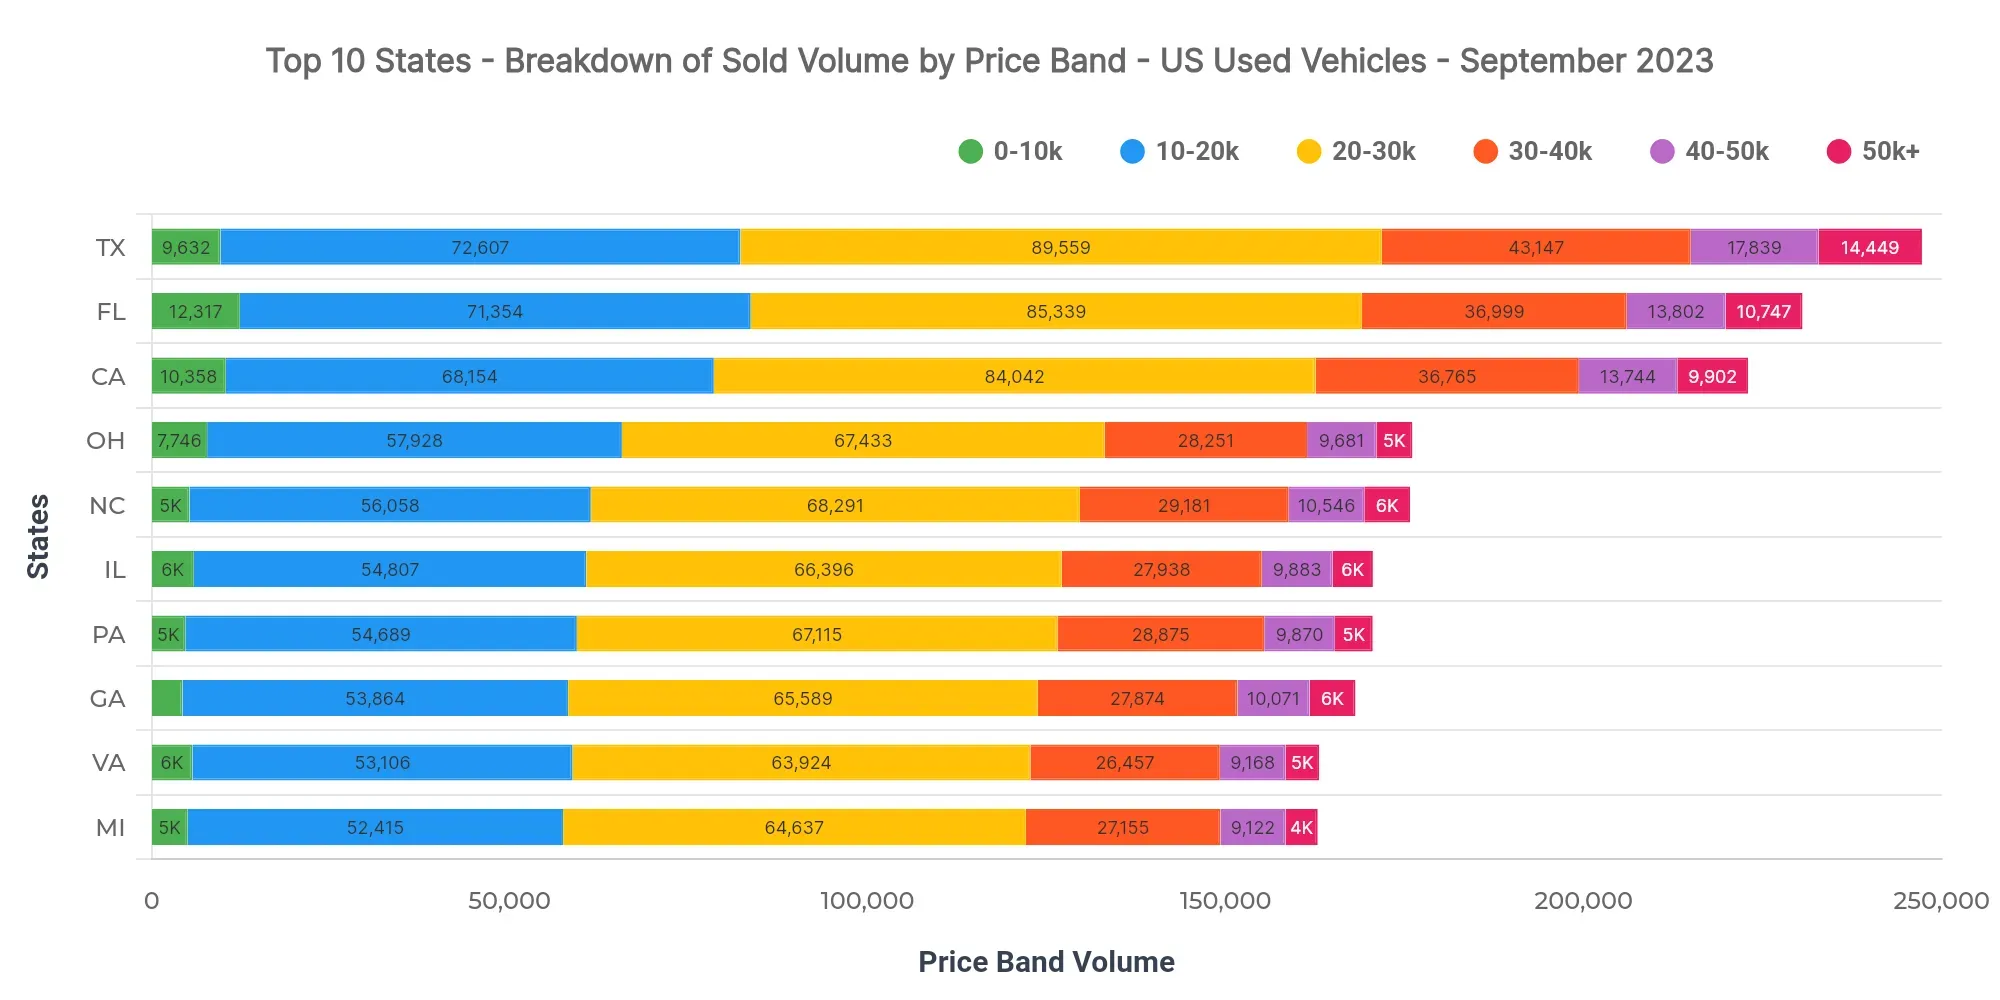
For Texas, dominant price bands include $20K–$30K (36.2%), $10K–$20K (29.4%), and $30K–$40K (17.5%). A notable presence exists in the $40K–$50K range (7.2%) and $50K+ range (5.8%). In comparison, Florida at $26,281 and California at $26,662 reflect similar competitive pricing. Dealers can leverage this data to fine-tune inventory to prevailing price bands, enhancing sales strategies. Pricing strategies may also have to incorporate lending conditions that influence consumer purchasing power.
Market Breakdown by Fuel Types
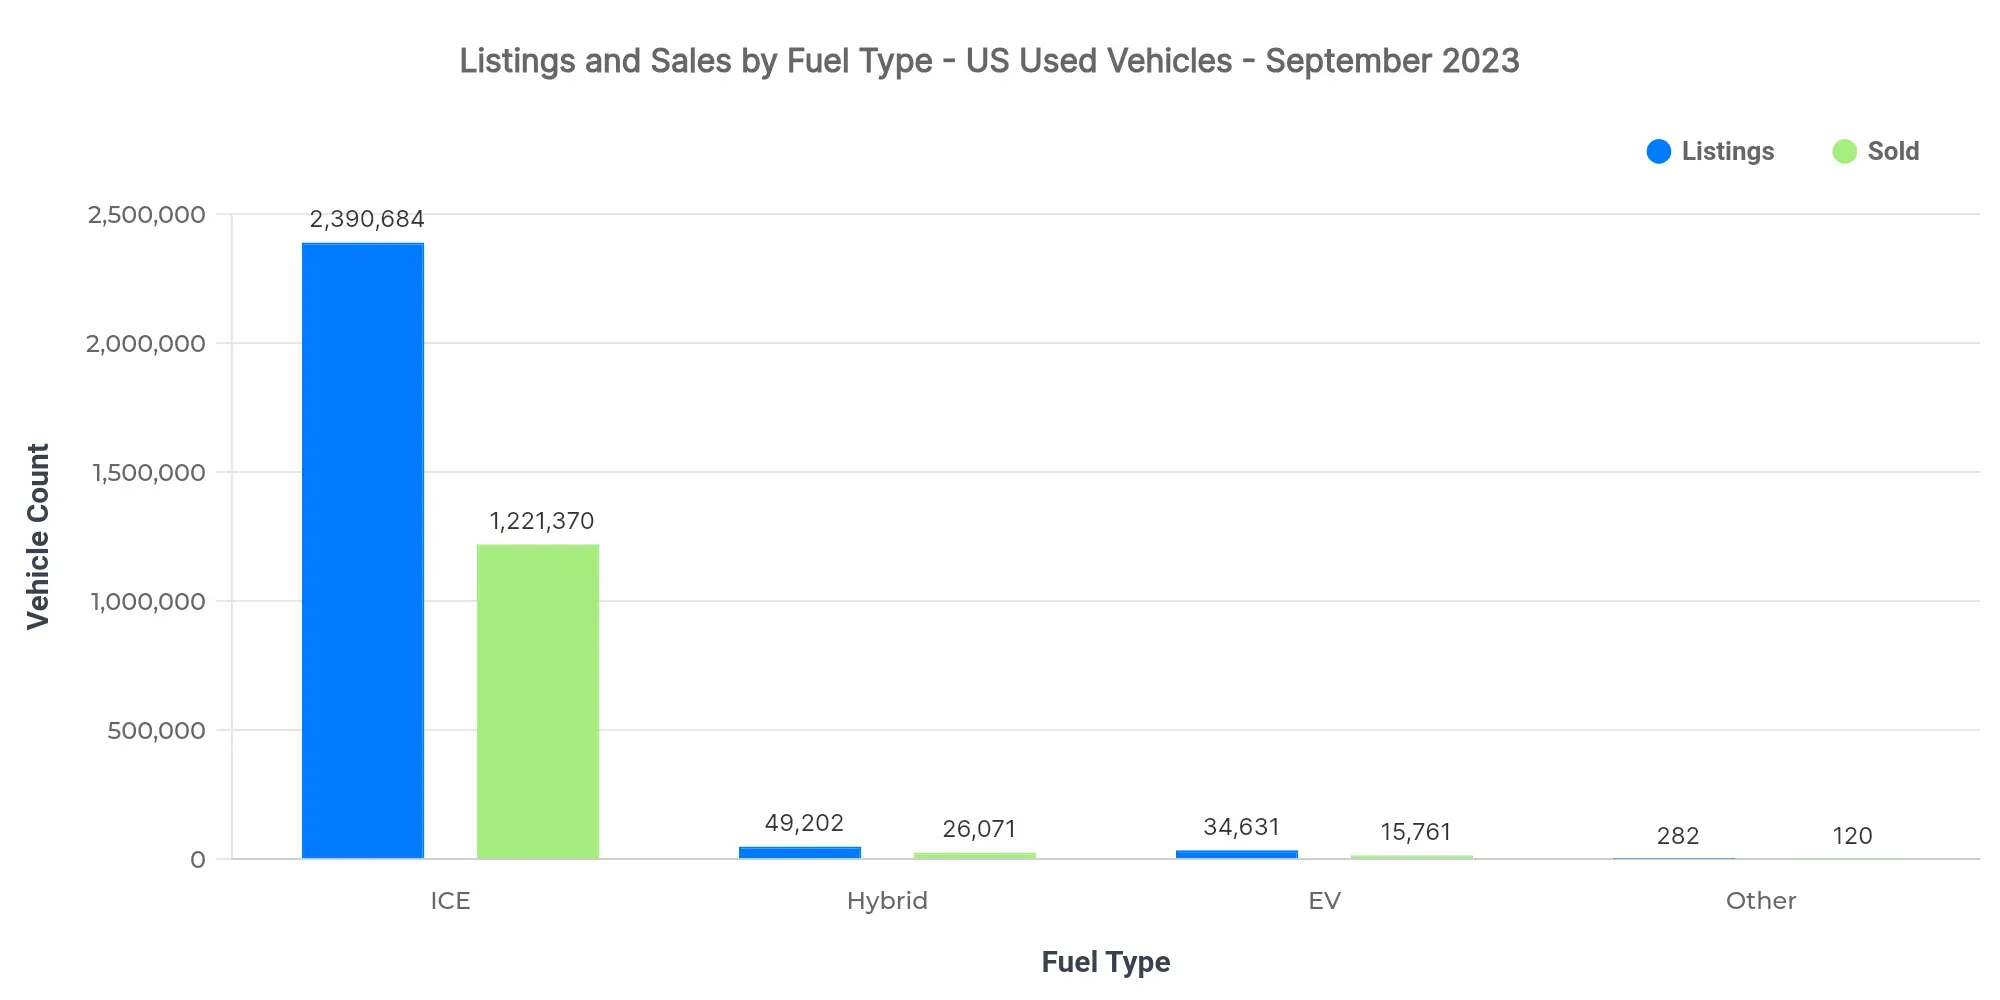
The dominant fuel type by sales volume and listings is ICE, signaling a continued preference for traditional engines. Hybrid vehicles show moderate growth, while EVs command a premium with the highest average listing and sold prices. This suggests an emerging market for EVs that could benefit from targeted incentives and financing offers to stimulate adoption.
| Fuel Type | Listings Count | Sold Count | Avg Listing Price | Avg Sold Price |
|---|---|---|---|---|
| ICE | 2.39M | 1.22M | $26,179 | $25,839 |
| Hybrid | 49.20K | 26.07K | $28,104 | $26,742 |
| EV | 34.63K | 15.76K | $43,599 | $39,629 |
| Other | 282 | 120 | $20,663 | $19,704 |
- Despite higher prices, EV adoption indicates consumer willingness to explore alternative fuel types.
- The premium pricing of EVs reflects both technological valuation and rising environmental concerns.
- The dominance of ICE suggests the continuity of traditional segments in overall market dynamics, with transitions driven by gradual change in buyer preferences.
Market Share by Body Types
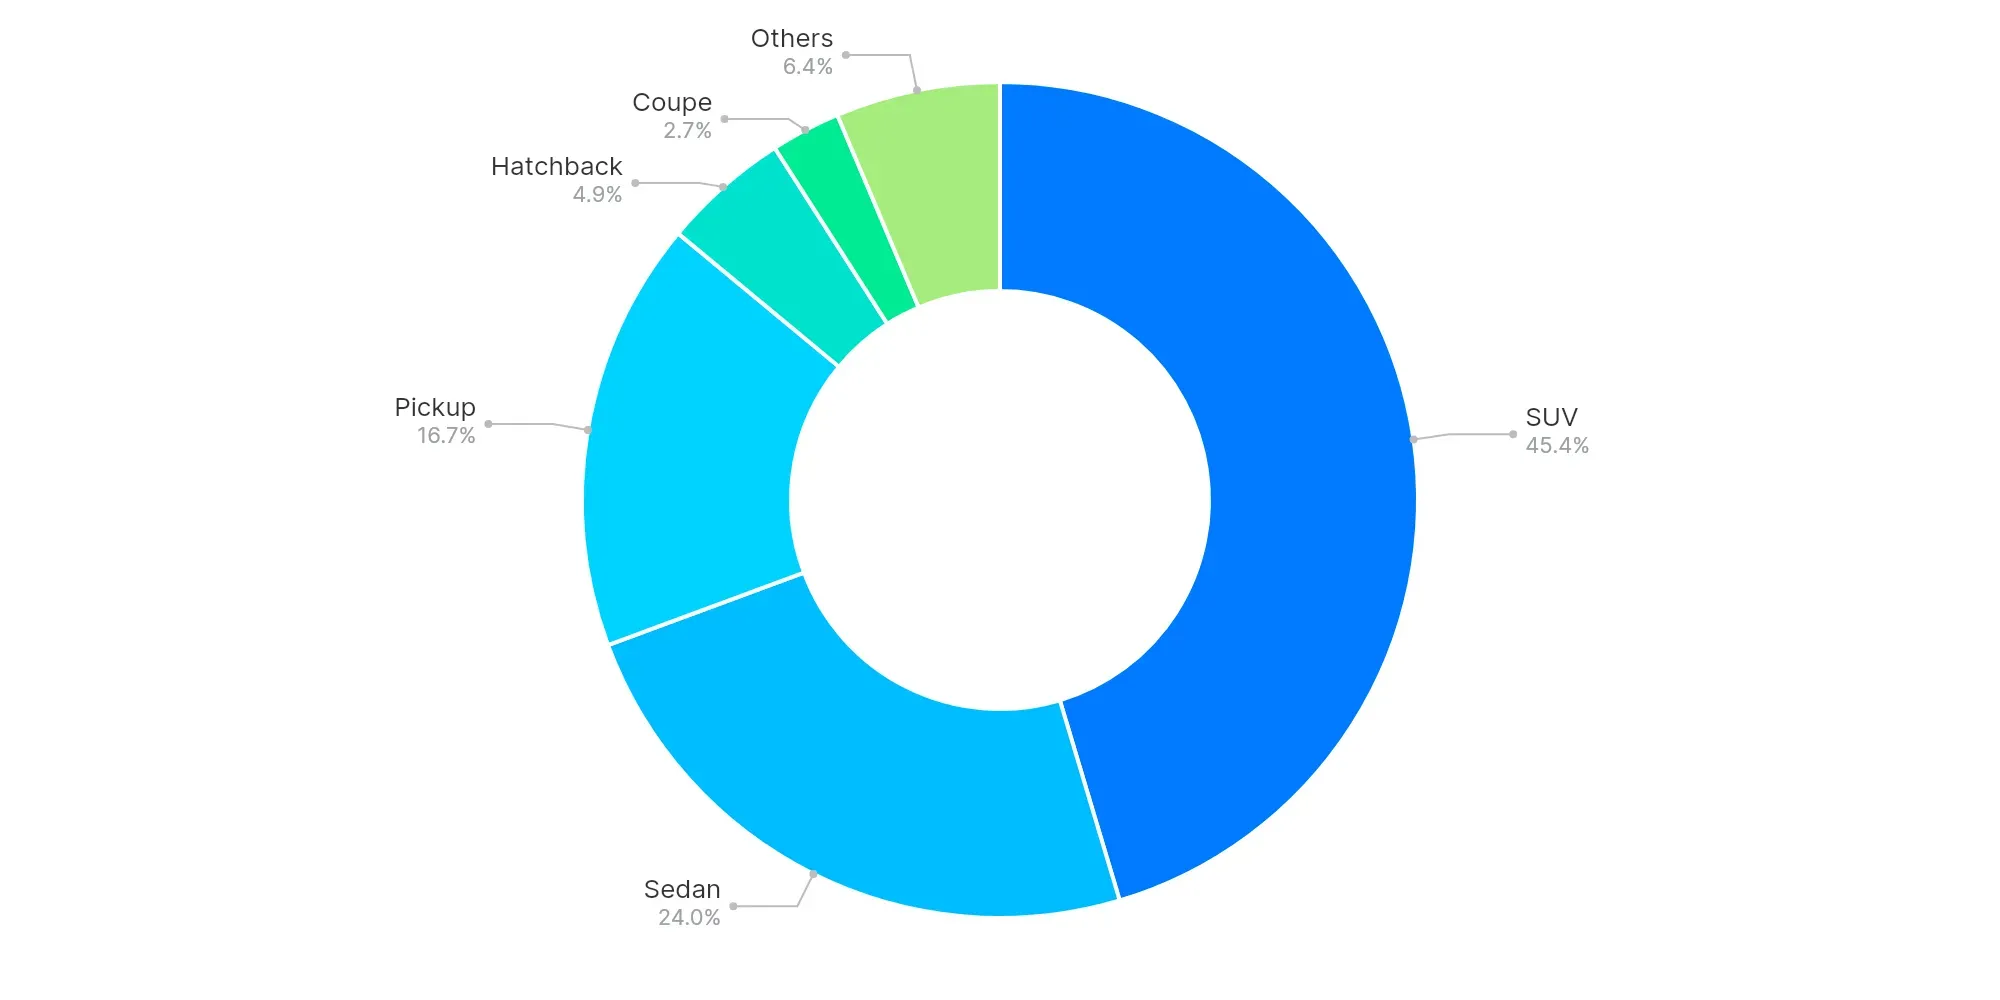
SUVs (45.4%), Sedans (24%), and Pickups (16.7%) lead market shares, highlighting a preference for larger vehicles, particularly SUVs and Pickups. This reveals consumer inclination toward versatile and robust vehicle types, likely influenced by lifestyle and utility considerations.
High-Volume vs Low-Volume States (Executive Insights)
- Top-performing states: Texas, Florida, California
- Underpenetrated regions: Virgin Islands, American Samoa, Northern Mariana Islands
- Key price bands: $20K–$30K, $10K–$20K, $30K–$40K
- EV trend: Steady growth in market adoption
- Buyer preferences: Dominance of SUVs and larger vehicle types
The US used vehicle market exhibits strong regional competition with significant opportunities in underpenetrated areas. For dealers, aligning inventory with popular price bands and considering consumer preferences can achieve better market positioning.