

US Monthly Used Car Market Data – October 2025
This report provides an in-depth analysis of the US used vehicle market for October 2025, focusing on dealer activity, sales volume, and pricing trends. Additionally, it evaluates fuel types, body types, and regional performances to illuminate current market dynamics and key trends.
Number of Dealerships by State
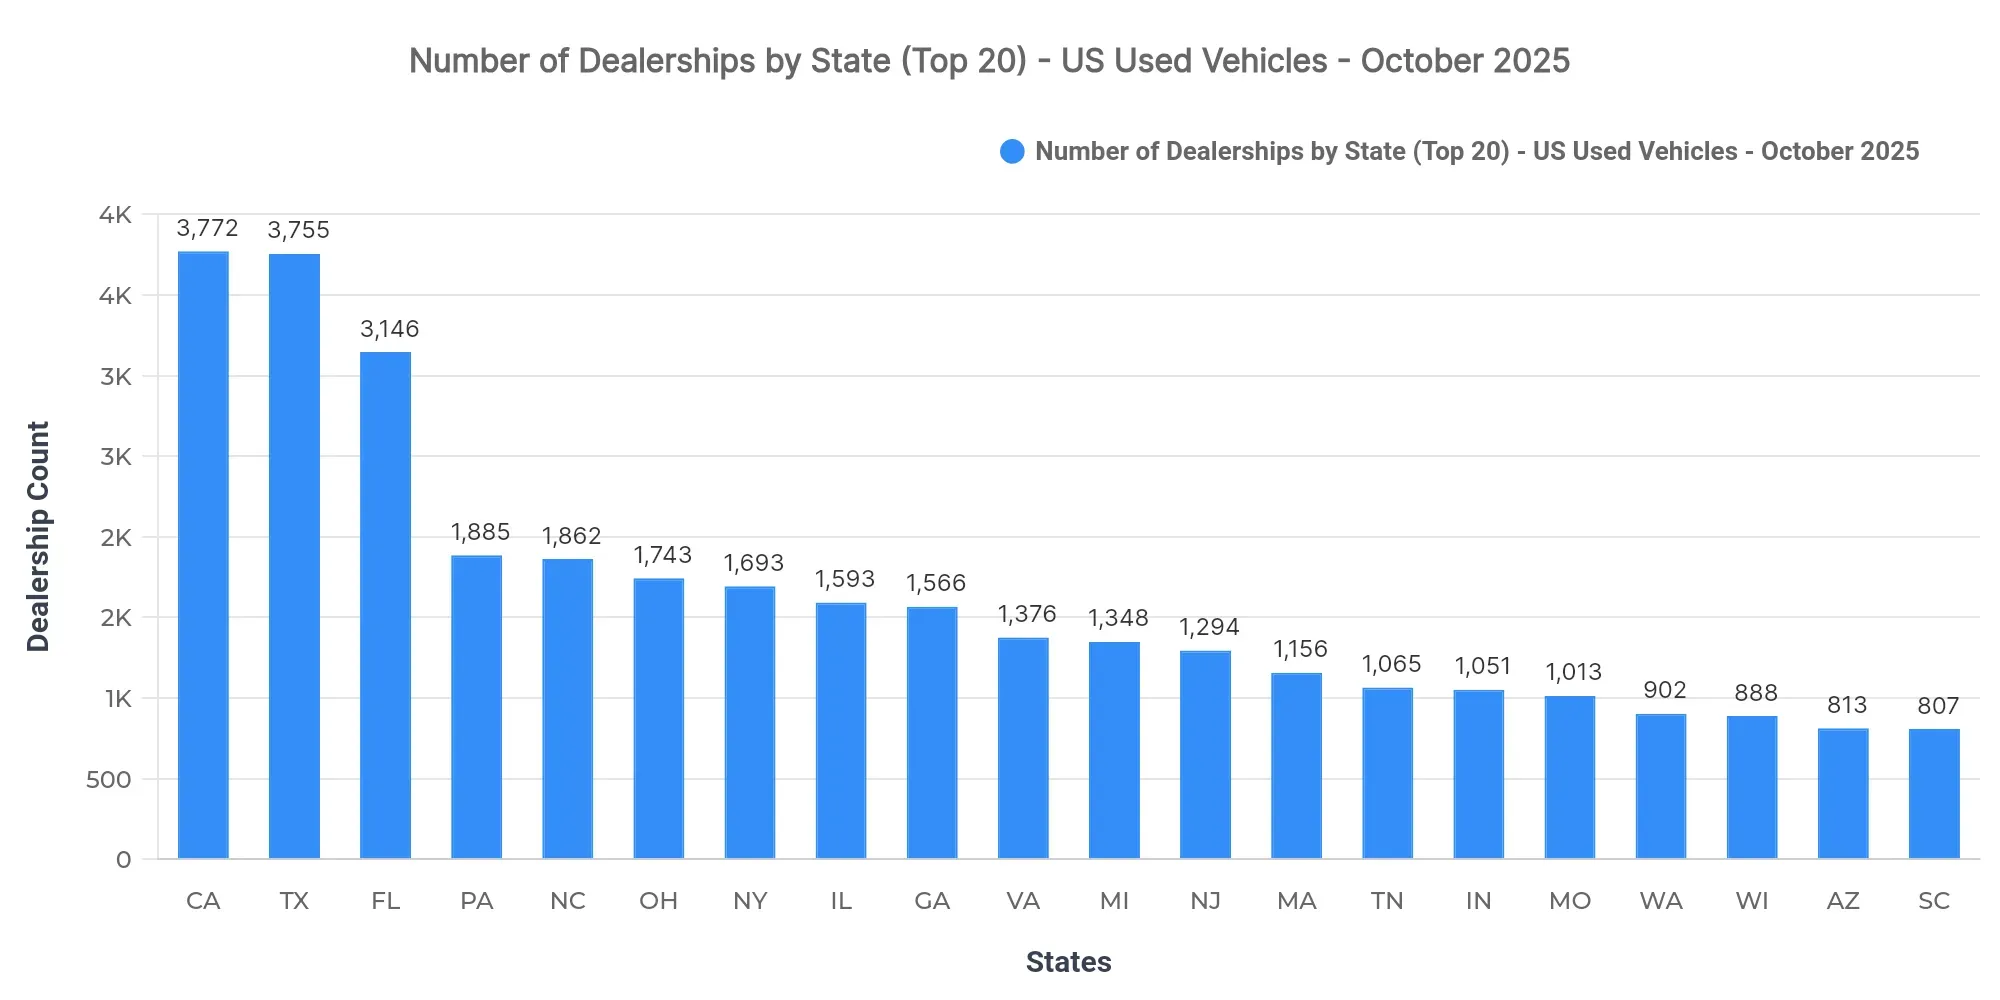
California (3,772), Texas (3,755), and Florida (3,146) lead in the number of dealerships. The high concentration of dealerships in these states suggests a competitive yet saturated market, providing consumers with more options but challenging for dealers to differentiate on service rather than sheer inventory size.
Top 10 States by Sold Volume
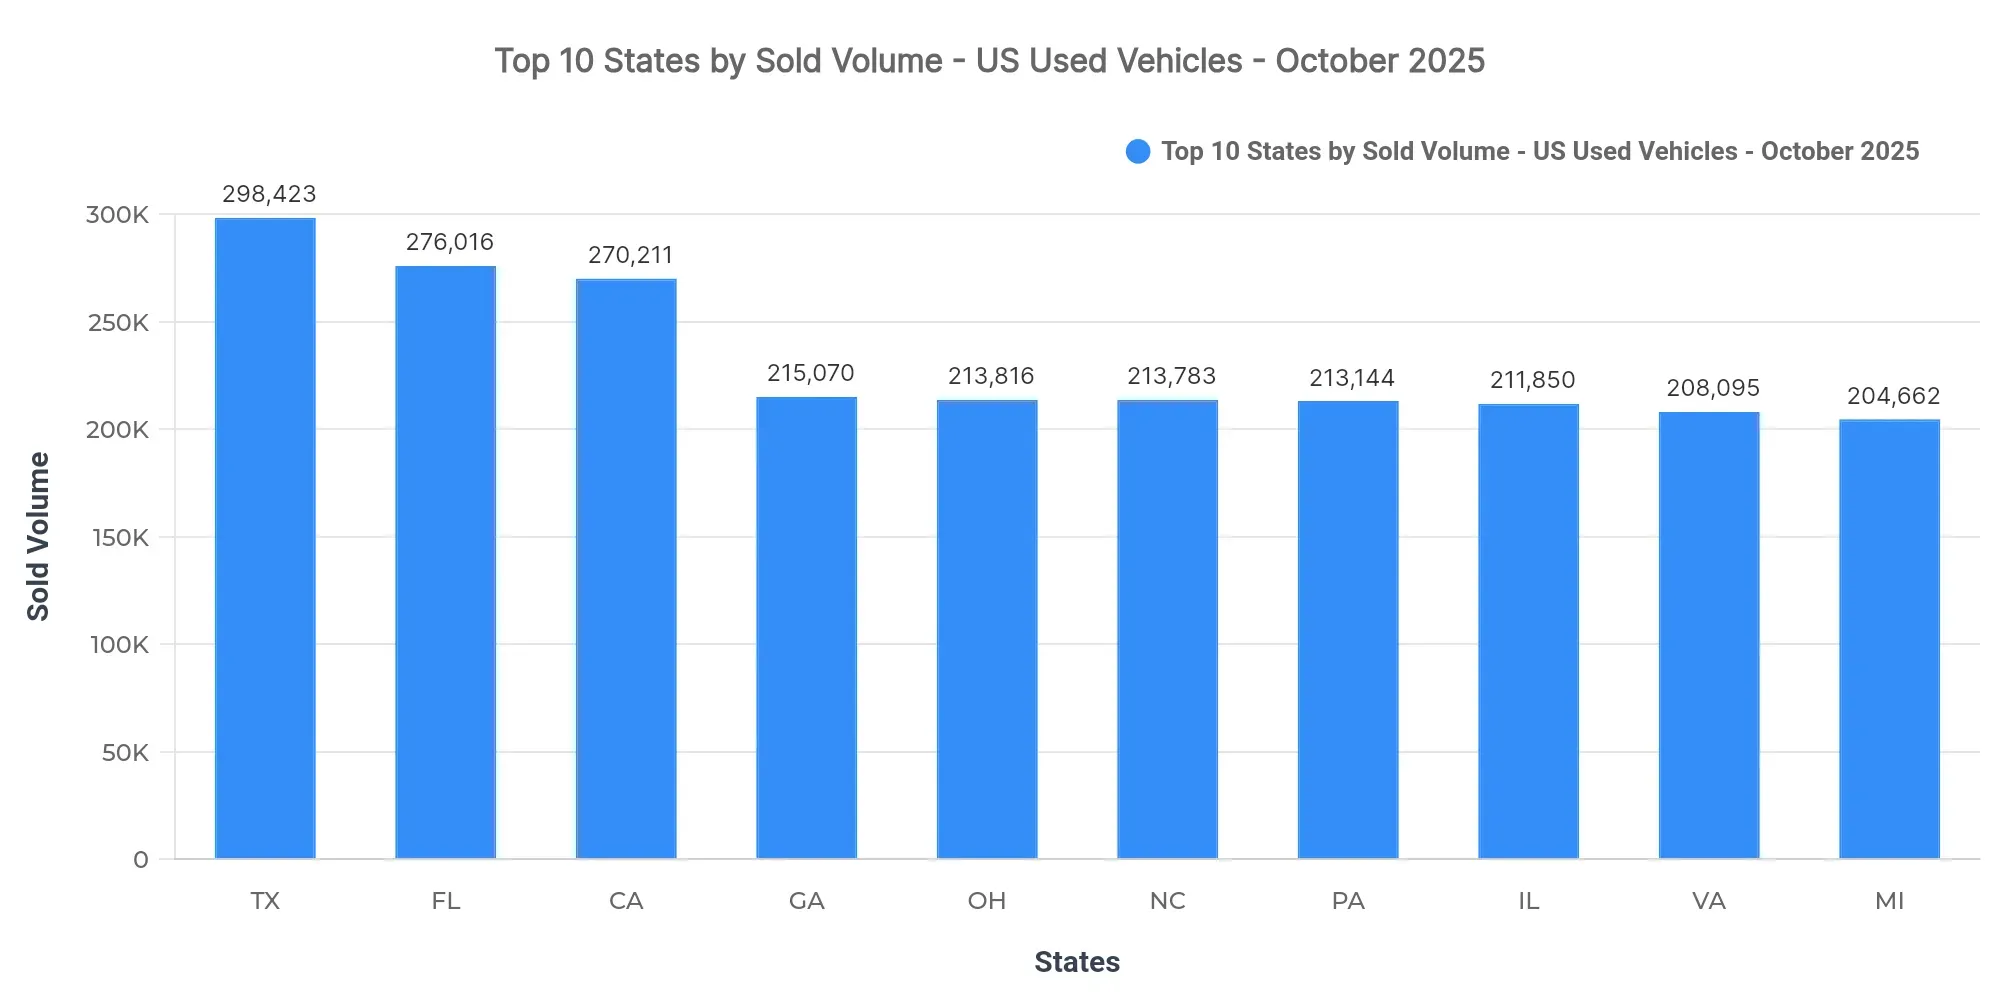
Texas (298,423), Florida (276,016), and California (270,211) lead. The combined share of the top 3 states is 11% of the national sold volume, underscoring their dominance. The remaining top-10 states—Georgia, Ohio, North Carolina, Pennsylvania, Illinois, Virginia, and Michigan—show geographical diversity, indicating a broad distribution of demand.
Market concentration is evident in a few high-performing states that account for a significant portion of national sales. Demand variance by region reflects both economic and demographic factors influencing used car markets, pointing to potential growth areas in less saturated markets.
Price Breakdown: Top 10 States by Sold Volume
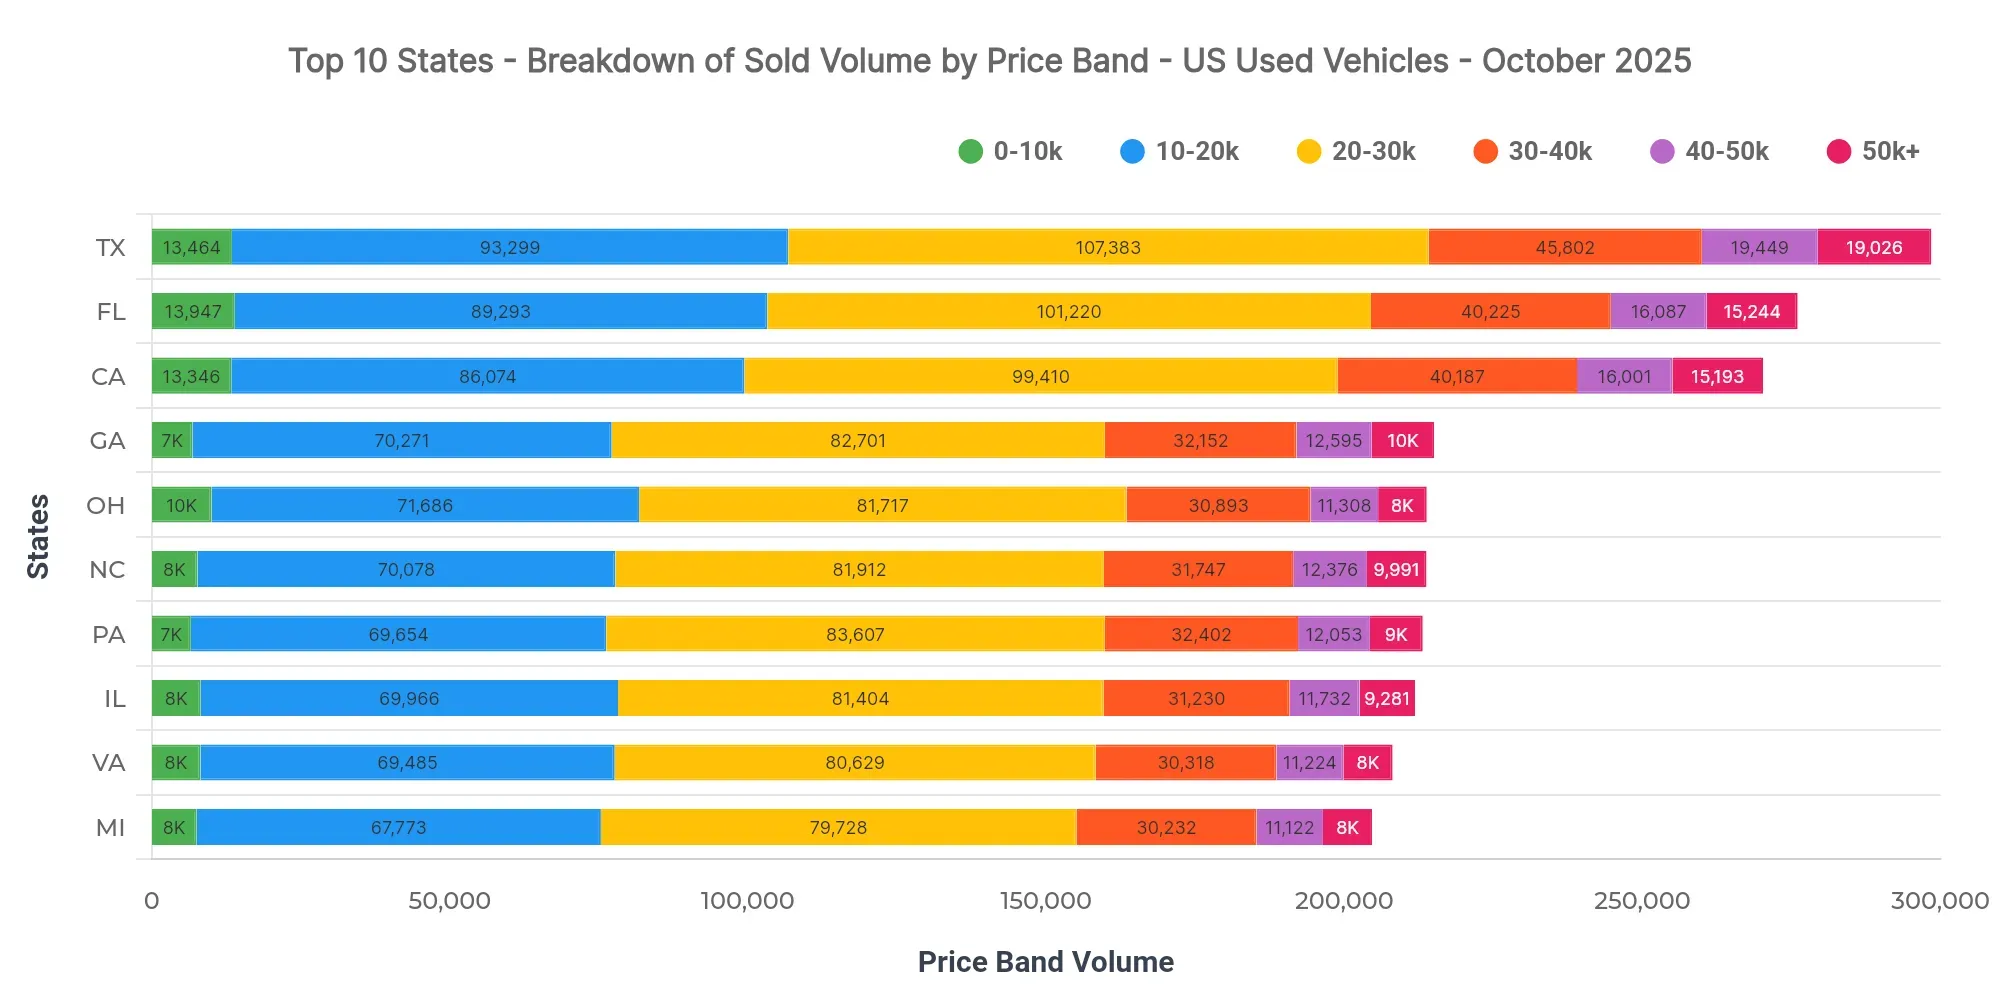
In Texas, key price bands include $20K–$30K (36%), $10K–$20K (31.3%), and $30K–$40K (15.3%). The $40K–$50K band holds 6.5%, suggesting a skew towards mid-market transactions. Comparatively, Florida at $25,914 and California at $26,292 show slightly higher average sold prices but similar band distribution.
For dealers, this indicates a strong market appetite for vehicles priced $20K to $40K, critical for aligning inventory strategies. Pricing dynamics hint at stable lending conditions facilitating mid-range vehicle financing.
Market Breakdown by Fuel Types
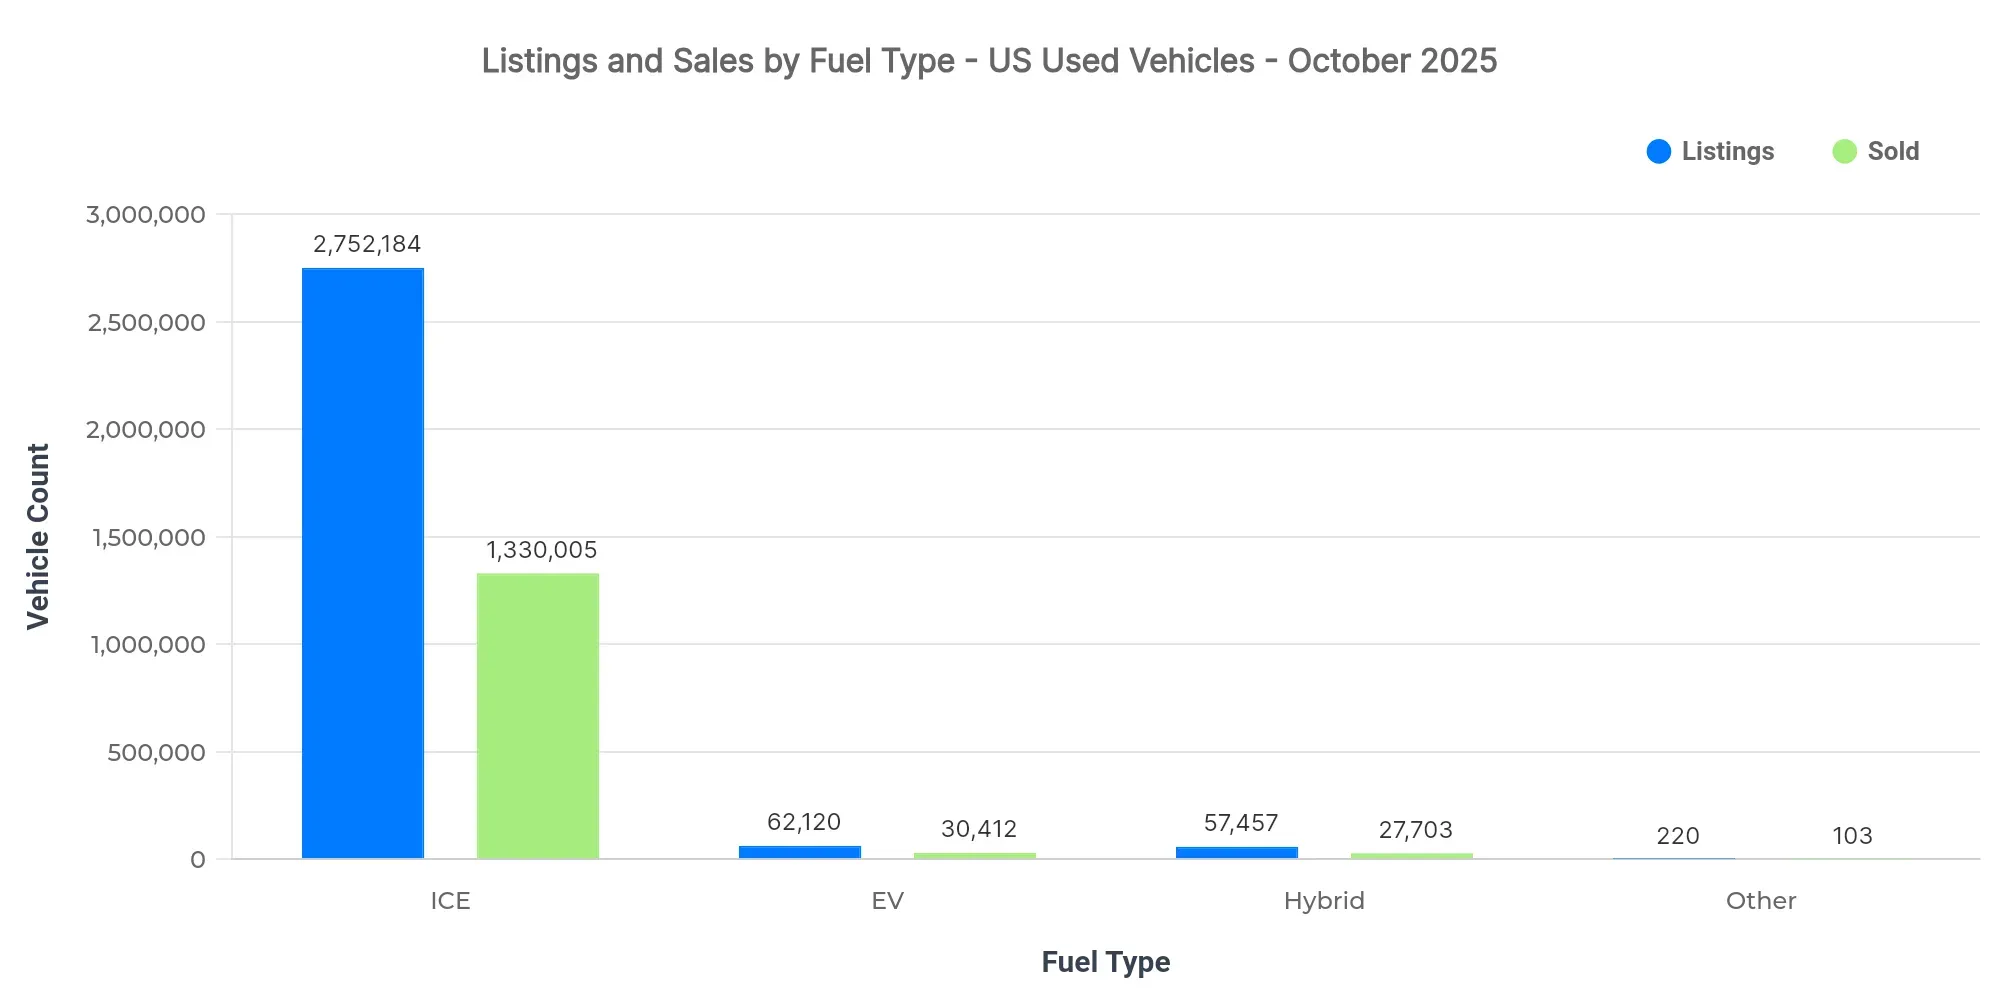
| Fuel Type | Listings Count | Sold Count | Avg Listing Price | Avg Sold Price |
|---|---|---|---|---|
| ICE | 2.75M | 1.33M | $25,057 | $25,578 |
| EV | 62.12K | 30.41K | $35,734 | $33,335 |
| Hybrid | 57.46K | 27.70K | $28,718 | $27,171 |
| Other | 220 | 103 | $13,714 | $12,076 |
- EV adoption shows promise but remains niche, with comparatively high prices indicating premium perception.
- ICE vehicles dominate, demonstrating entrenched consumer preference and infrastructure reliance.
- Hybrids steadily gain ground, balancing performance and environmental concerns within moderate pricing tiers.
Market Share by Body Types
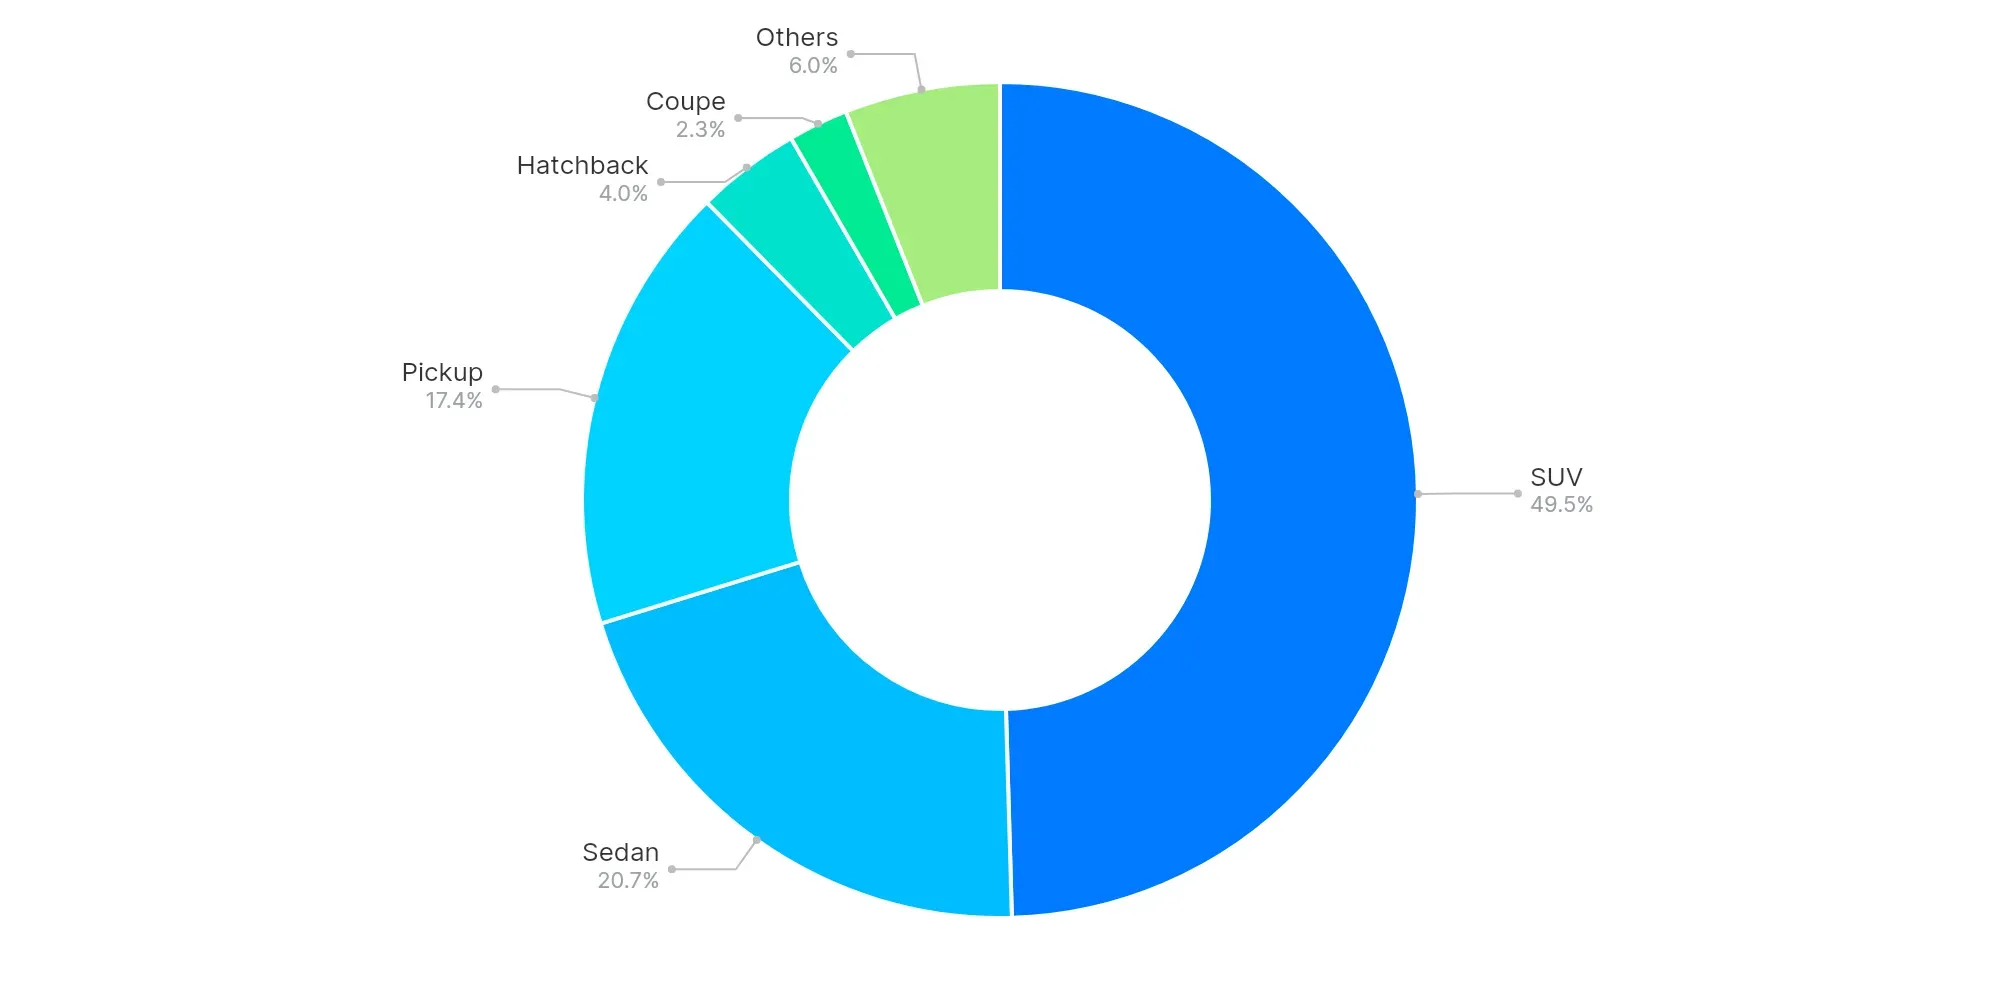
SUV (49.5%), Sedan (20.7%), and Pickup (17.4%) highlight consumer preferences, underscoring the dominance of larger SUV and Pickup segments. The data suggests growing consumer interest in versatile and practical vehicle types, with an ongoing trend towards larger vehicles amidst varied lifestyle needs.
High-Volume vs Low-Volume States (Executive Insights)
- Top-performing states: Texas, Florida, California
- Underpenetrated regions: Virgin Islands, American Samoa, Northern Mariana Islands
- Key price bands: $20K–$30K, $10K–$20K, $30K–$40K
- EV trend: Niche growth potential, requiring enhanced supporting infrastructure
- Buyer preferences: SUVs and Pickups, driven by lifestyle and utility needs
The US used car market continues to be characterized by stable pricing and regional sales variations, revealing specific opportunities for market expansion. For dealers and analysts, focusing on competitive pricing strategies and considering regional preferences is crucial for success in this dynamic environment.