

US Monthly Used Car Market Data – October 2024
This report provides an analytical overview of the US used vehicle market in October 2024, focusing on dealer activity, sales volume, pricing, fuel types, body types, and regional performance. Key insights are drawn to help understand market dynamics and aid strategic decision-making for various stakeholders within the automotive industry.
Number of Dealerships by State
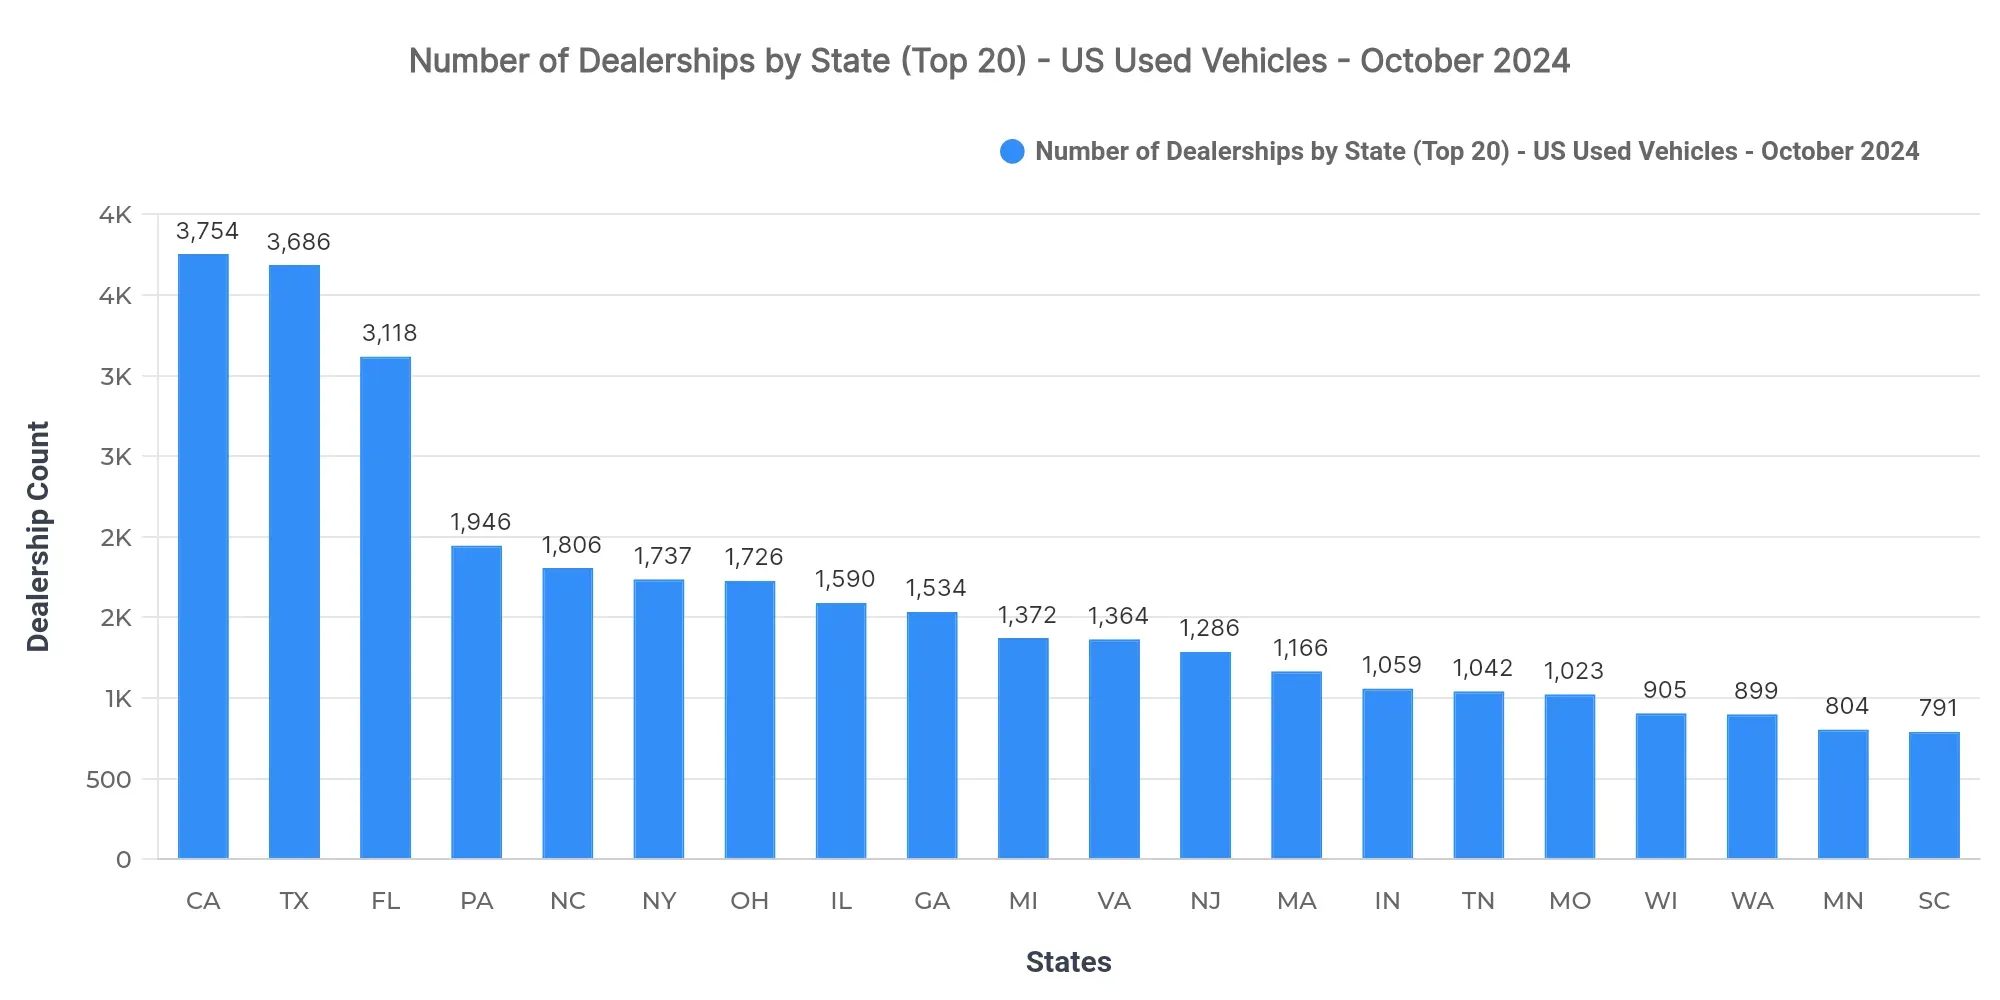
California (3,754), Texas (3,686), and Florida (3,118) lead in dealership counts. These states demonstrate significant market saturation, indicative of competitive automotive retail environments. Market concentration in these areas may encourage dealerships to innovate or diversify offerings to maintain competitiveness.
Top 10 States by Sold Volume
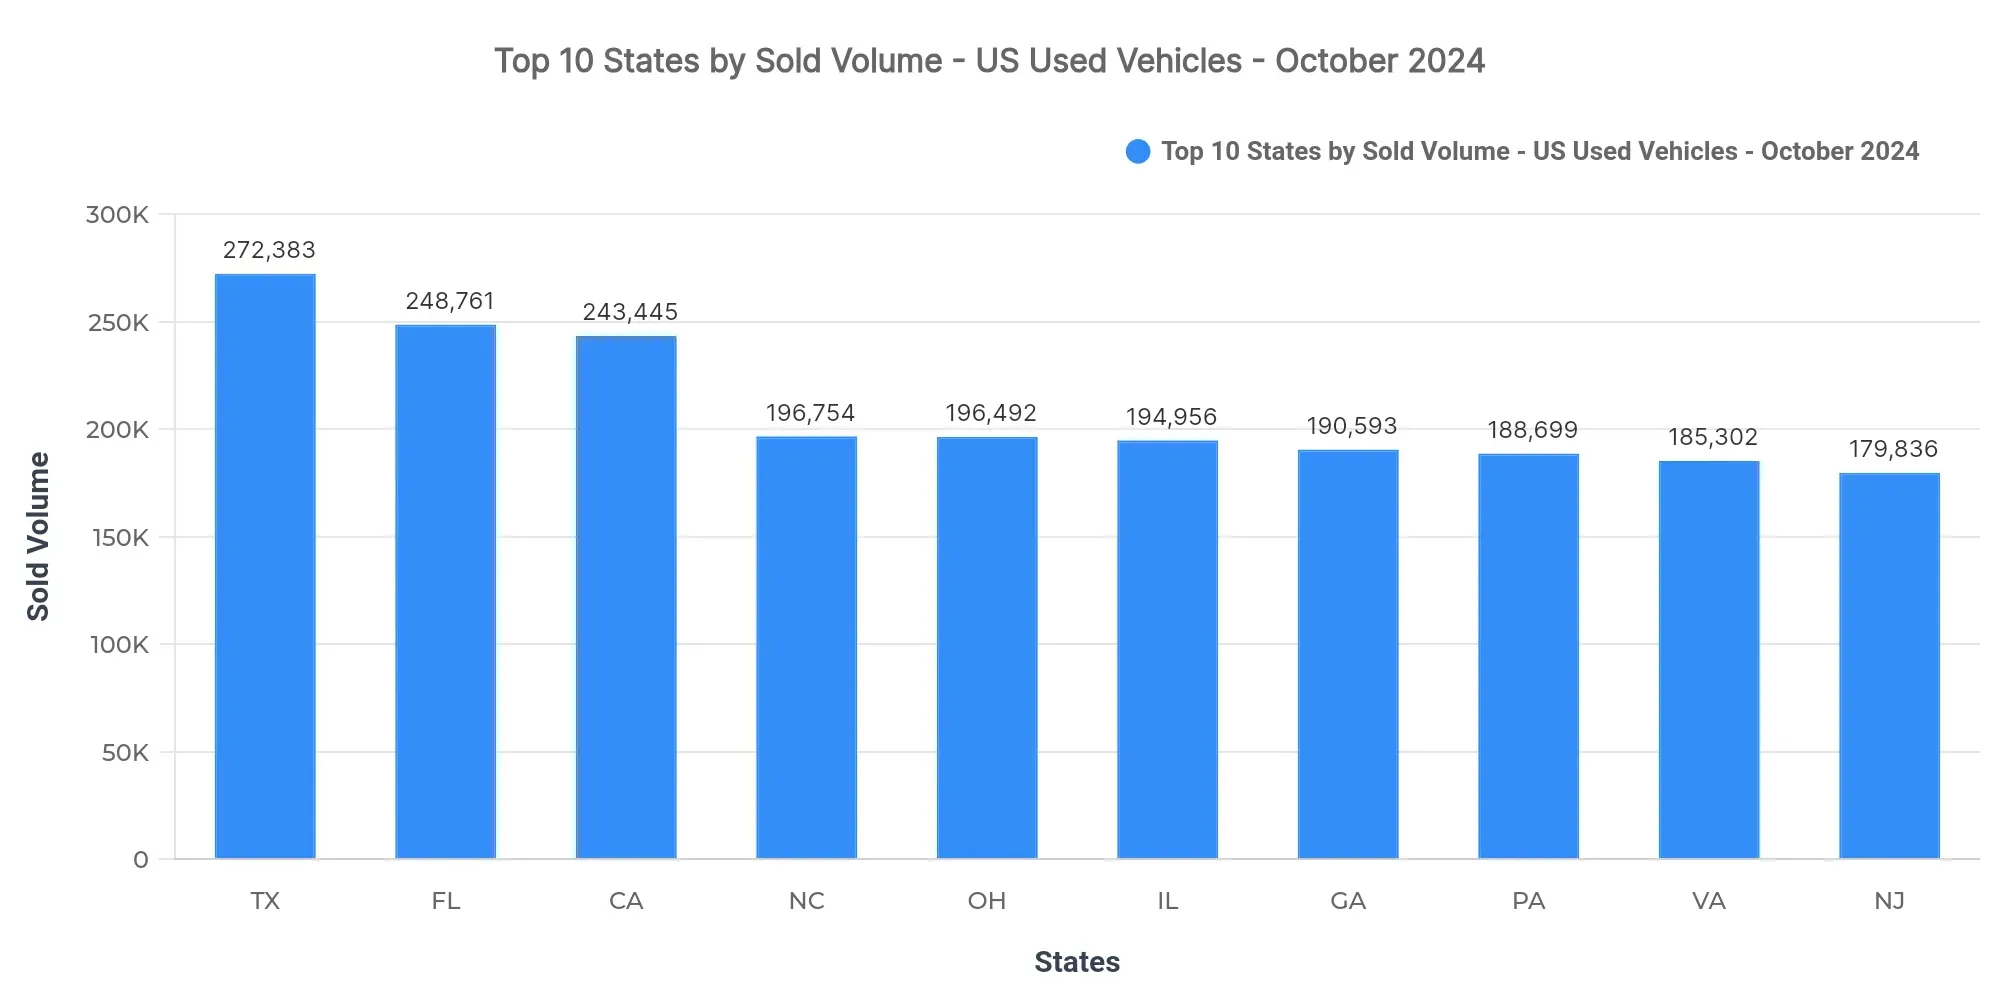
Texas (272,383), Florida (248,761), and California (243,445) lead in sold volume. Collectively, these top three states account for 11.1% of the national sold volume. The remaining top 10 states are North Carolina, Ohio, Illinois, Georgia, Pennsylvania, Virginia, and New Jersey.
The concentration of sales in the top states highlights a skewed distribution favoring populous and economically vibrant regions. Regional demand patterns show robust interest in these states, suggesting localized marketing strategies could be effective.
Price Breakdown: Top 10 States by Sold Volume
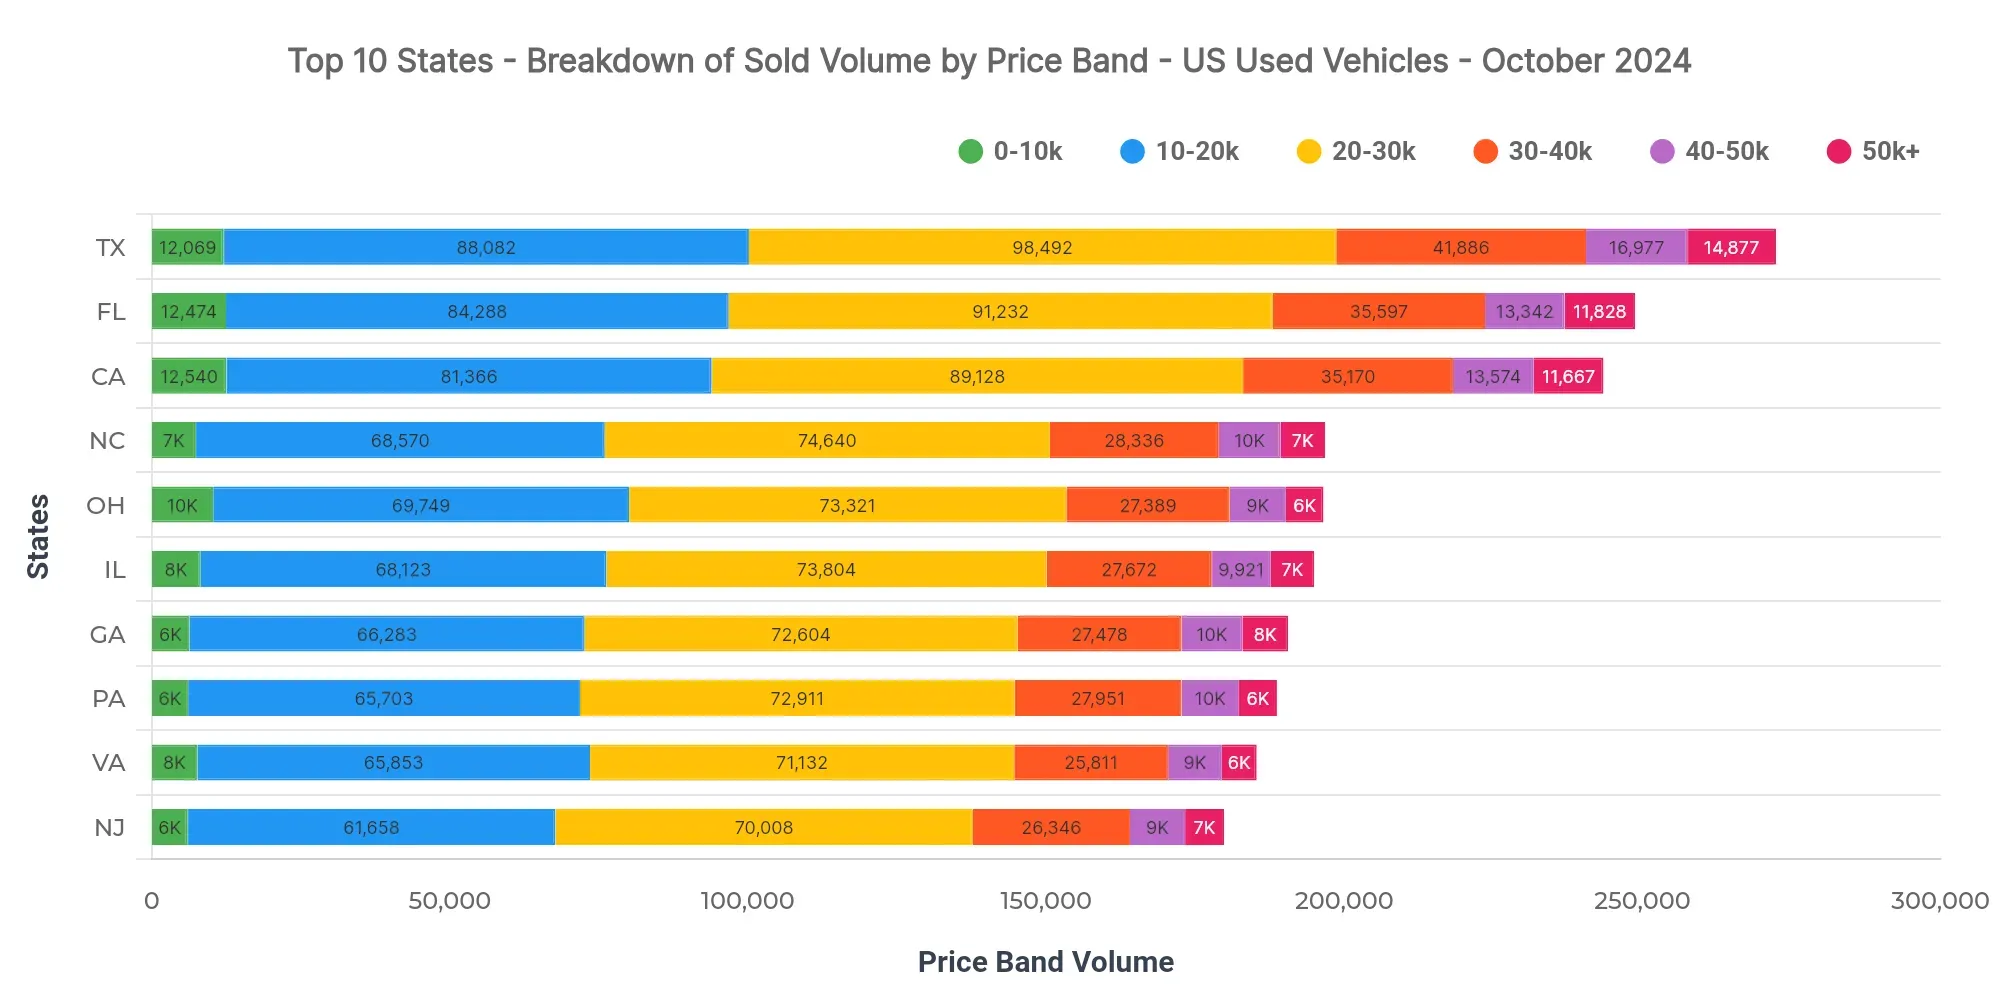
In Texas, the dominant price bands are $20K–$30K (36.2%), $10K–$20K (32.3%), and $30K–$40K (15.4%). Notably, the $40K–$50K band represents 6.2%. When compared, Florida's average sold price stands at $25,339 and California at $25,895.
Dealers could benefit by targeting the dominant price bands, especially in Texas. Pricing strategies and financing options should cater to these prevalent bands, while monitoring shifts in purchasing power.
Market Breakdown by Fuel Types
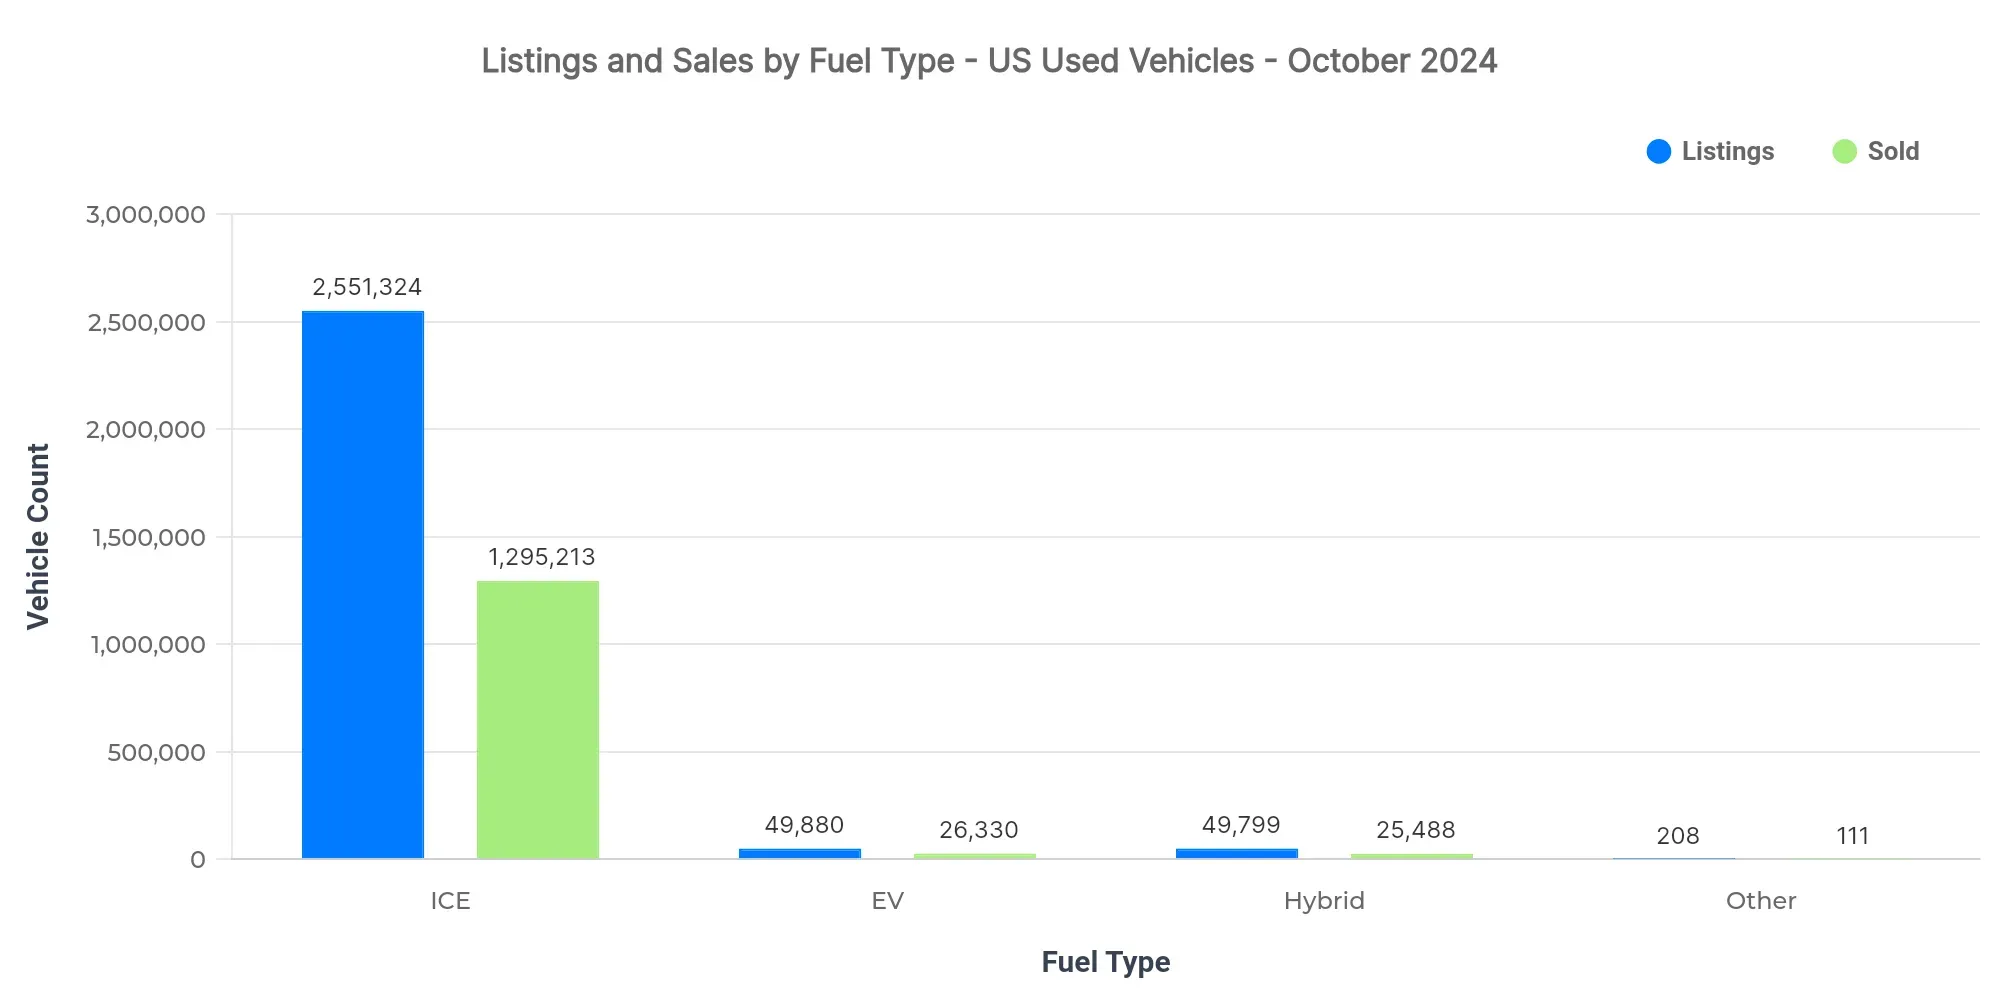
| Fuel Type | Listings Count | Sold Count | Avg Listing Price | Avg Sold Price |
|---|---|---|---|---|
| ICE | 2.55M | 1.30M | $25,263 | $25,199 |
| EV | 49.9K | 26.3K | $33,521 | $31,304 |
| Hybrid | 49.8K | 25.5K | $28,319 | $26,715 |
| Other | 208 | 111 | $14,750 | $14,673 |
Internal Combustion Engine (ICE) vehicles dominate both listings and sales. EVs, despite their lower volume, command premium pricing, indicative of their niche but growing market presence. Hybrid vehicles show competitive pricing compared to conventional ICE vehicles, potentially offering a bridge for consumers transitioning to alternative fuels.
- EV adoption is progressing, albeit slowly, with premium pricing reflecting perceived value and technology costs.
- Price positioning reveals a competitive landscape, especially within the lower price bands.
- Market dynamics suggest fuel efficiency and eco-friendliness could drive future purchasing behavior.
Market Share by Body Types
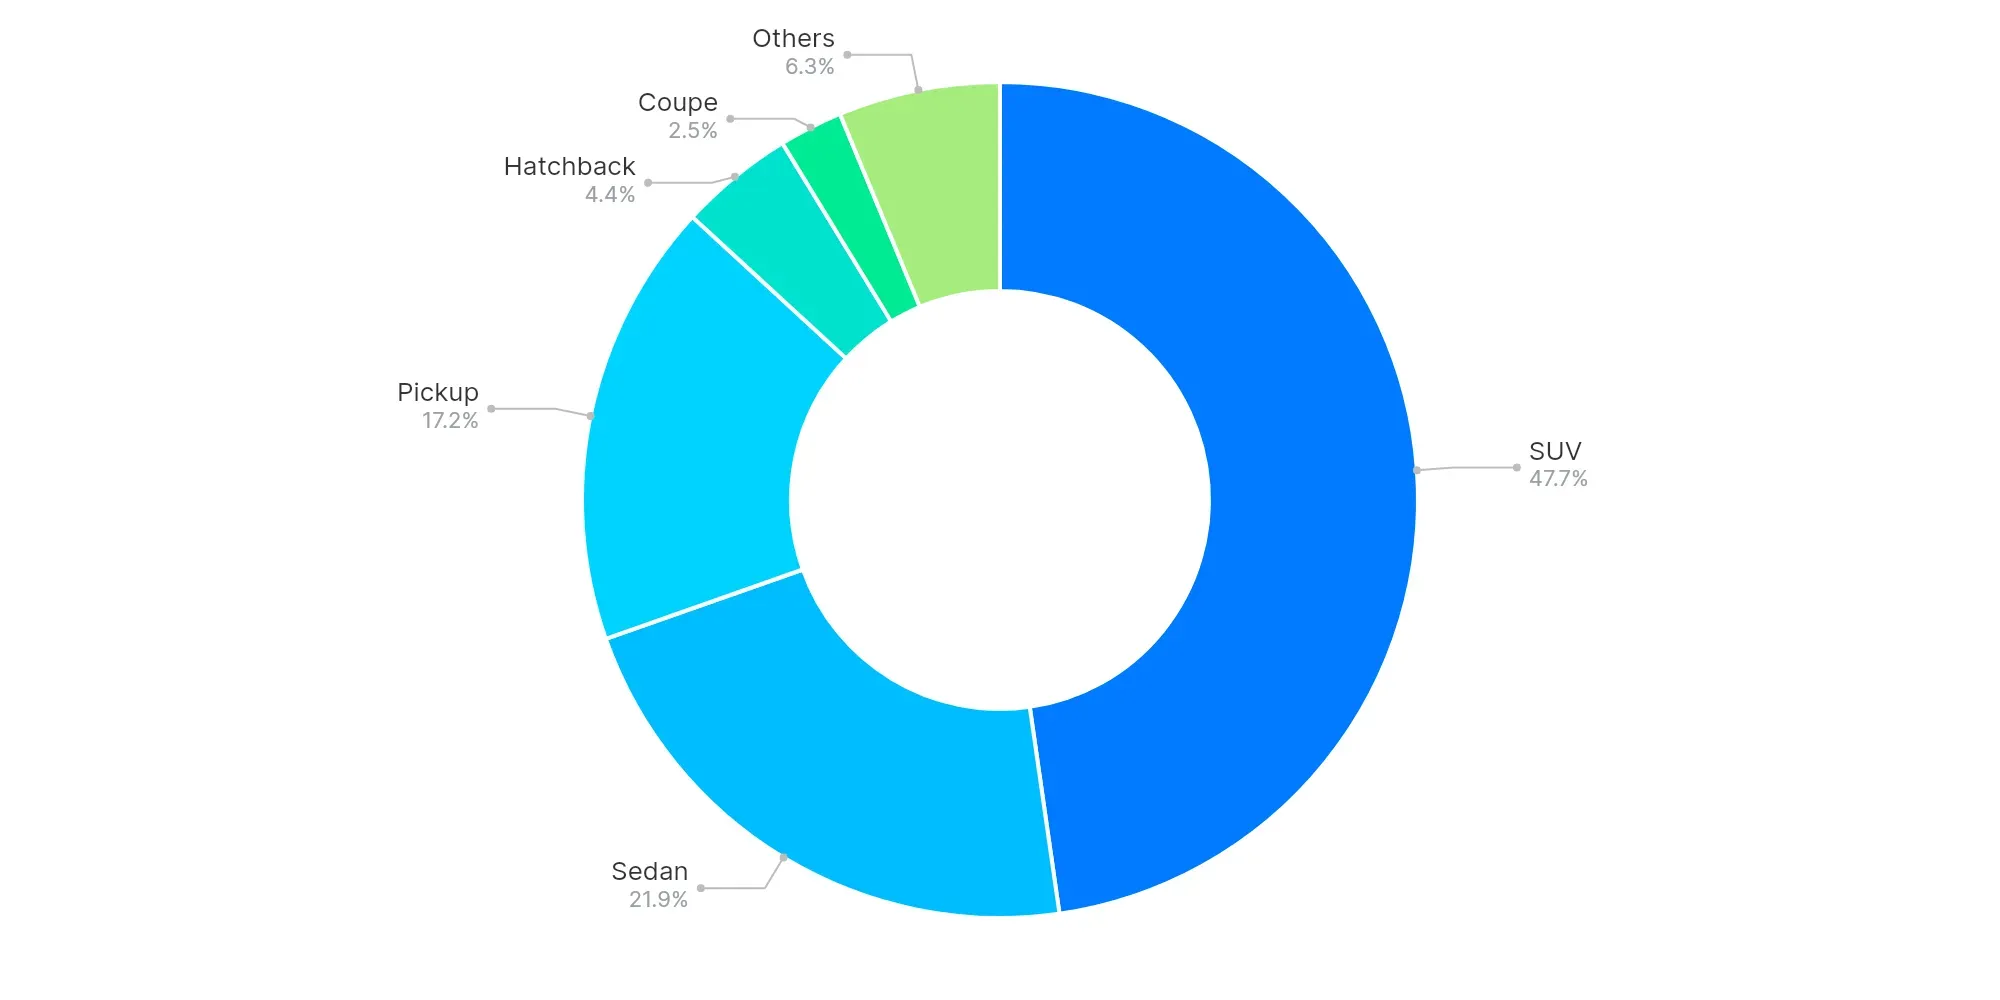
SUVs (47.7%), Sedans (21.9%), and Pickups (17.2%) dominate market shares. The prominence of larger vehicle segments like SUVs and Pickups underscores a consumer preference for spaciousness and utility. The continued dominance of SUVs suggests a trend toward versatile, family-oriented vehicles.
High-Volume vs Low-Volume States (Executive Insights)
- Top-performing states: Texas, Florida, and California.
- Underpenetrated regions: Virgin Islands, American Samoa, and Northern Mariana Islands.
- Key price bands: $20K–$30K, $10K–$20K, and $30K–$40K.
- EV trend: Increasing adoption with premium pricing.
- Buyer preferences: Lean toward larger body types and ICE engines.
The US used vehicle market continues to show strong demand in high-volume states, with a notable preference for SUVs and ICE vehicles. Dealers should focus on dominant price bands and growing trends in EV adoption to capitalize on emerging segments.