

US Monthly Used Car Market Data – October 2023
The October 2023 report delves into the US used vehicle market, evaluating dealer activity, sales volume, pricing, and significant trends across fuel and body types. Additionally, it examines regional performance to perceive shifts and demand in different states.
Number of Dealerships by State
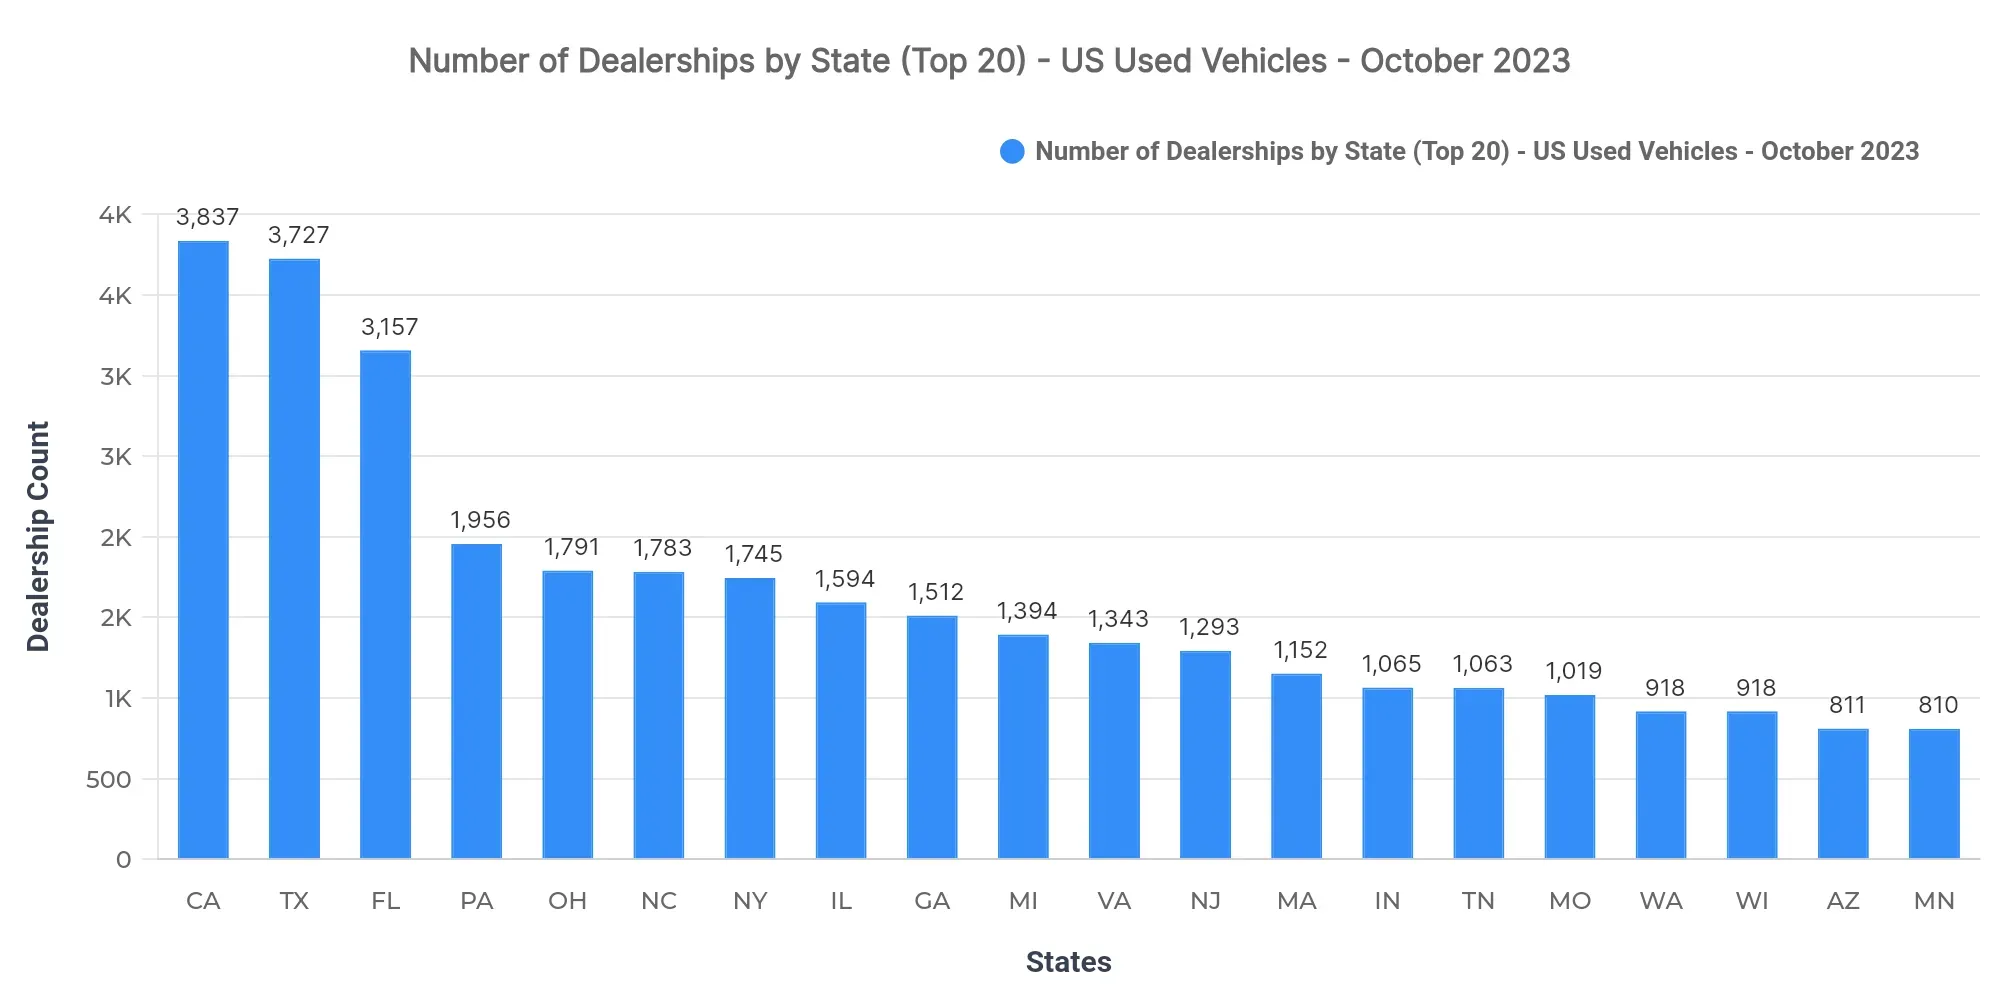
California (3,837), Texas (3,727), and Florida (3,157) lead in dealership counts. This suggests a high market concentration in these regions, indicating an effective network of sales channels. However, this could mean high competition levels prompting dealers to differentiate through offerings and services.
Top 10 States by Sold Volume
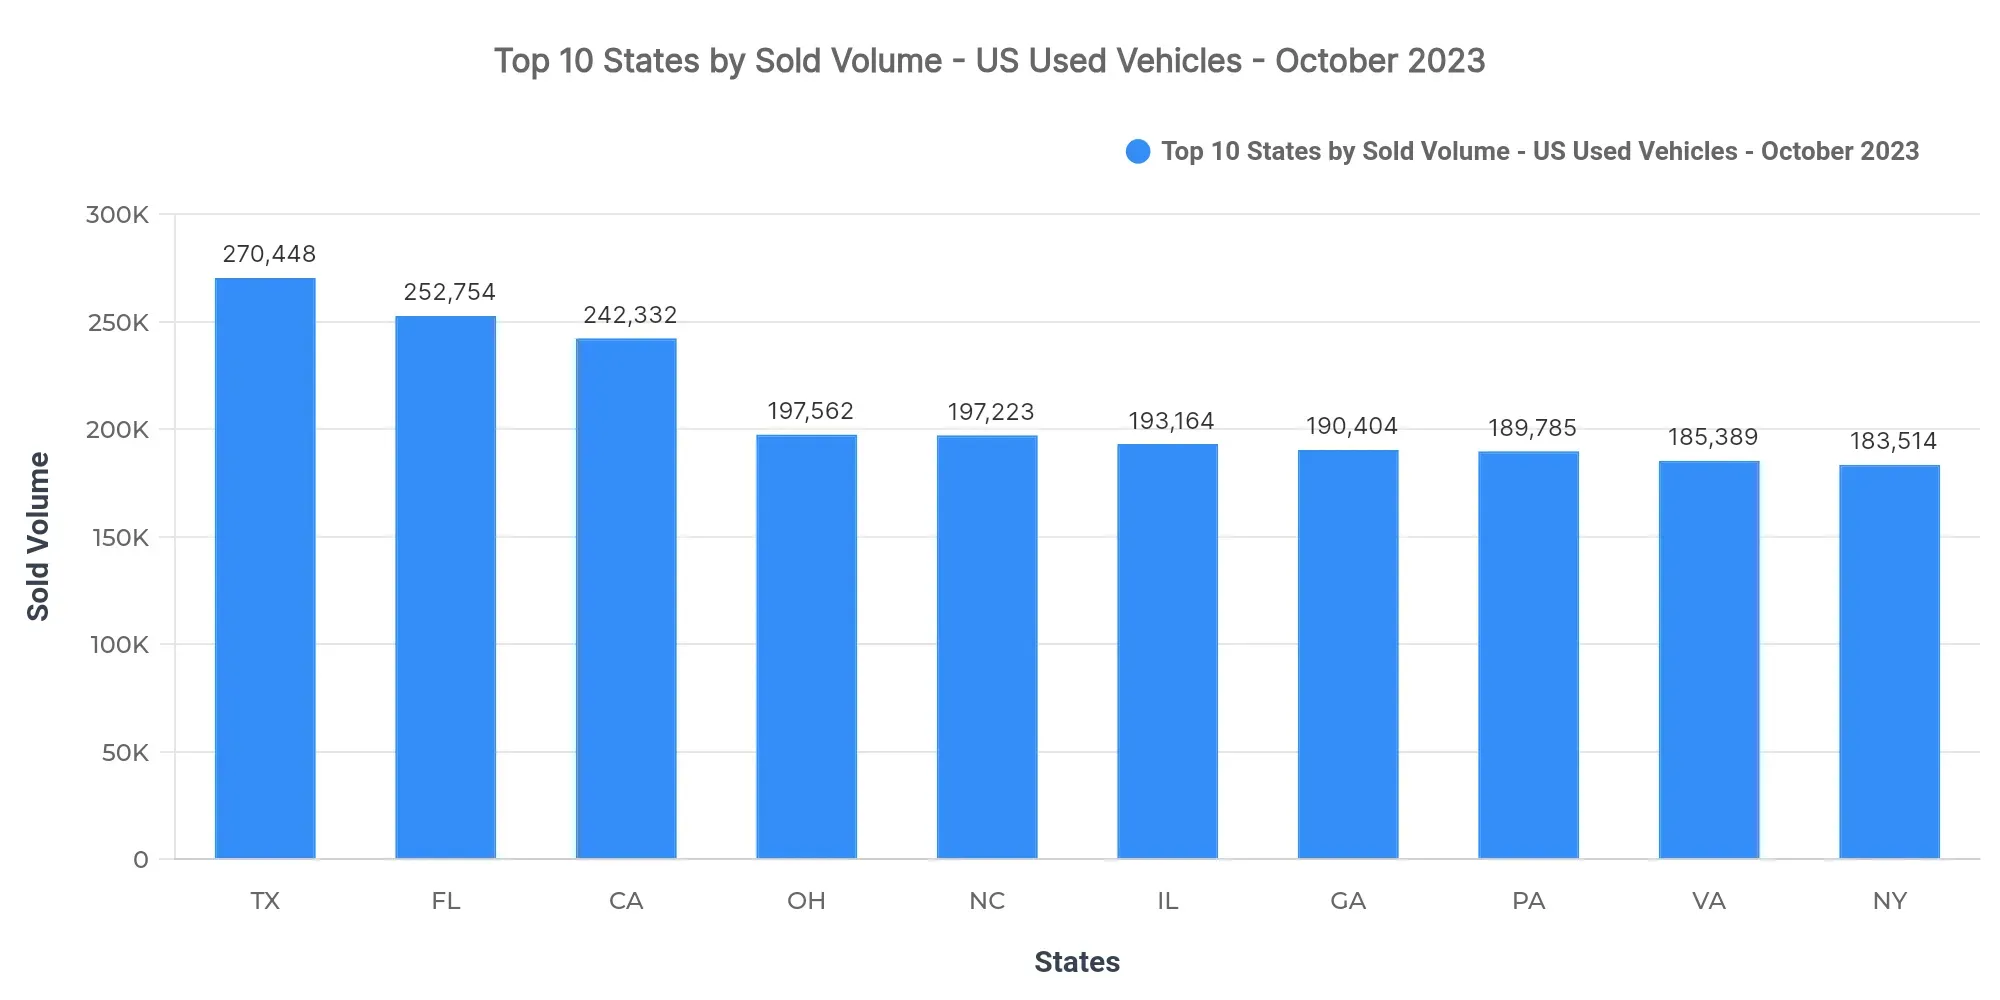
Texas (270,448), Florida (252,754), and California (242,332) are at the forefront, collectively holding a 10.9% share of the national sold volume. The seven other states completing the top ten are Ohio, North Carolina, Illinois, Georgia, Pennsylvania, Virginia, and New York. This aggregate dominance underscores a concentrated market with intense competition among market leaders.
Market concentration suggests that the higher performance in top states could be attributed to established dealer networks and consumer trust. Meanwhile, the data reflects robust regional demand patterns, majorly shaped by increasing population density and urban expansion in leading states.
Price Breakdown: Top 10 States by Sold Volume
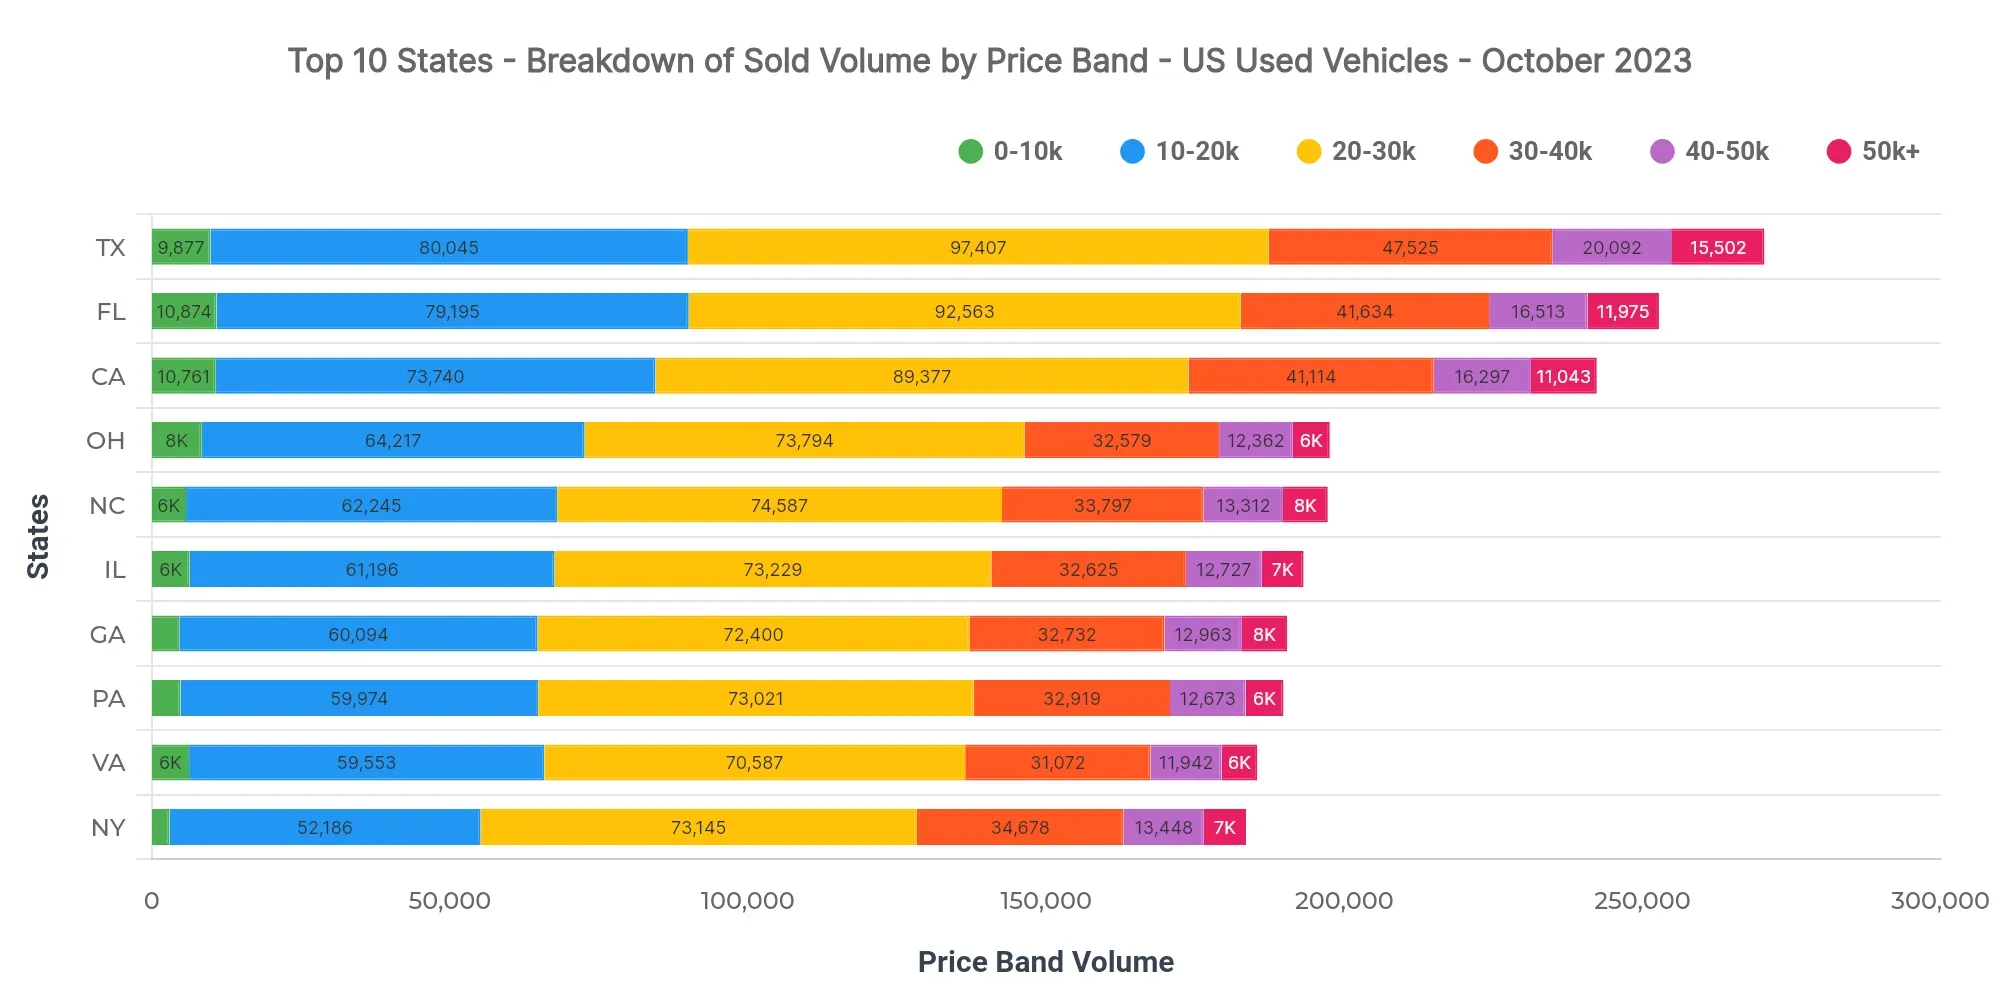
Focusing on Texas, the dominant price bands are $20K–$30K (36%), $10K–$20K (29.6%), and $30K–$40K (17.6%). Additionally, the $40K–$50K (7.4%) band highlights a smaller portion of the market by value. In contrast, California averages a selling price of $27,127 while Florida stands at $26,770.
Dealers should note the predominant mid-range price bands in Texas when stocking inventory. For financial institutions, the diverse price range promotes varied lending opportunities, especially in the competitive $20K–$30K sector.
Market Breakdown by Fuel Types
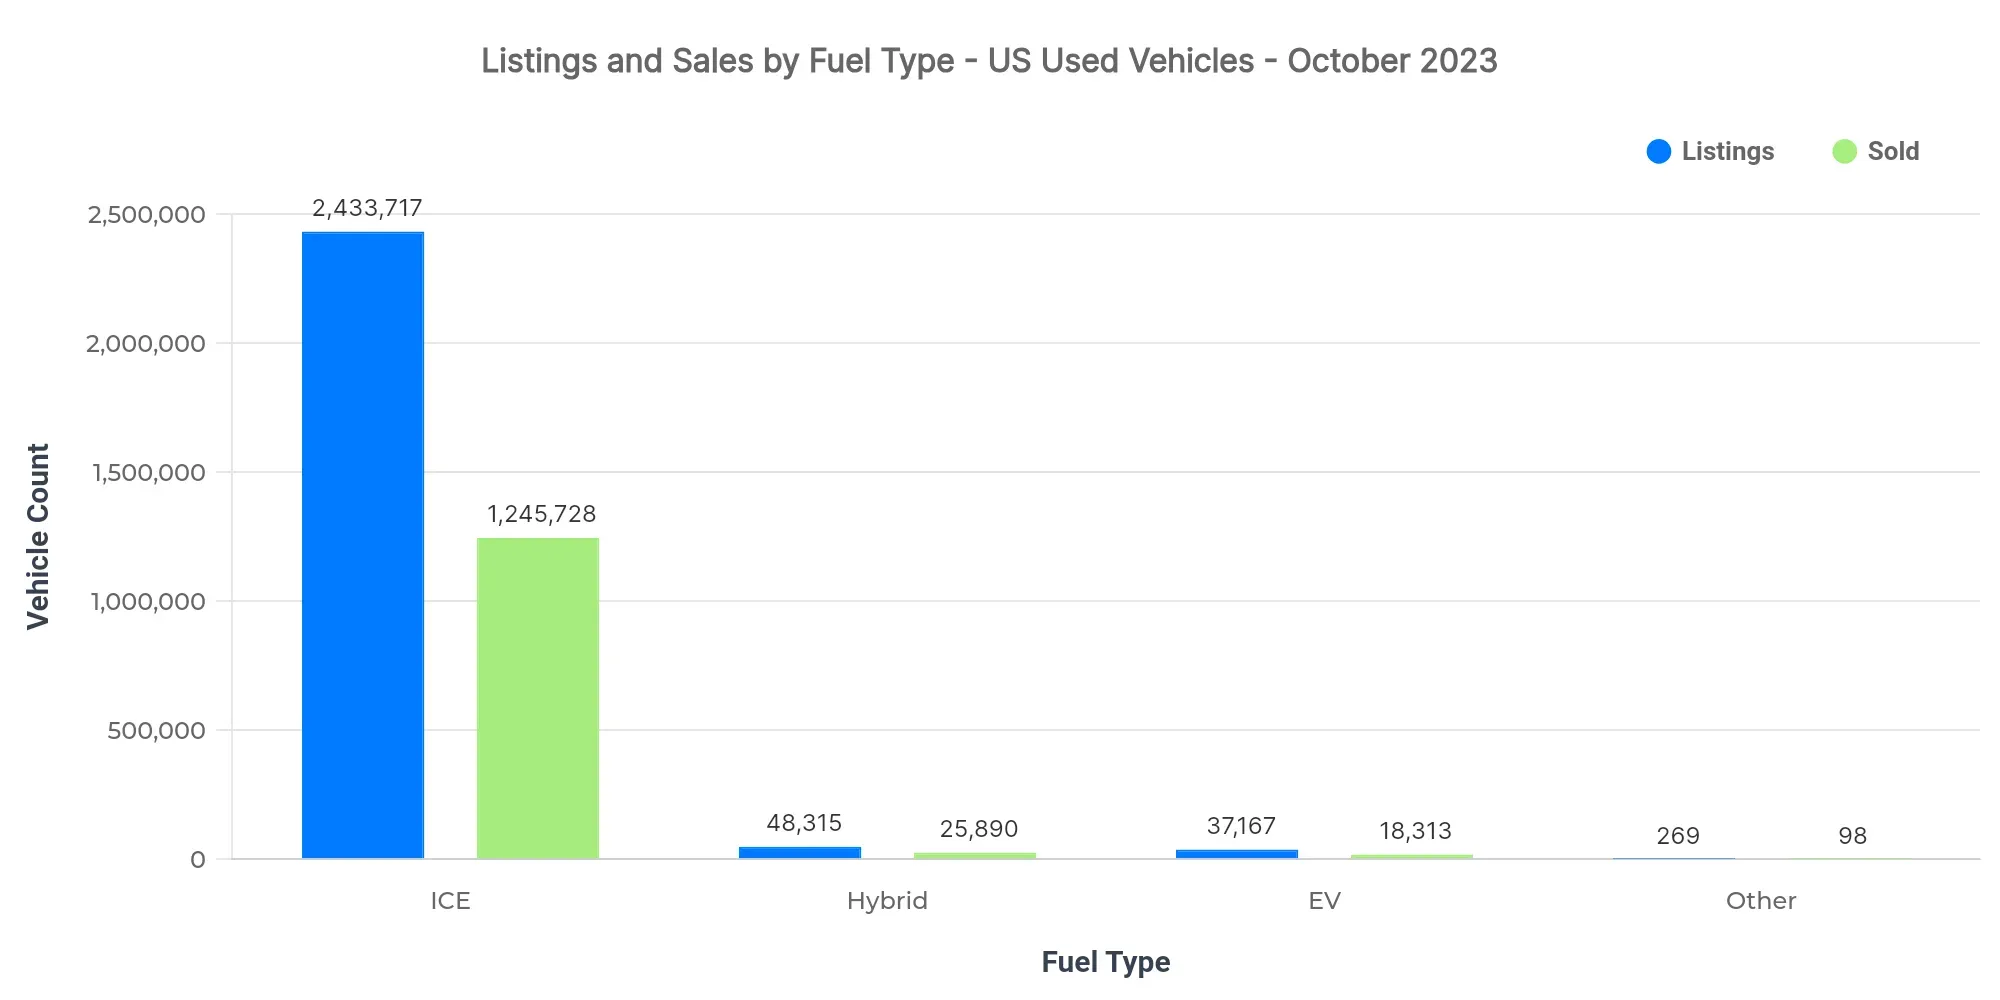
The market primarily consists of ICE vehicles, with EVs and Hybrids showing growth potential. ICE vehicles dominate sales volume, but EVs have the highest pricing with average sold prices surpassing $39,000. Hybrids maintain a premium over ICE models, but EV's higher listing and sold prices reflect its positioning as a luxury marker.
| Fuel Type | Listings Count | Sold Count | Avg Listing Price | Avg Sold Price |
|---|---|---|---|---|
| ICE | 2.43M | 1.25M | $25,949 | $26,186 |
| Hybrid | 48K | 25.89K | $28,268 | $27,270 |
| EV | 37K | 18.31K | $42,462 | $39,490 |
| Other | 269 | 98 | $18,055 | $18,852 |
- EV adoption continues amid premium positioning.
- Price variations by fuel type indicate specific buyer demographics.
- ICE vehicles remain the default choice, affecting market dynamics.
Market Share by Body Types
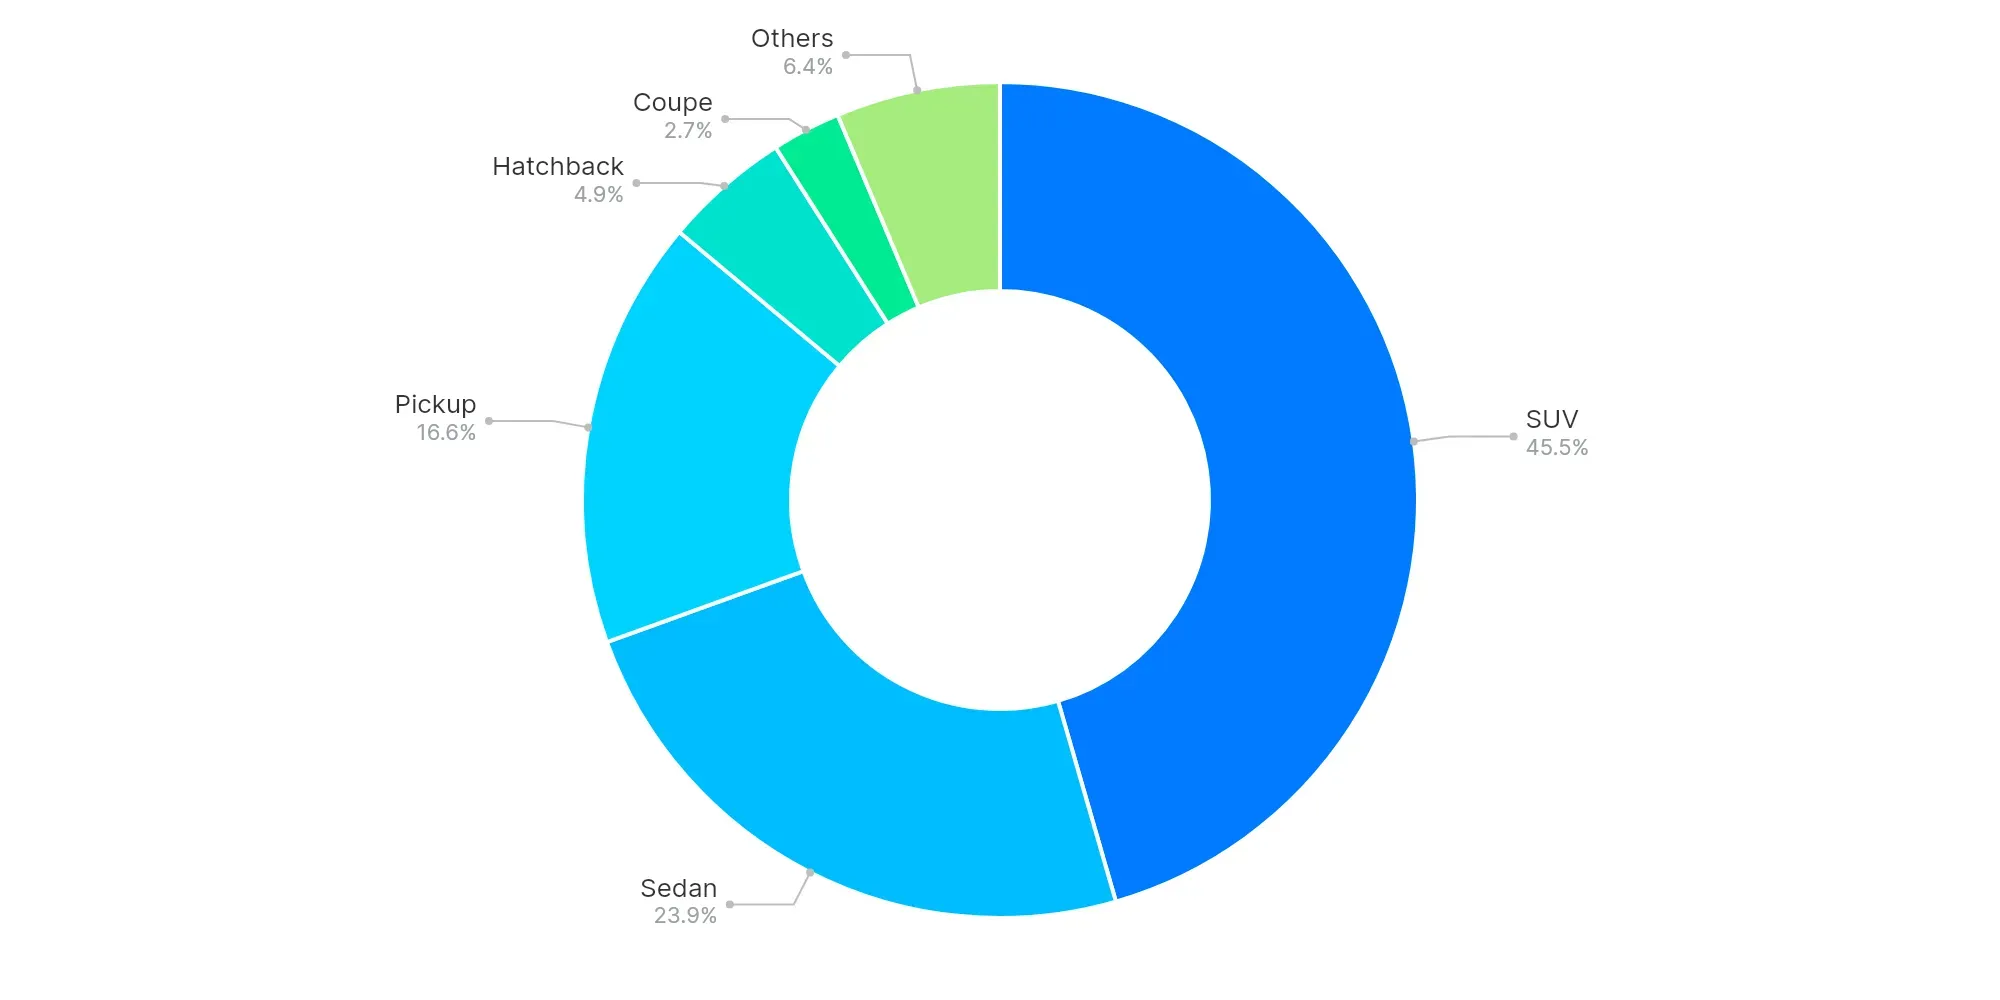
SUV (45.5%), Sedan (23.9%), and Pickup (16.6%) remain leading body types. The dominance of SUVs and Pickups indicates a strong consumer preference for larger vehicles, aligning with practical usage trends and lifestyle changes.
The inherent popularity of SUVs suggests stability in the larger-vehicle segments as consumer preferences gravitate towards versatility and space.
High-Volume vs Low-Volume States (Executive Insights)
- Texas, Florida, and California are top performers.
- Underpenetrated regions include VI, AS, and MP.
- Key price bands: $20K–$30K, $10K–$20K, $30K–$40K.
- EV trend retains luxury pricing and appeals to niche markets.
- Buyer preferences exhibit increasing interest in SUVs and Pickup body types.
The US used car market in October 2023 highlights regional dynamics and emerging fuel trends. Dealers should consider regional saturation while investing in popular EV segments. Analysts must remain vigilant about pricing bands that drive volume and focus on strategic inventory that appeals to consumer preferences for body types like SUVs and Pickups.