

US Monthly Used Car Market Data – November 2025
This report provides an in-depth analysis of the US used vehicle market, focusing on dealer activity, sales volume, pricing trends, variations across fuel and body types, and regional performance. It offers actionable insights to help stakeholders navigate the market dynamics effectively.
Number of Dealerships by State
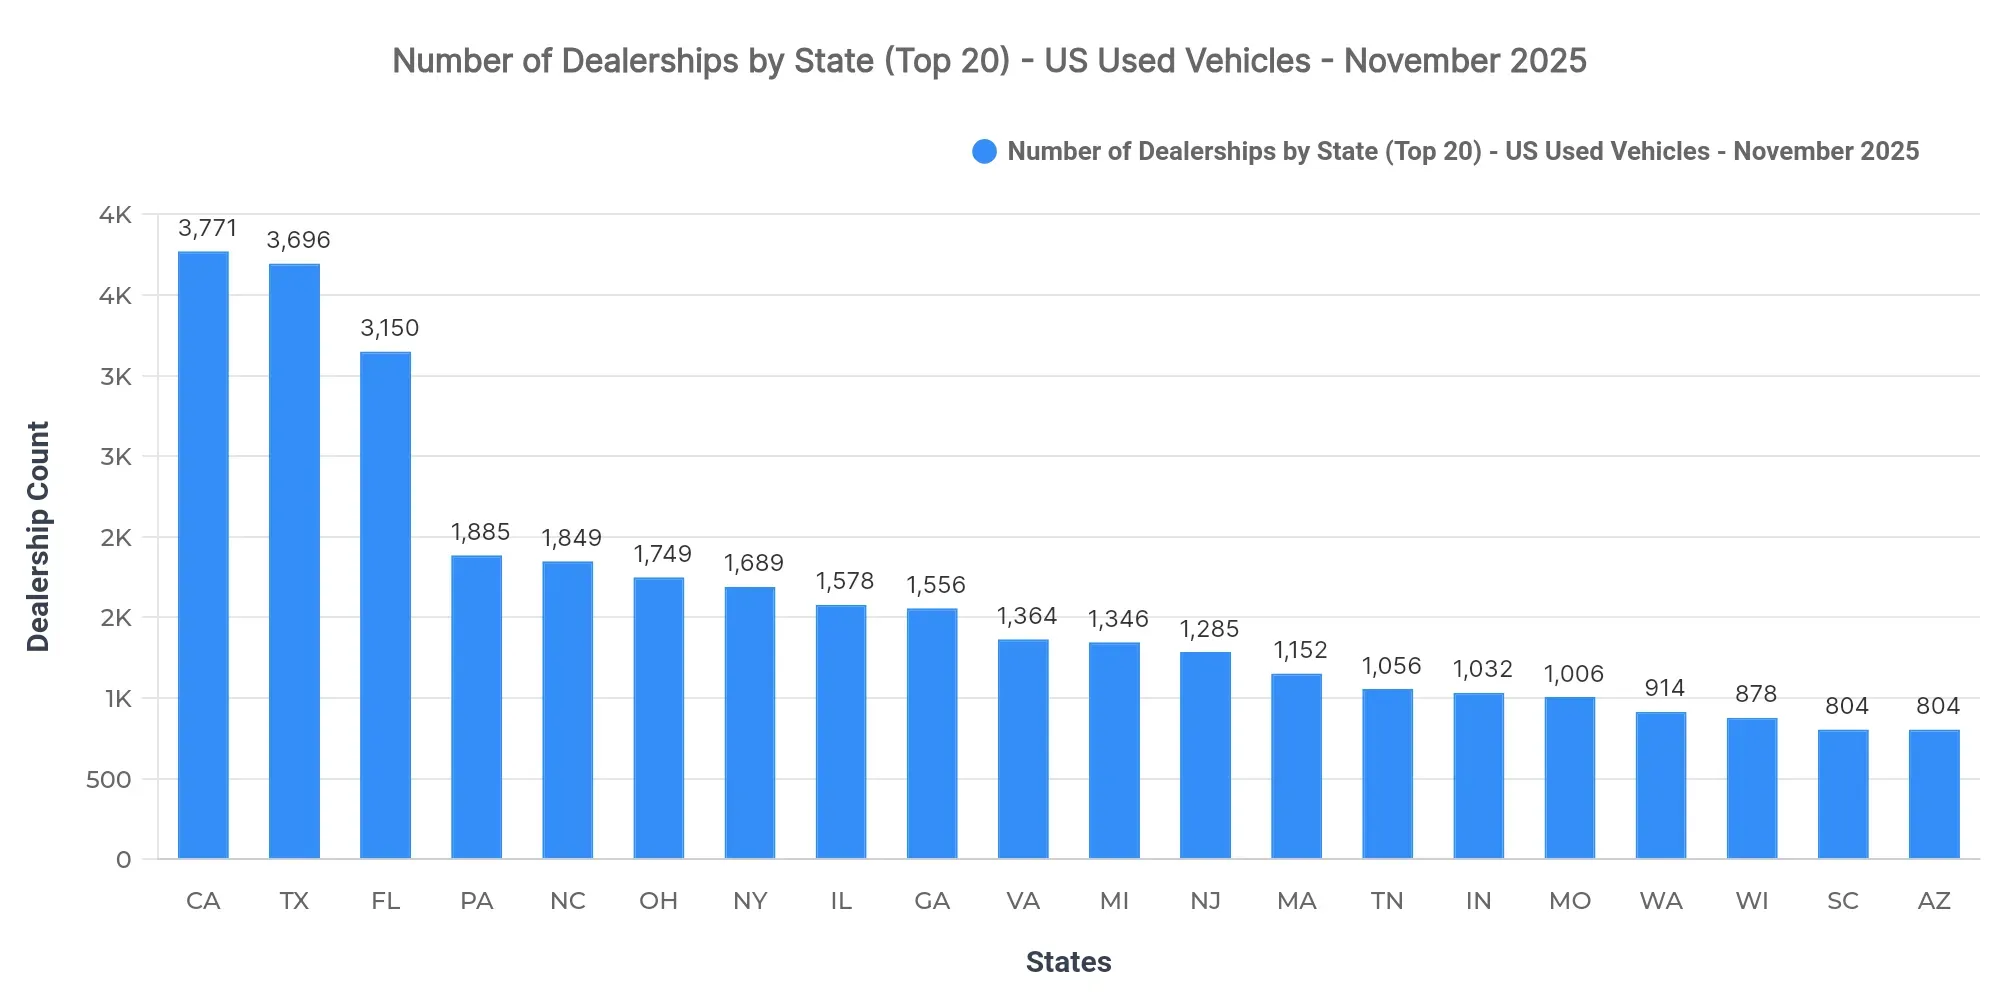
California (3,771), Texas (3,696), and Florida (3,150) lead in dealership counts. This concentration suggests a robust infrastructure supporting substantial vehicle trade in these states. At the same time, regions with fewer dealerships may face market penetration challenges.
Top 10 States by Sold Volume
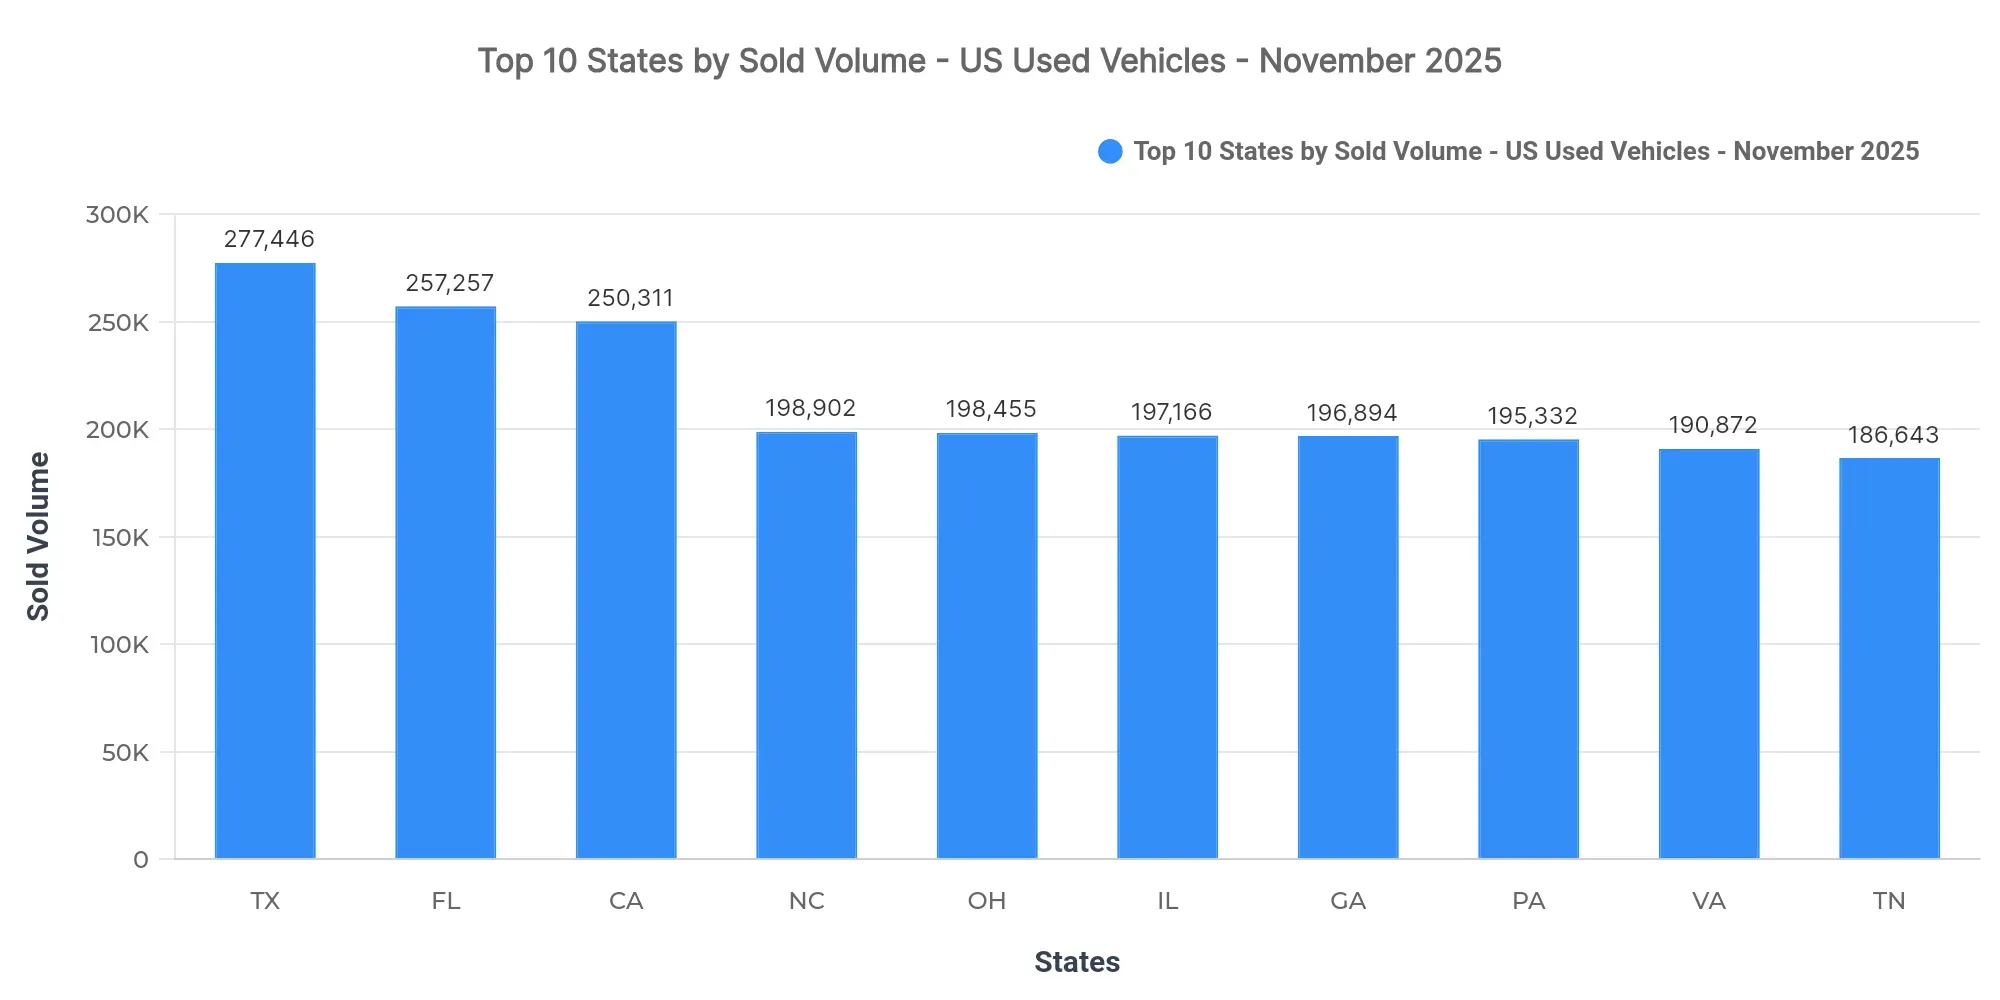
Texas (277,446), Florida (257,257), and California (250,311) lead. Their combined share of the national sold volume is 11.2%. The remaining top 10 states are North Carolina, Ohio, Illinois, Georgia, Pennsylvania, Virginia, and Tennessee.
The dominance of these top states indicates a significant concentration of used car activity. Regional patterns show strong demand in southeastern and midwestern states, reflecting economic and demographic factors influencing vehicle preferences.
Price Breakdown: Top 10 States by Sold Volume
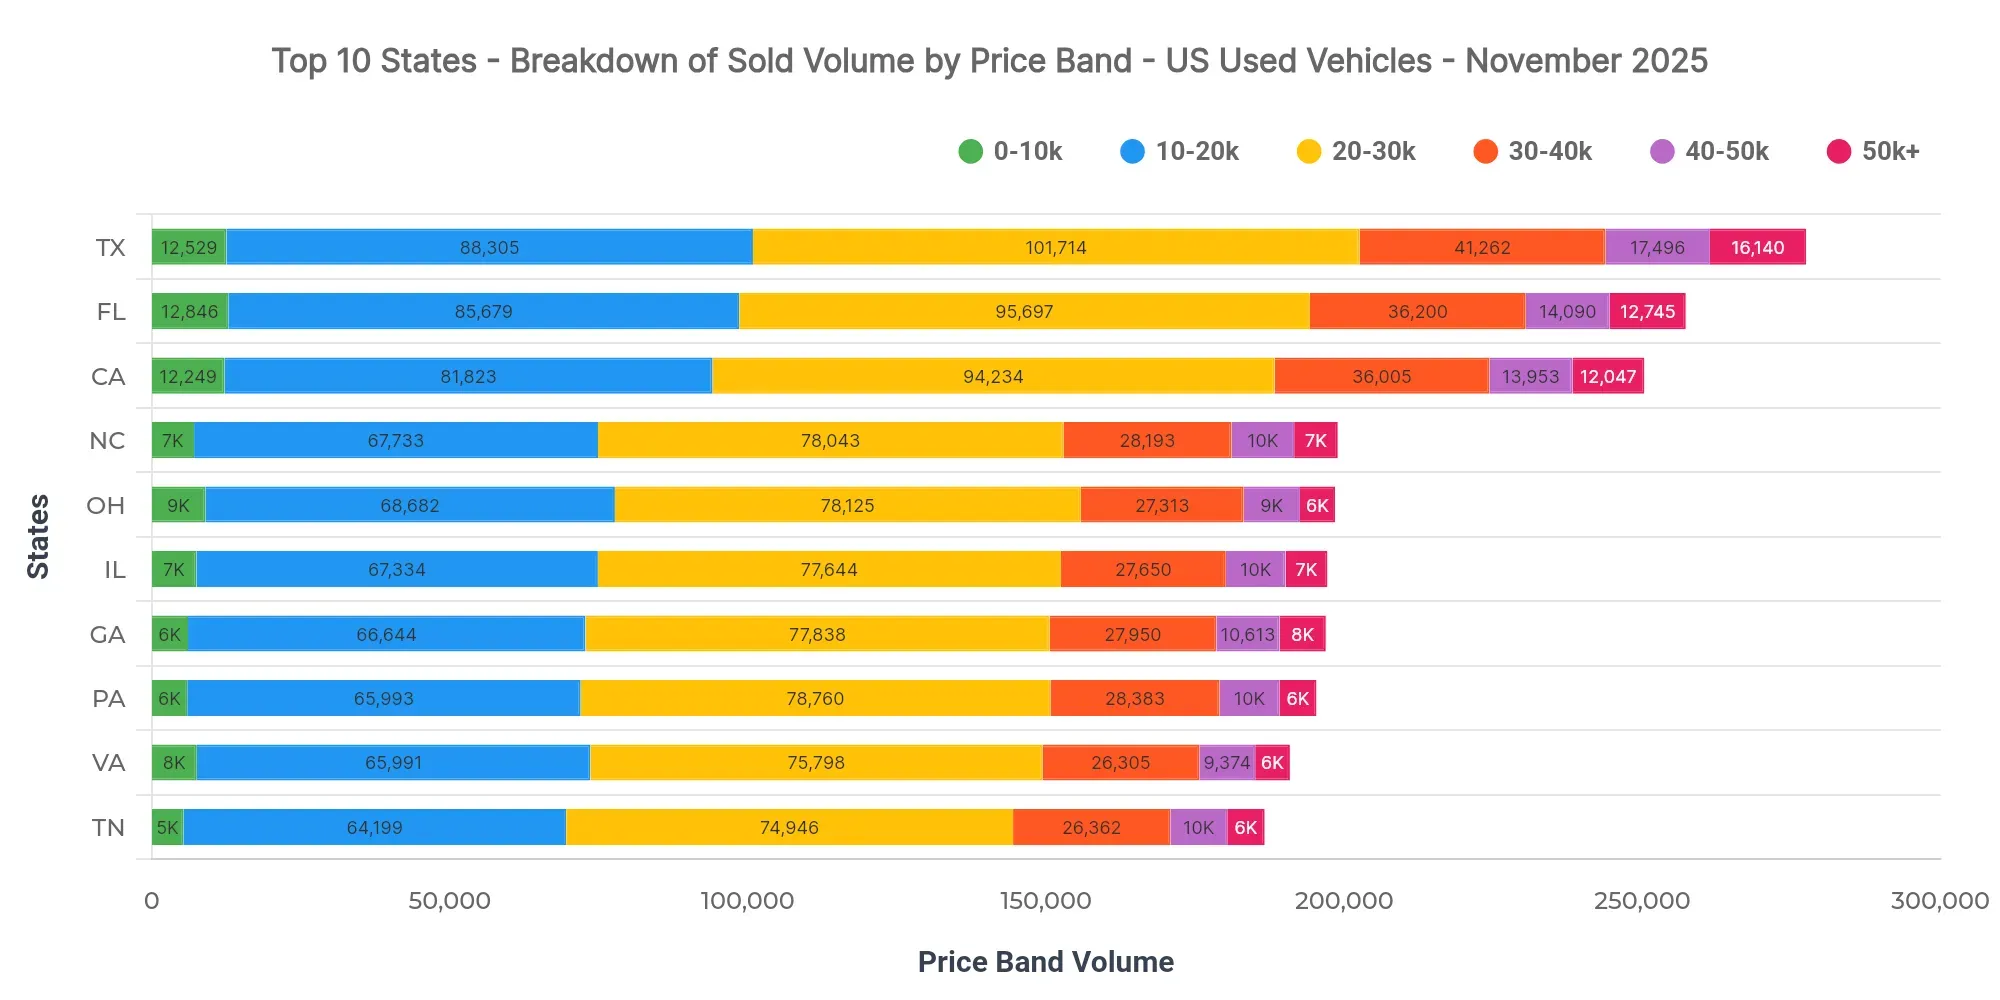
In Texas, the dominant price bands are $20K–$30K (36.7%) and $10K–$20K (31.8%), with the $30K–$40K band at 14.9%. The $40K–$50K band represents 6.3%, indicating a broader range capturing consumer interest. Ohio is at $25,260 and Georgia at $25,397 in average sold prices.
Dealers in Texas might focus on inventory within $10K–$30K to cater to high demand. Lenders should align financing options with prevalent price bands, particularly in competitive markets like Texas, Florida, and California.
Market Breakdown by Fuel Types
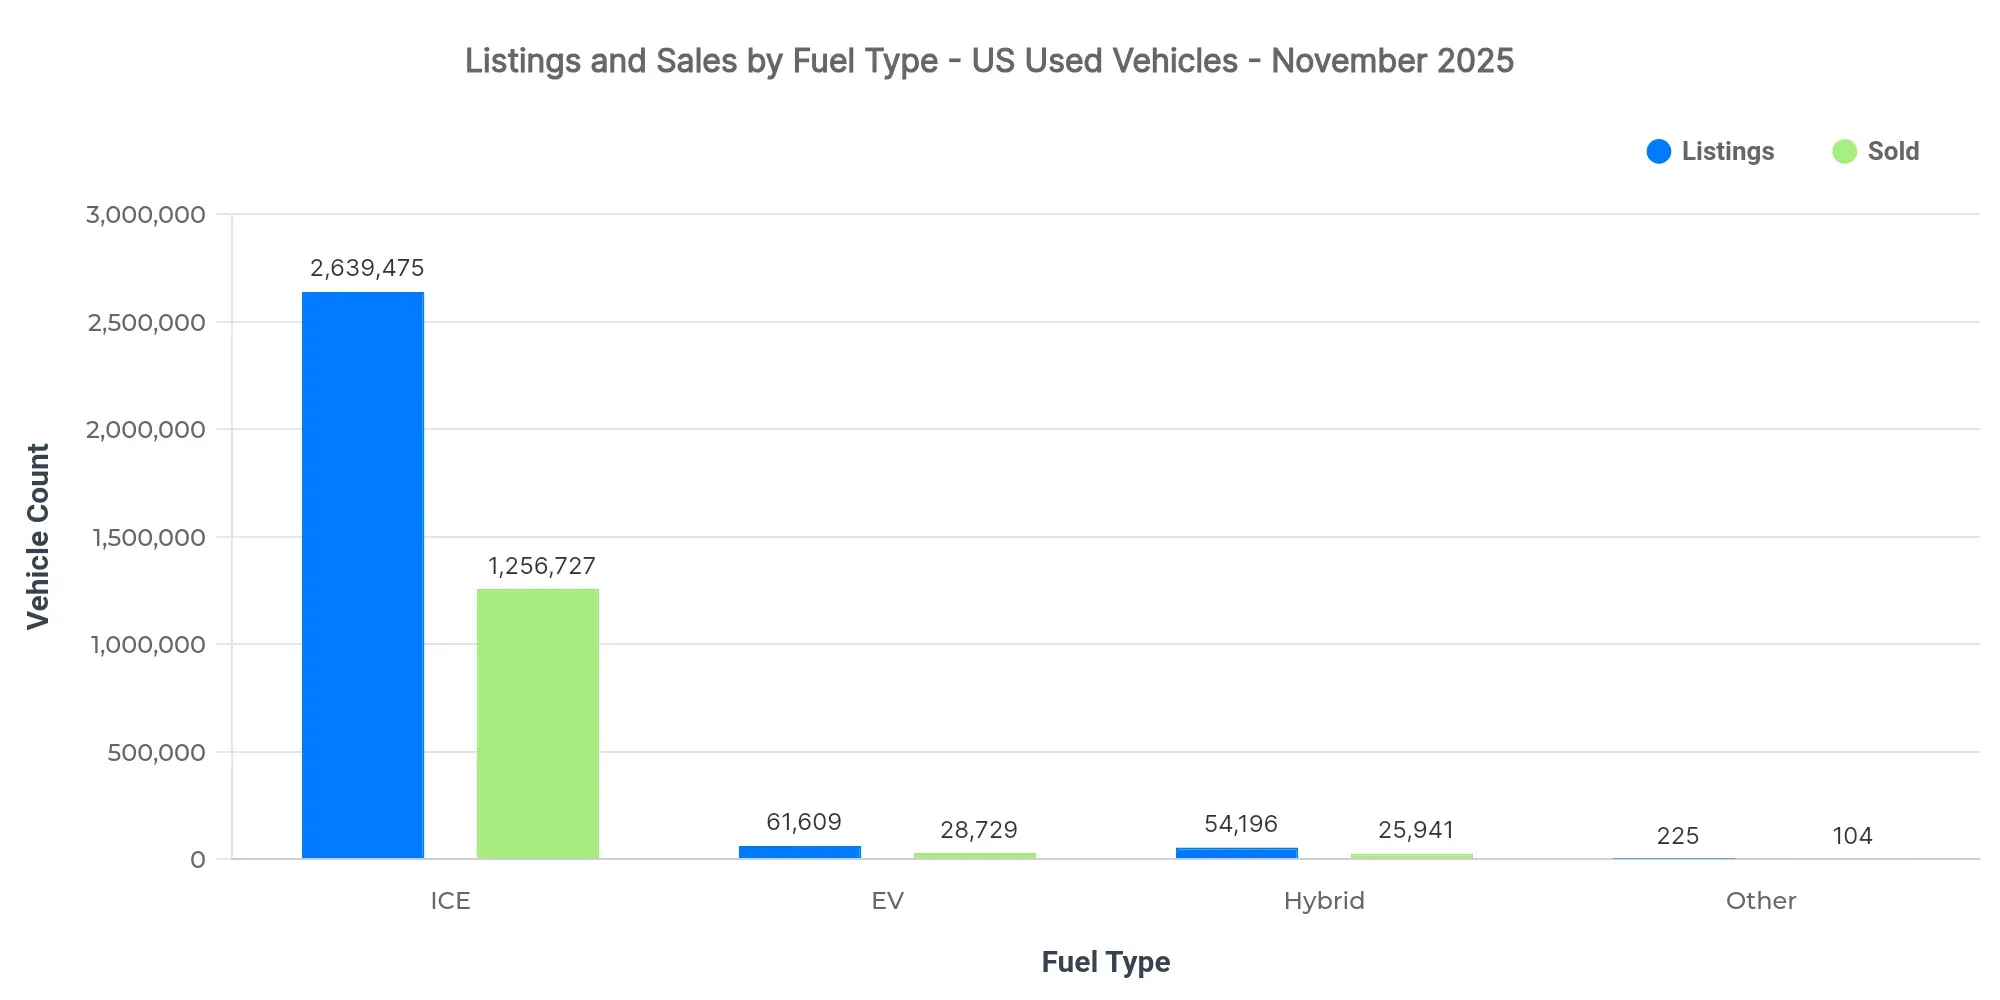
| Fuel Type | Listings Count | Sold Count | Avg Listing Price | Avg Sold Price |
|---|---|---|---|---|
| ICE | 2.64M | 1.26M | $23,781 | $25,258 |
| EV | 61.6K | 28.7K | $32,107 | $31,799 |
| Hybrid | 54.2K | 25.9K | $28,334 | $26,952 |
| Other | 225 | 104 | $11,063 | $12,779 |
- EV adoption remains steady, albeit with niche market appeal.
- ICE vehicles dominate, highlighting their significance in the market.
- Pricing strategies should consider the premium listing and selling prices of EVs and Hybrids.
Market Share by Body Types
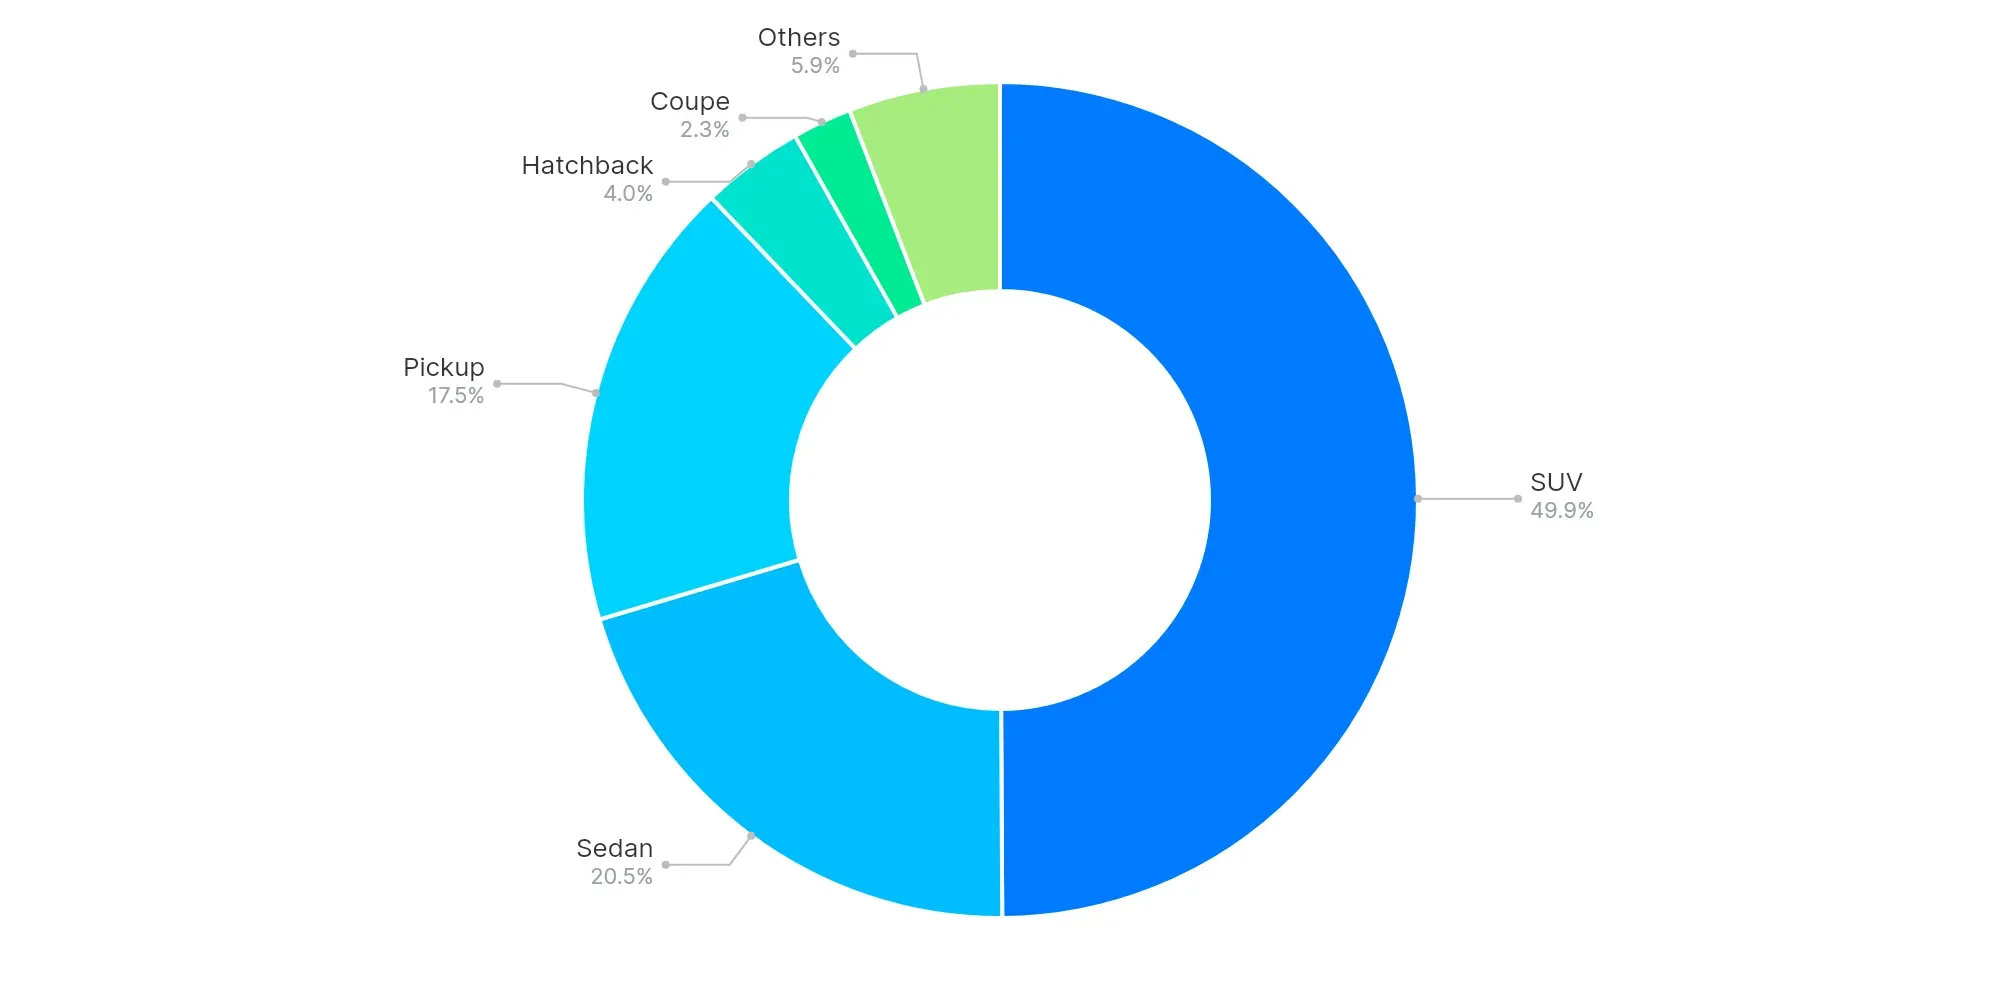
SUVs (49.9%), Sedans (20.5%), and Pickups (17.5%) dominate the market. SUVs and Pickups' stronghold highlights consumer preferences for larger vehicles, influenced by lifestyle and utility considerations. This trend suggests a shift toward spacious and versatile vehicle options.
High-Volume vs Low-Volume States (Executive Insights)
- Top-performing states: Texas, Florida, and California.
- Underpenetrated regions: American Samoa, Northern Mariana Islands, and Guam.
- Key price bands: $20K–$30K and $10K–$20K.
- EV trend: Growing niche, premium pricing but limited volume.
- Buyer preferences: Larger vehicles, especially SUVs and Pickups.
The US used car market in November 2025 shows concentrated activity in certain states, with specific price bands dominating sales. Dealers should focus on key price ranges and vehicle types to maximize sales, while analysts monitor regional variations and fuel type trends for strategic planning.