

US Monthly Used Car Market Data – November 2024
This report provides an analysis of the US used vehicle market in November 2024, detailing dealer activity, sales volume, pricing dynamics, fuel types, body types, and regional performances across the nation. Insight is drawn using the latest dataset to offer a comprehensive overview of current market trends and behaviors.
Number of Dealerships by State
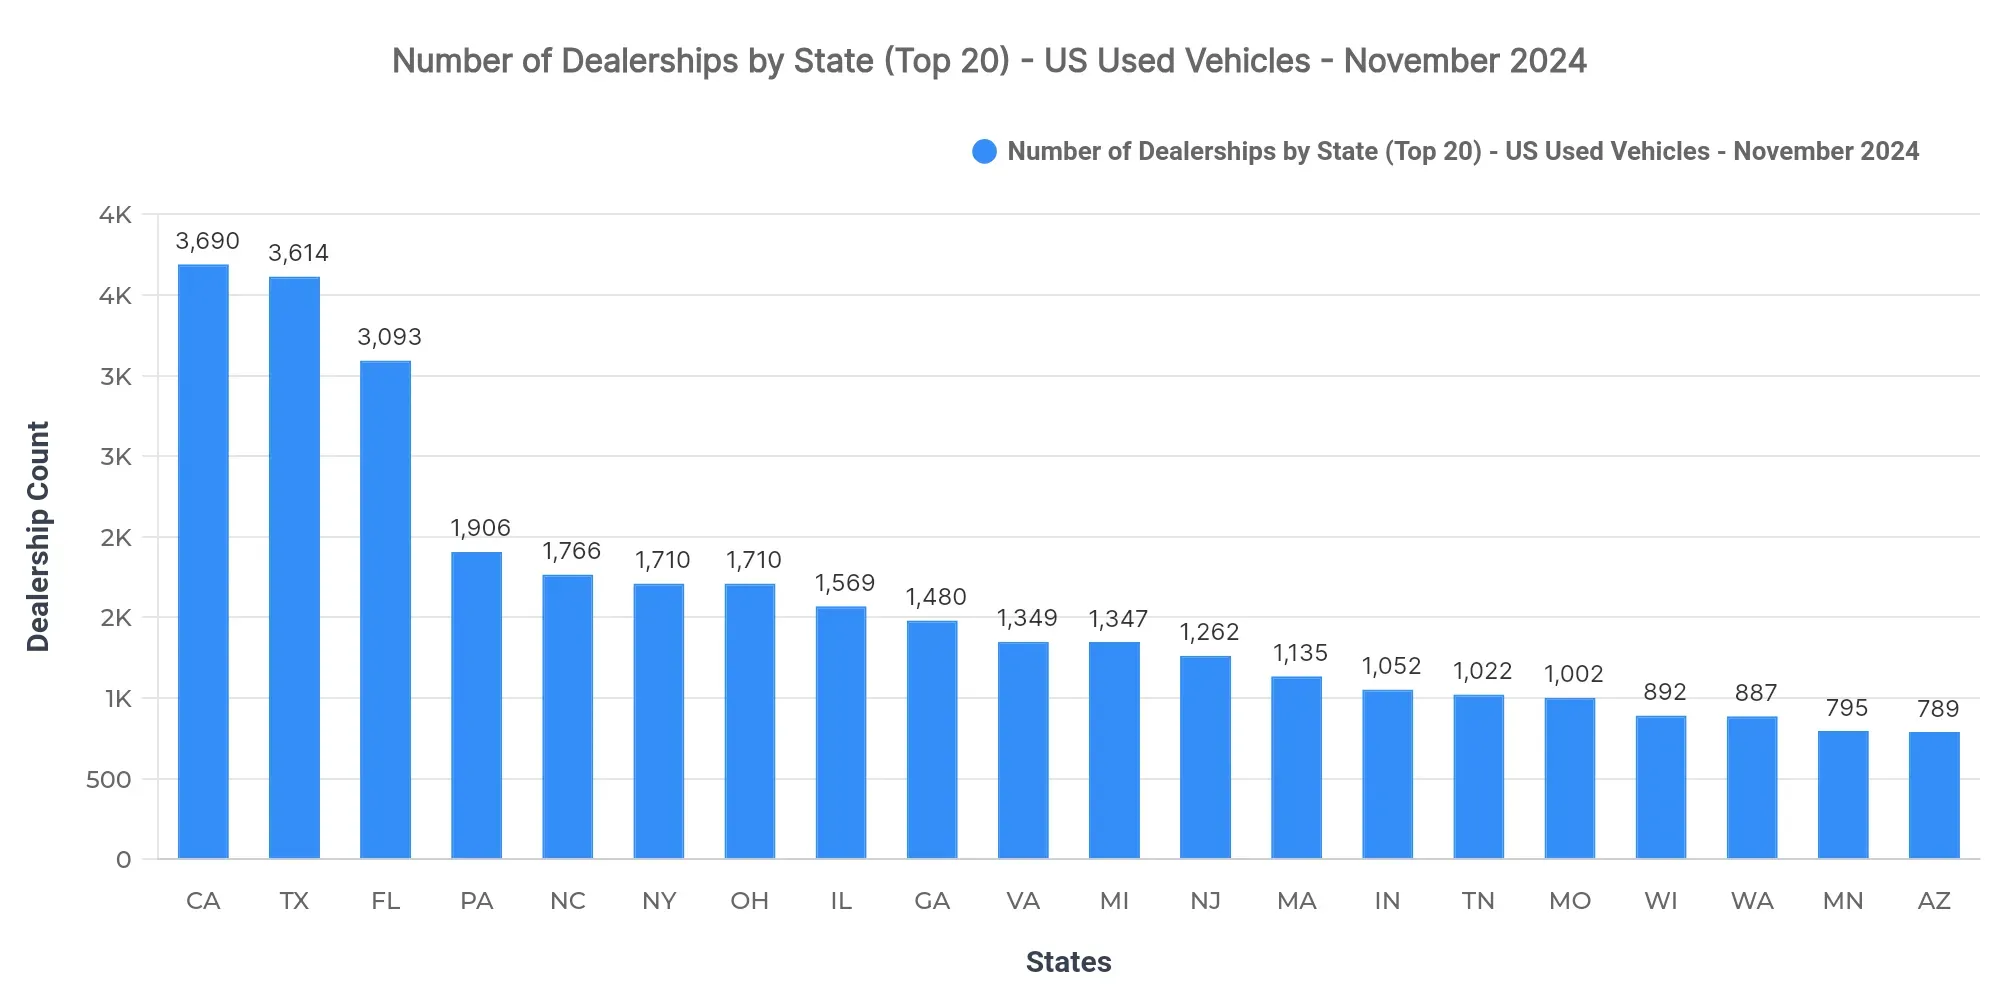
California (3,690), Texas (3,614), and Florida (3,093) lead with the most dealerships. This concentration suggests a saturated market in these states, likely driven by high consumer demand and vehicle turnover rates. Such saturation may pose challenges for new dealerships seeking entry in these markets.
Top 10 States by Sold Volume
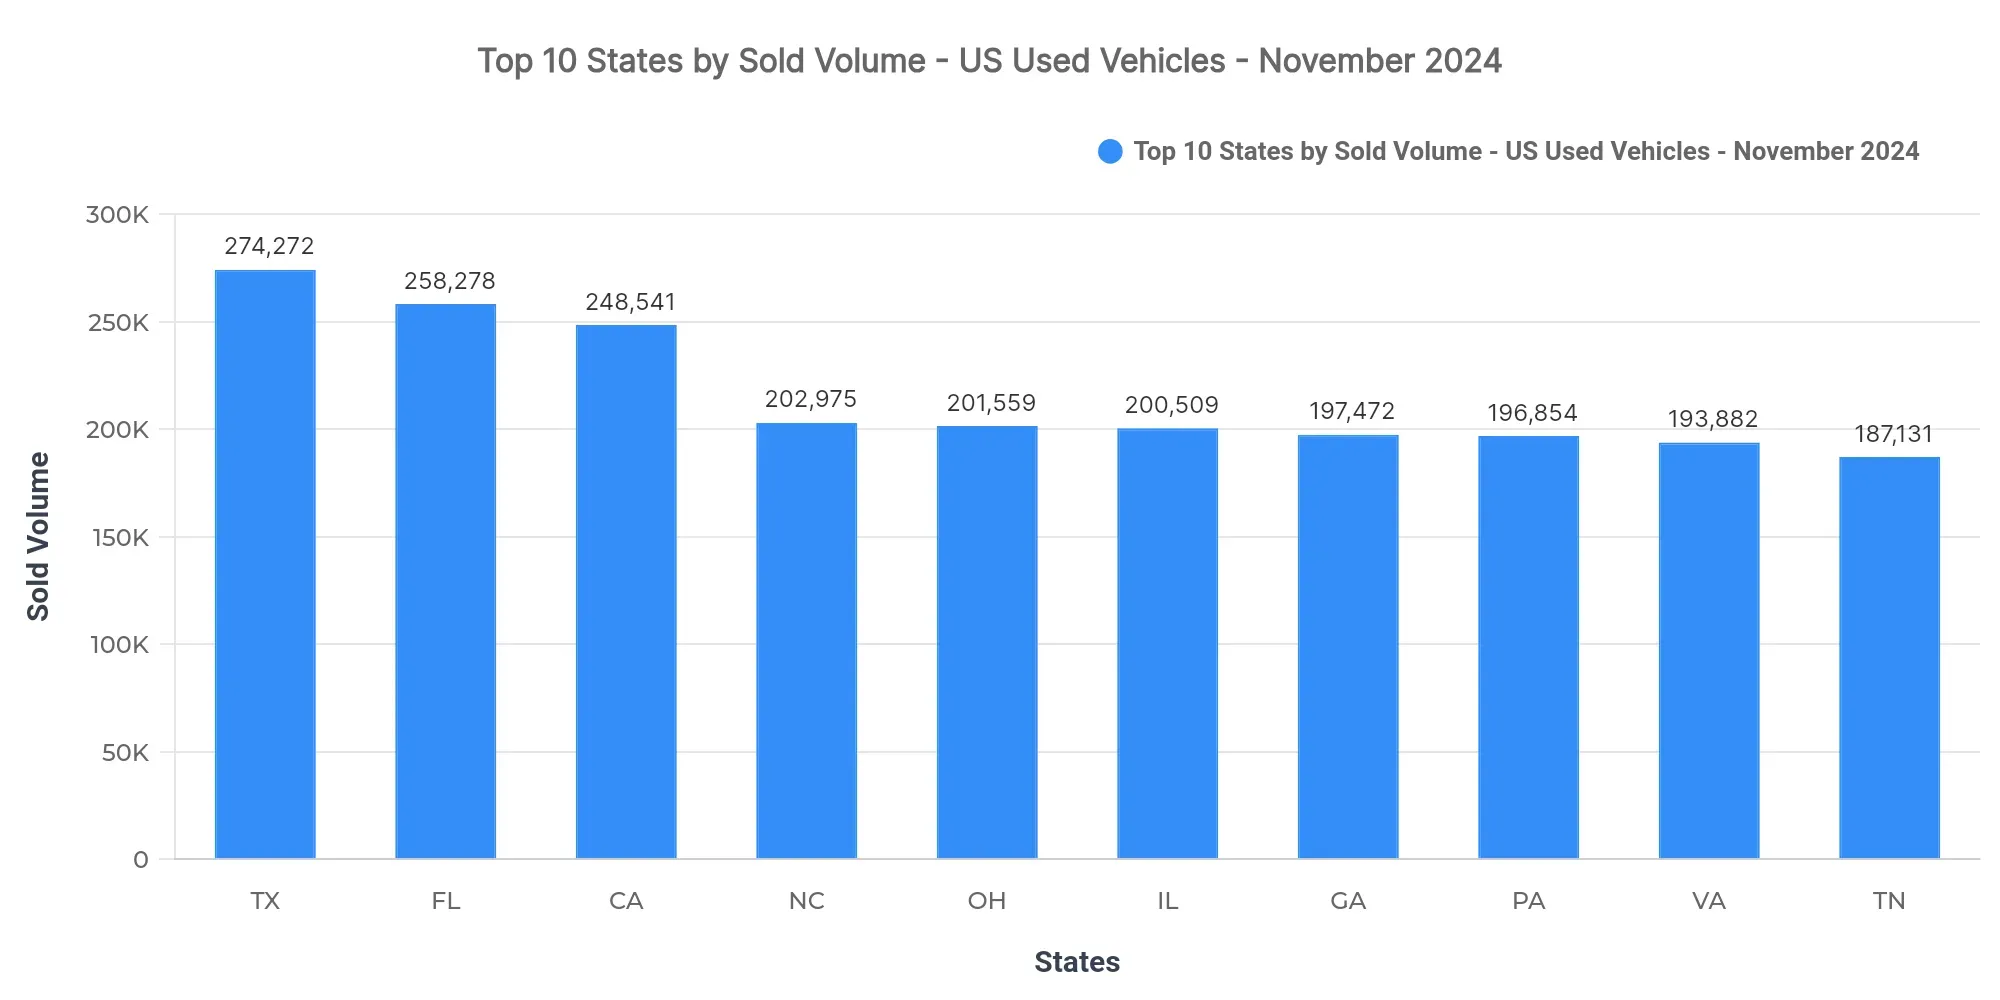
Texas (274,272), Florida (258,278), and California (248,541) lead in sold volume, collectively representing 10.9% of the national sales volume. The remaining top-10 states are North Carolina, Ohio, Illinois, Georgia, Pennsylvania, Virginia, and Tennessee.
Market concentration can be observed as Texas, Florida, and California alone significantly dominate sales, highlighting localized economic strength or consumer preferences. Particularly, the Southern and Western regions show strong performance, indicating robust demand possibly linked to population density and economic activity.
Price Breakdown: Top 10 States by Sold Volume
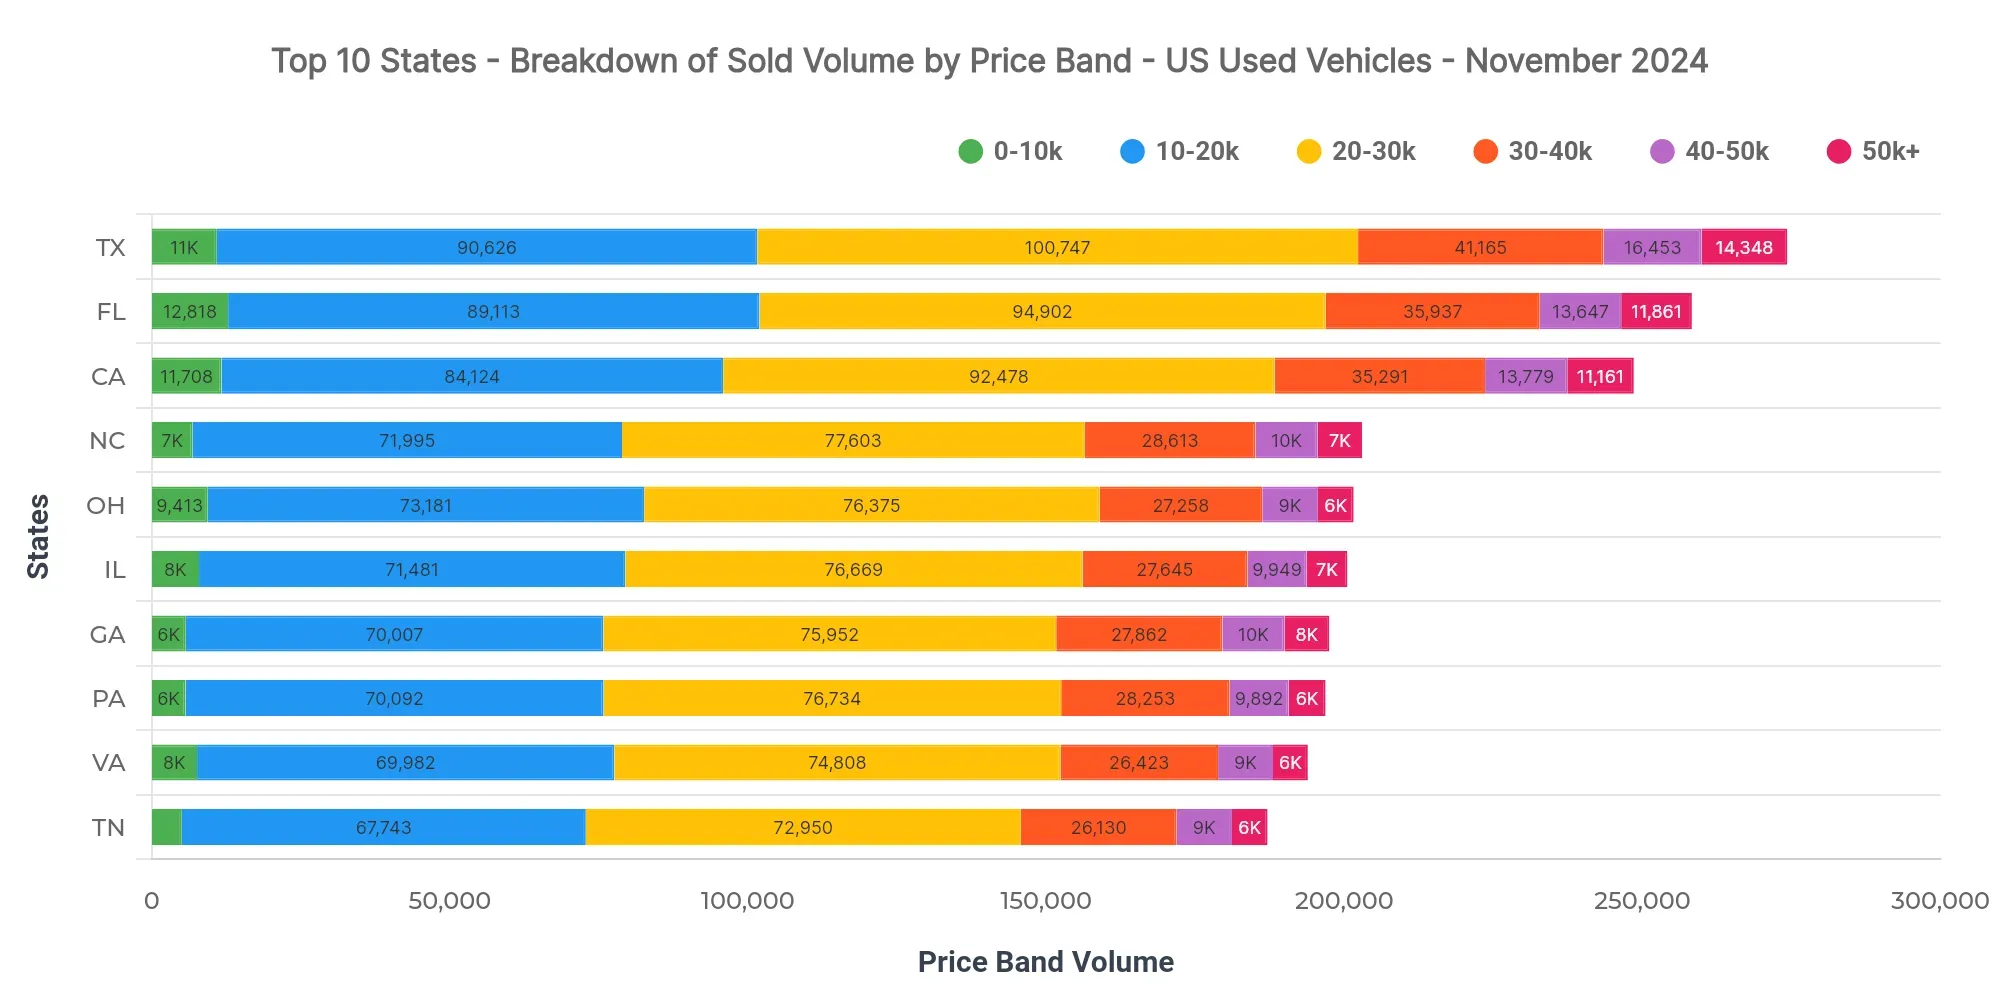
In Texas, price bands $20K–$30K (36.7%), $10K–$20K (33%), and $30K–$40K (15%) are dominant. Additionally, the $40K–$50K (6%) band marks a notable upper-price tail. Compared to other top states, California averages $25,740 and Florida $25,259.
Dealers should focus inventory on the mid-range price bands to maximize sales potential. From a pricing and lending perspective, the strong presence of lower and mid-tier price bands suggests affordability remains a pivotal factor in buyer decision-making.
Market Breakdown by Fuel Types
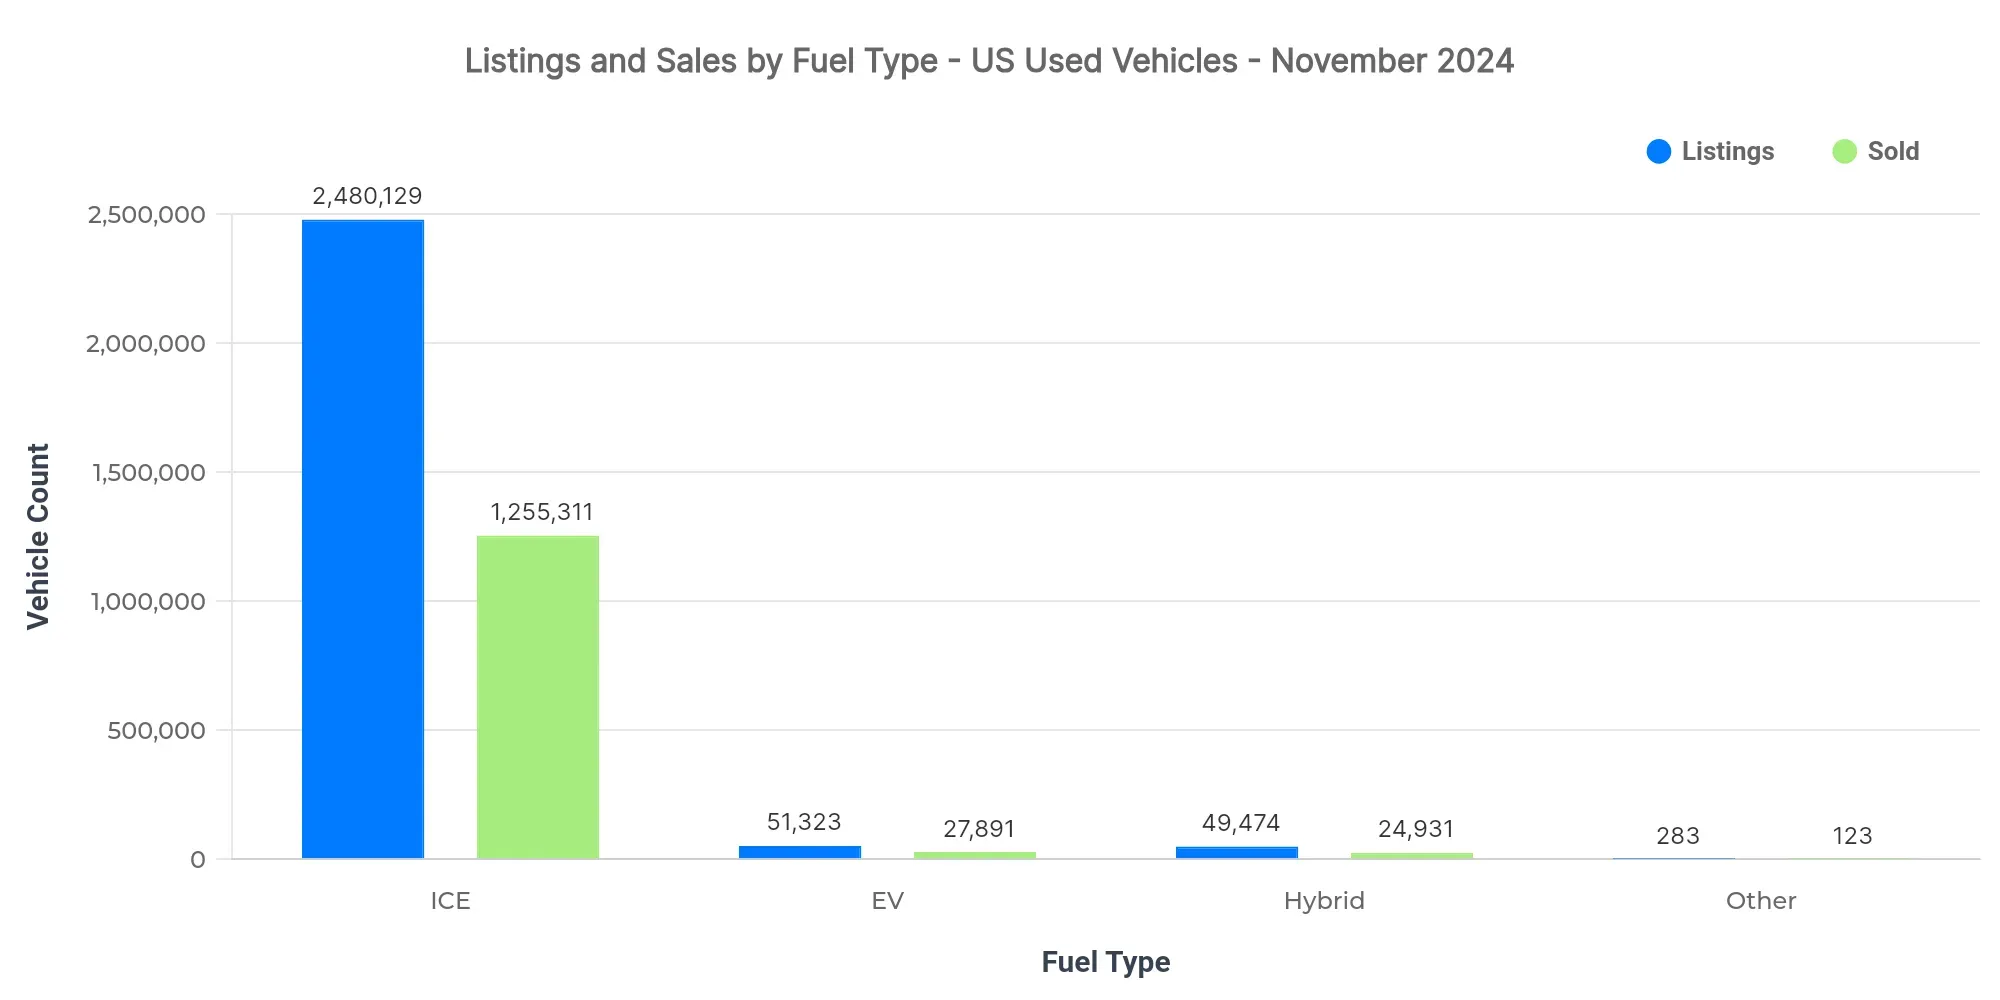
The ICE vehicles lead in both listings and sales volume, showing their dominance in the market. EVs experience premium pricing, with an average sold price notably higher than hybrids, which captures the mid-market segment. Despite lower sales, EV adoption is gradually increasing.
| Fuel Type | Listings Count | Sold Count | Avg Listing Price | Avg Sold Price |
|---|---|---|---|---|
| ICE | 2.48M | 1.26M | $25,096 | $25,087 |
| EV | 51.3K | 27.9K | $33,852 | $31,227 |
| Hybrid | 49.5K | 24.9K | $28,136 | $26,747 |
| Other | 283 | 123 | $14,709 | $12,783 |
- EV adoption is progressing but remains premium-priced.
- ICE vehicles clearly dominate the marketplace.
- Hybrid pricing suggests a balance between cost and economy, attracting mid-tier buyers.
Market Share by Body Types
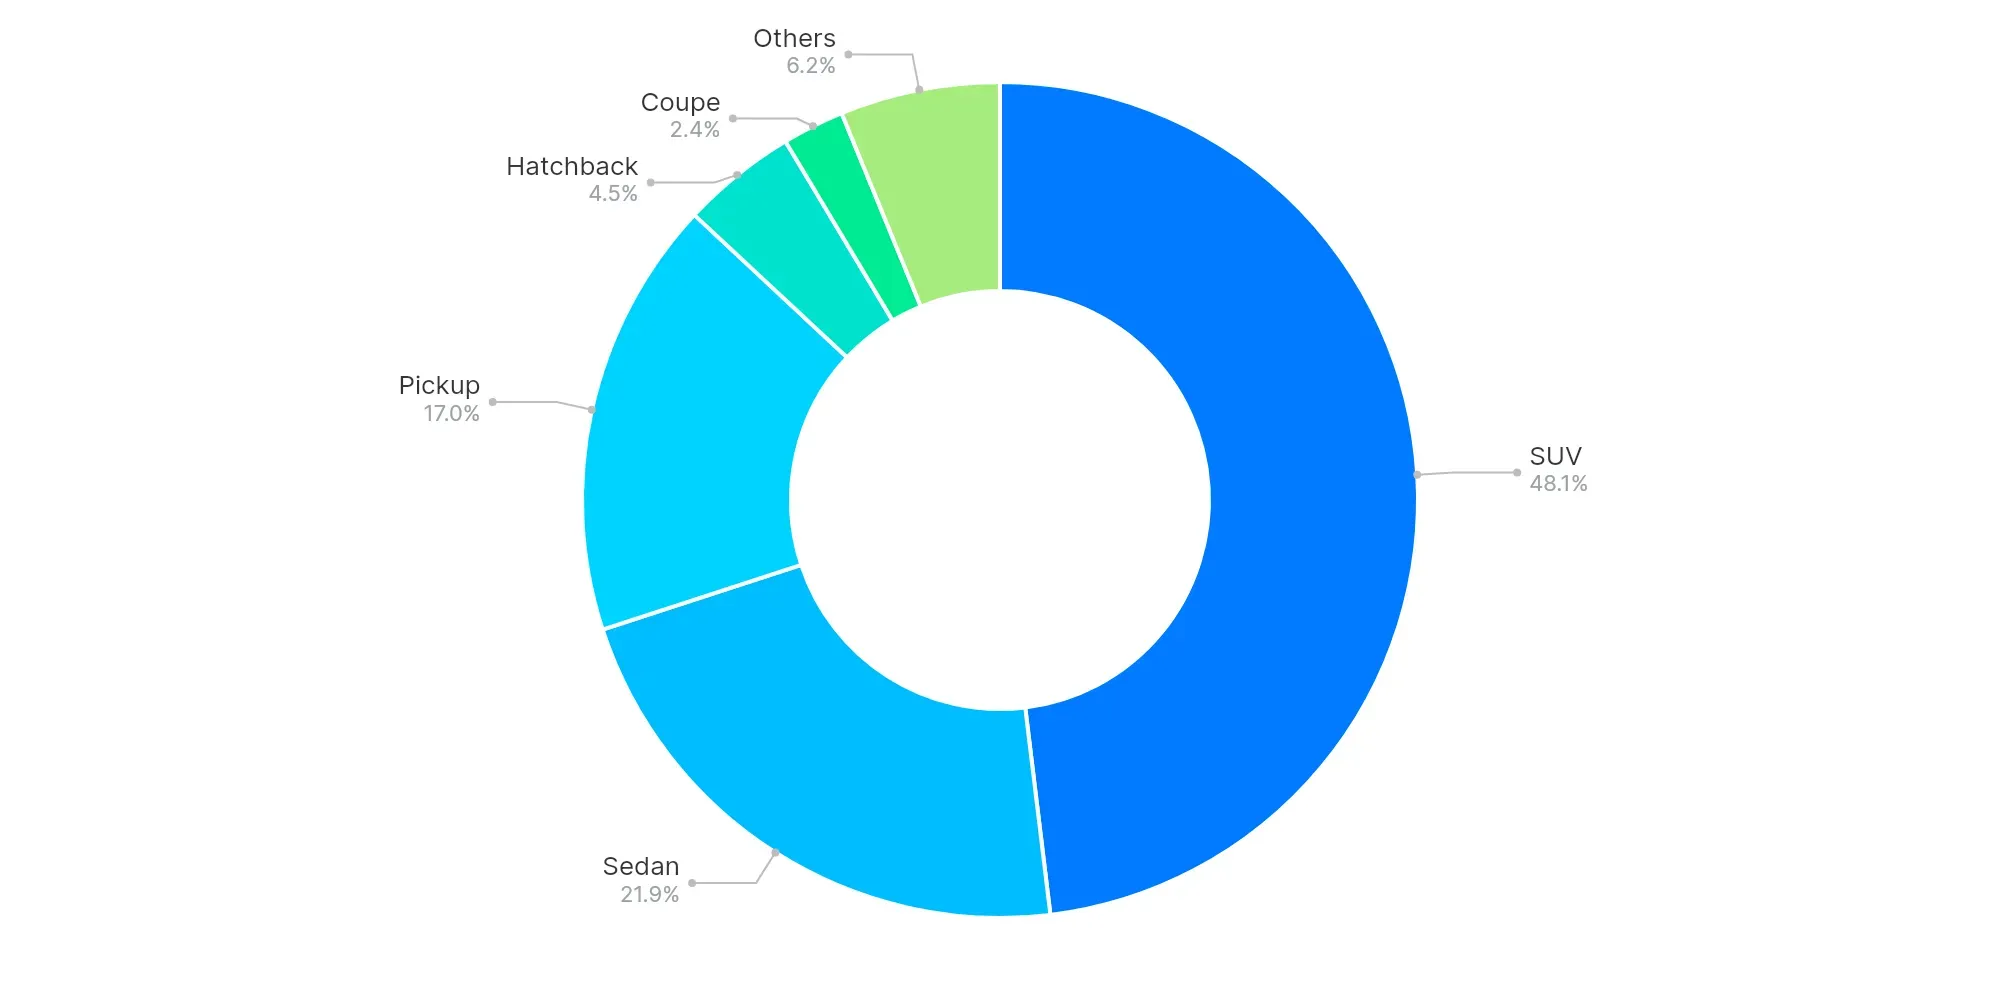
SUVs (48.1%), Sedans (21.9%), and Pickups (17%) make up the largest market shares. SUVs and Pickups highlight a consumer preference for larger vehicles, fitting practical lifestyle needs and family usage trends. The shift towards SUVs suggests an increasing consumer favor for versatility and family-friendliness in vehicle choice.
High-Volume vs Low-Volume States (Executive Insights)
- Top-performing states: Texas, Florida, California
- Underpenetrated regions: US Virgin Islands, Guam, Puerto Rico
- Key price bands: $20K–$30K, $10K–$20K, $30K–$40K
- EV trend: Gradual adoption but higher price point
- Buyer preferences: Favoring SUVs and mid-range price bands
As the used car market continues to evolve, aligning inventory with dominant body types and providing competitive financing for higher price bands will be essential strategies for dealerships. Analysts should focus on market penetration opportunities in underrepresented regions.