

US Monthly Used Car Market Data – November 2023
This report offers an analytical overview of the US used vehicle market for November 2023, covering dealer activity, sales volume, pricing dynamics, fuel types, body styles, and regional performance. By focusing on these core facets, we deliver precise insights to inform automotive industry stakeholders.
Number of Dealerships by State
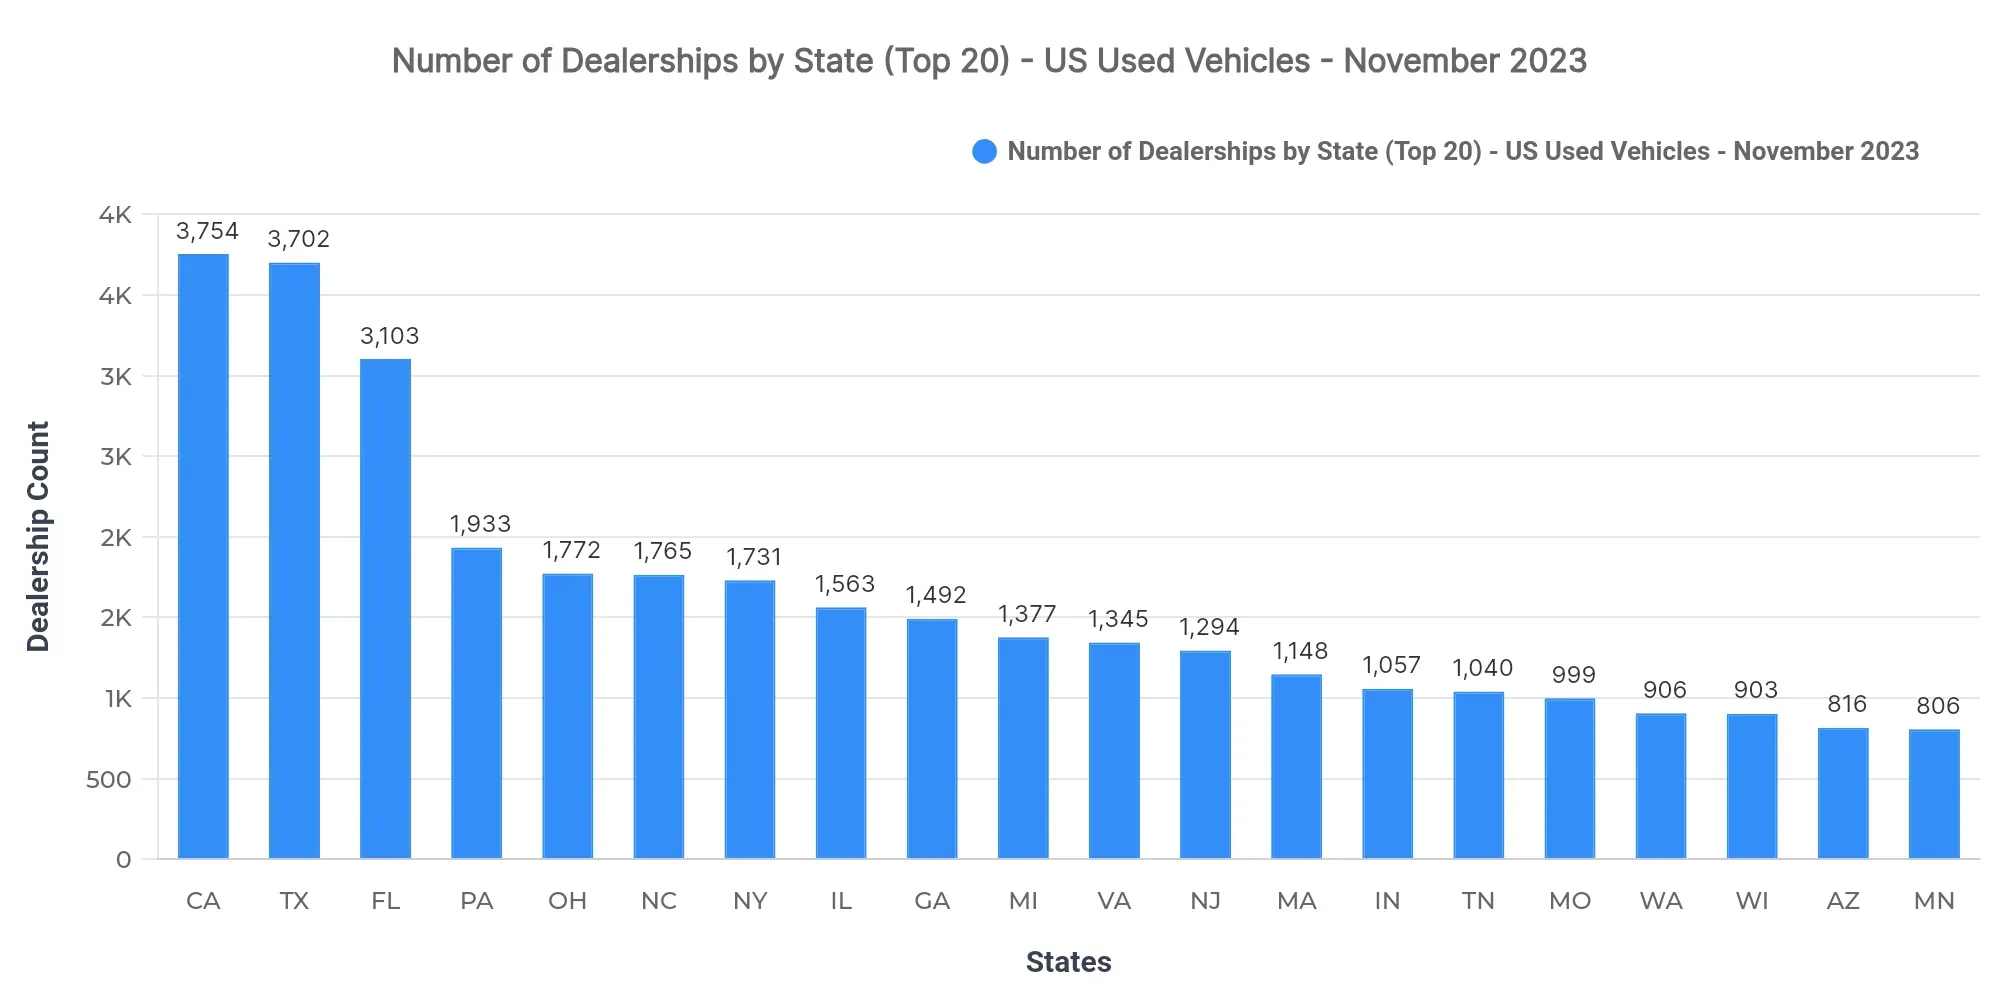
California (3,754), Texas (3,702), and Florida (3,103) lead in dealership counts. This concentration suggests significant market saturation in these regions, potentially offering robust competition among local dealerships but also ample consumer choice and dealership networks.
Top 10 States by Sold Volume
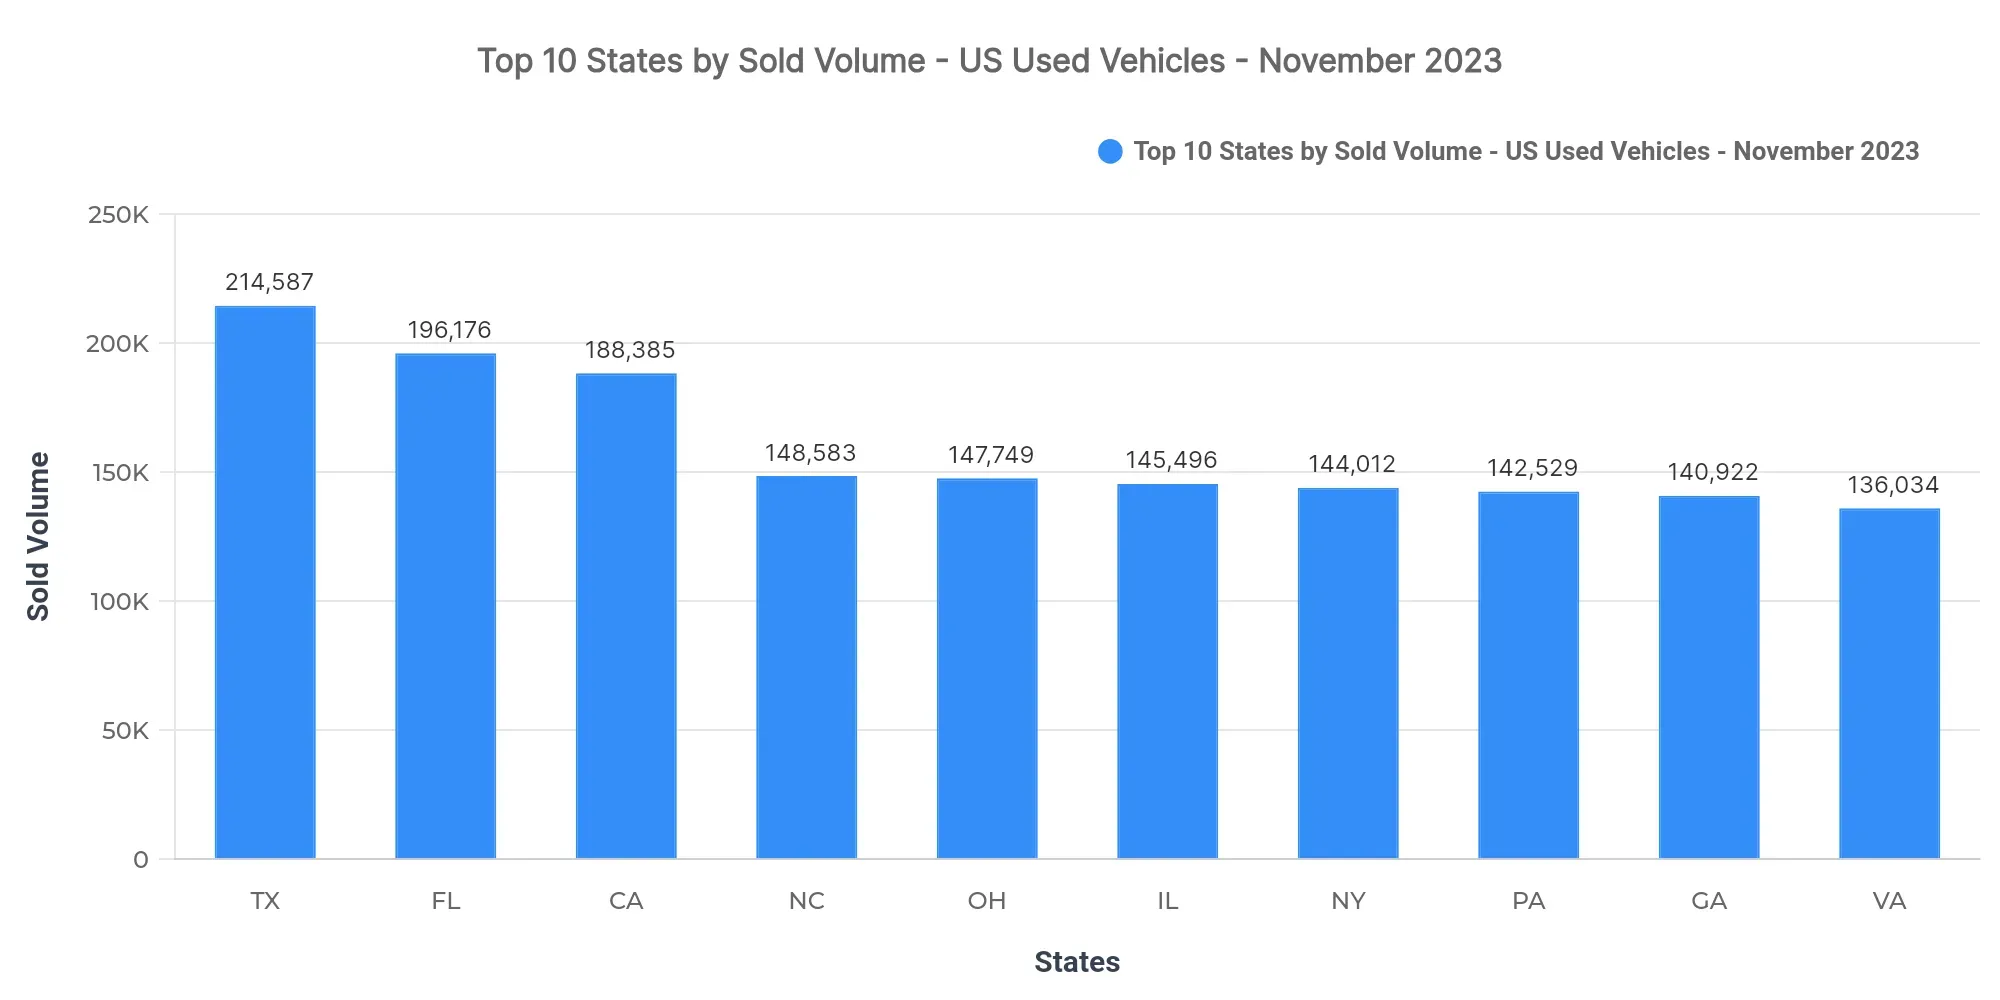
Texas (214,587), Florida (196,176), and California (188,385) lead in sales volume, collectively representing 11.8% of the national sold volume. The remaining top-10 states are North Carolina, Ohio, Illinois, New York, Pennsylvania, Georgia, and Virginia. This concentration in the top three states highlights their pivotal role in shaping national market trends.
Market concentration in specific states reflects potential growth limitations in other regions where consumer demand might not yet be fully tapped. Regional demand patterns indicate a stronger preference for used vehicles in the southern and western states, underscoring opportunities for dealers in less saturated markets.
Price Breakdown: Top 10 States by Sold Volume
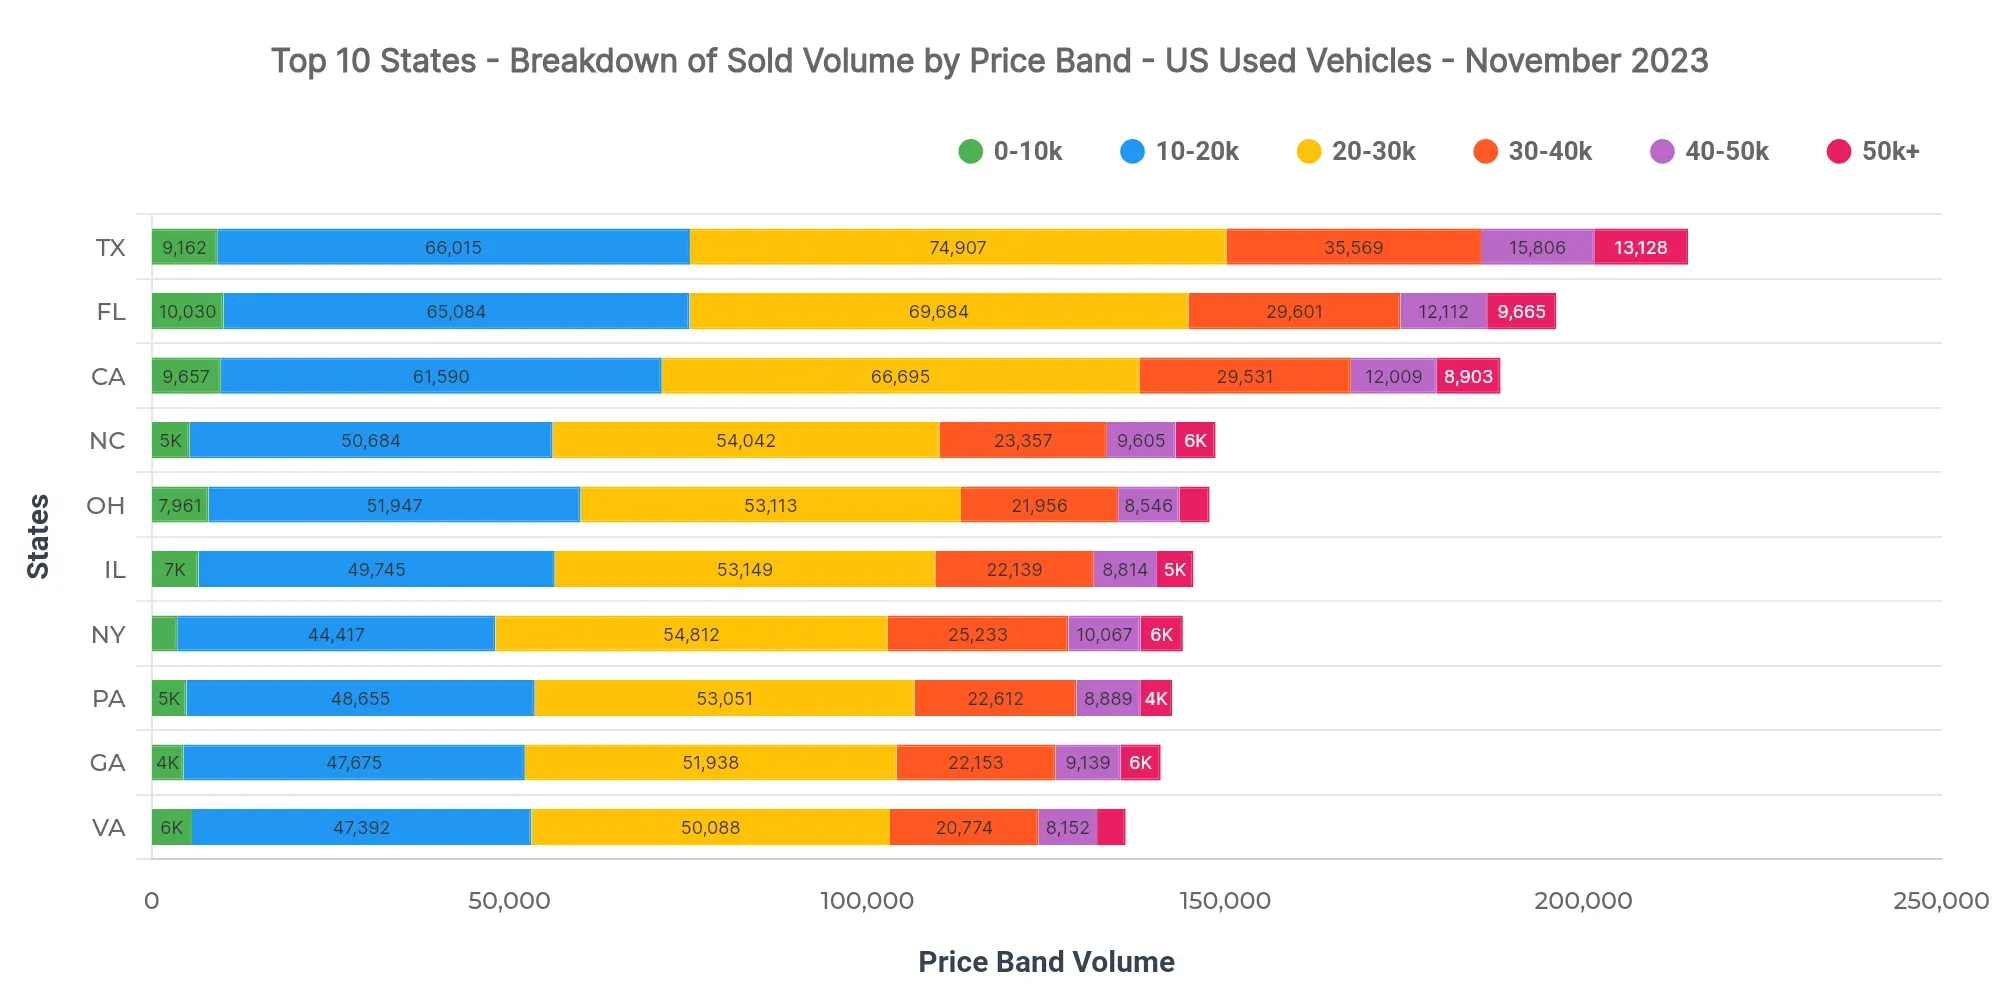
In Texas, the dominant price bands are $20K–$30K (34.9%), $10K–$20K (30.8%), and $30K–$40K (16.6%). A smaller segment, $40K–$50K, holds 7.4%. California at $26,435 and Florida at $26,055 highlight slightly lower average sold prices compared to Texas at $26,462.
Dealers in Texas should continue to focus inventory in the $10K–$40K range to align with market demand. Price-sensitive lending solutions could be pivotal to ease consumer entry into even higher bands, notably above $40K.
Market Breakdown by Fuel Types
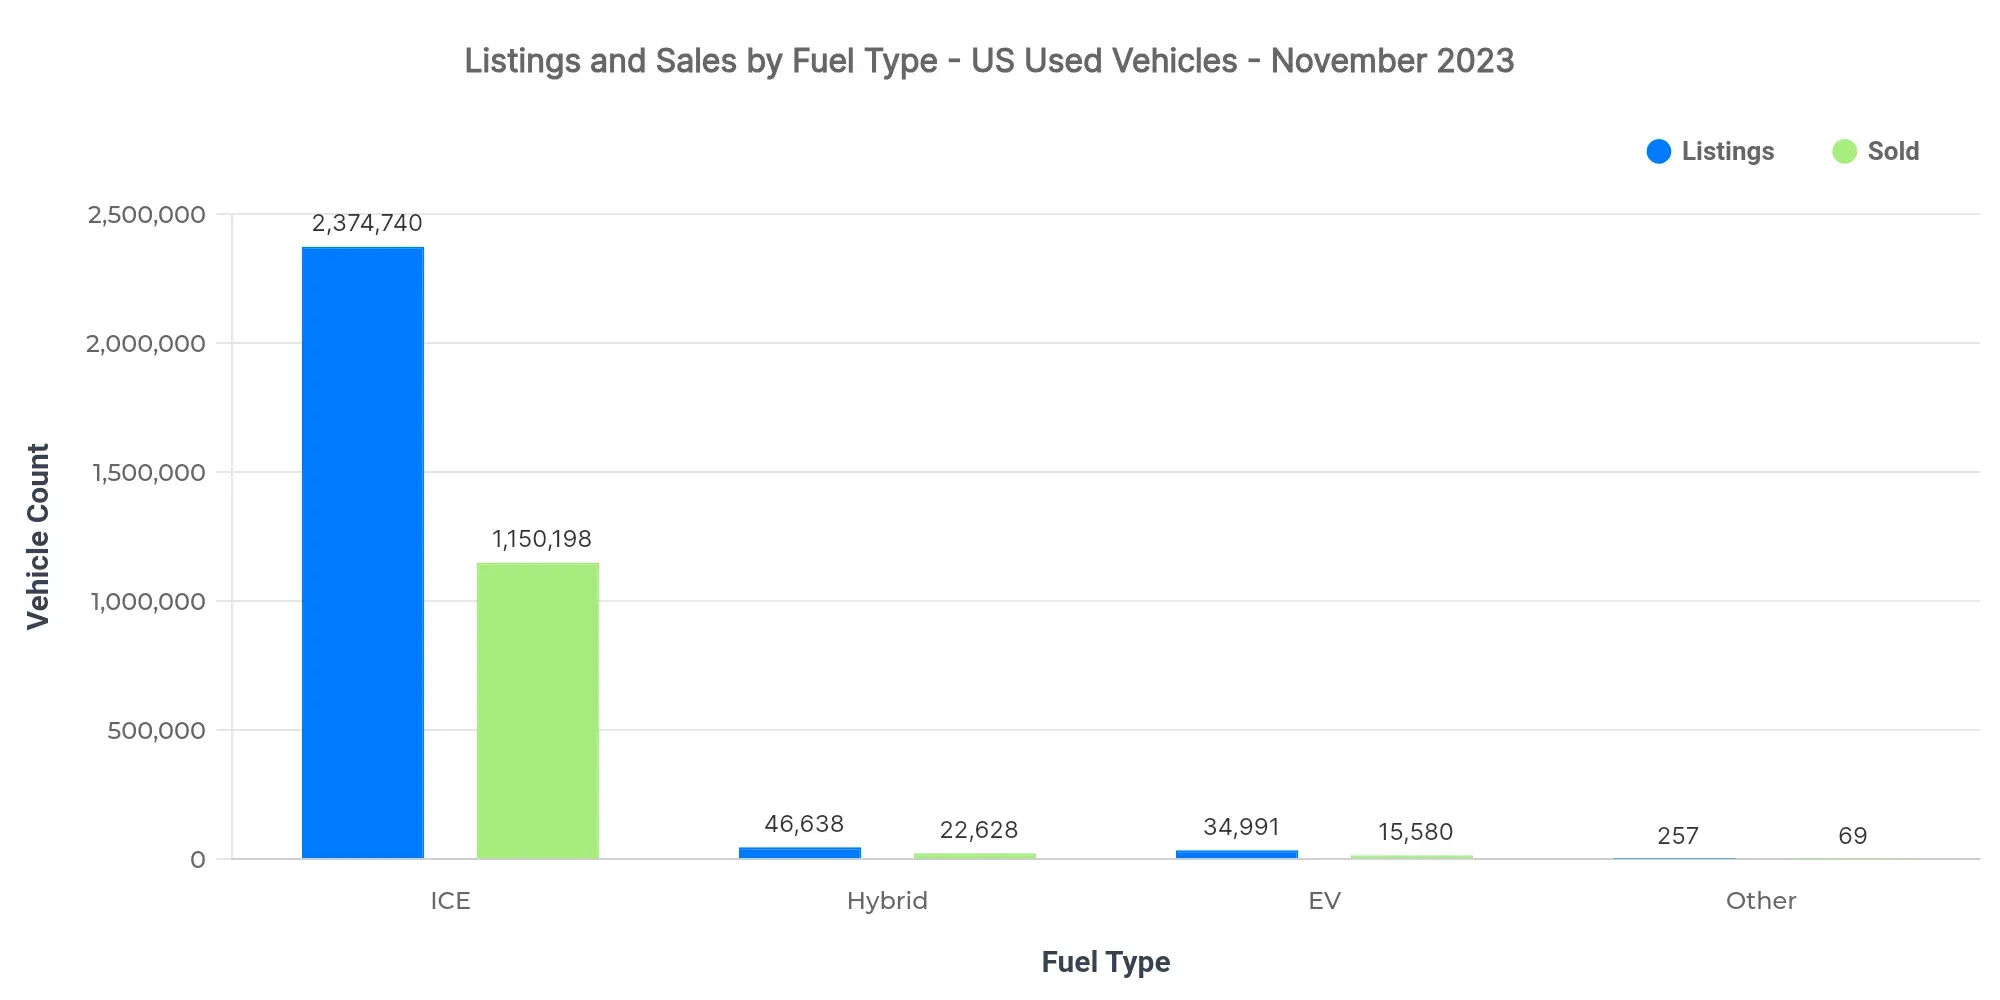
ICE vehicles lead with the highest listings and sales volumes. Hybrids command a premium, with average listing and sold prices significantly over ICE. Electric vehicles, while lower in volume, register the highest average prices, reflecting an early adoption stage with rich consumer segments.
| Fuel Type | Listings Count | Sold Count | Avg Listing Price | Avg Sold Price |
|---|---|---|---|---|
| ICE | 2.37M | 1.15M | $26,159 | $25,625 |
| Hybrid | 46.64K | 22.63K | $28,511 | $26,897 |
| EV | 34.99K | 15.58K | $41,470 | $39,179 |
| Other | 257 | 69 | $16,178 | $16,188 |
- EV adoption is progressing with price premiums indicating a niche market.
- ICE vehicles remain dominant, though hybrids are well-positioned in mid-range pricing.
- Hybrid and EV price points suggest ongoing competitive dynamics in alternative fuels.
Market Share by Body Types
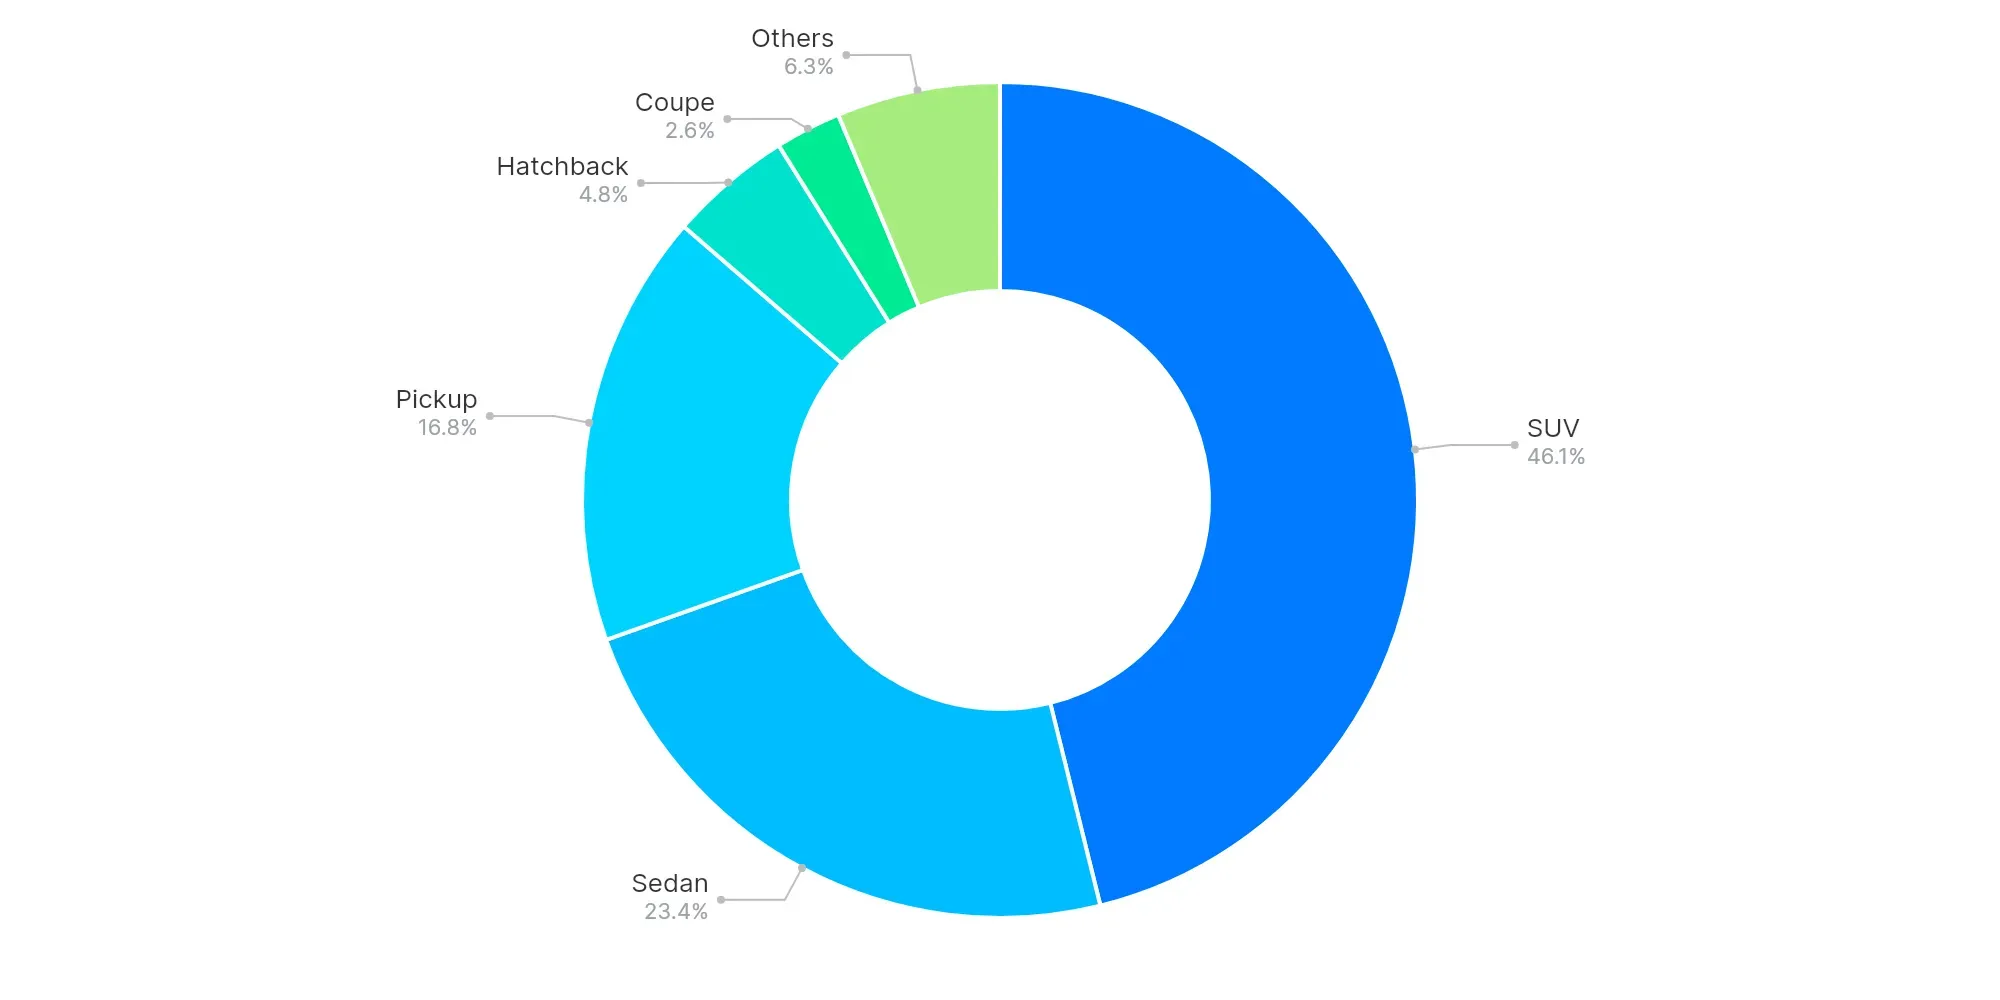
SUVs (46.1%), Sedans (23.4%), and Pickups (16.8%) dominate. The preference for larger vehicles, such as SUVs and Pickups, indicates consumer demand trends favoring higher capacity and versatility vehicles.
The continued preference for SUVs and Pickups underscores a trend towards larger, more versatile vehicles, likely driven by lifestyle choices and improved fuel efficiency in these categories.
High-Volume vs Low-Volume States (Executive Insights)
- Top-performing states: Texas, Florida, and California
- Underpenetrated regions: Virgin Islands, Guam, Northern Mariana Islands
- Key price bands: $10K–$20K, $20K–$30K, $30K–$40K
- Emerging EV trend with significant premium pricing
- Buyer preferences lean toward SUVs and Pickups for versatility and capability
In summary, the US used vehicle market exhibits strong regional concentration in high-volume states with substantial room for expansion in underpenetrated areas. Dealers should prioritize stocking vehicles in key price bands prevalent among top-selling states and monitor emerging trends in alternative fuel vehicles. This approach will optimize inventory strategy and capitalize on dynamic consumer preferences.