

US Monthly Used Car Market Data – May 2025
This report provides an analytical overview of the US used vehicle market in May 2025, focusing on dealer activity, sales volume, pricing, fuel types, body types, and regional performance. Key insights are derived from structured datasets to assist in understanding current market dynamics.
Number of Dealerships by State
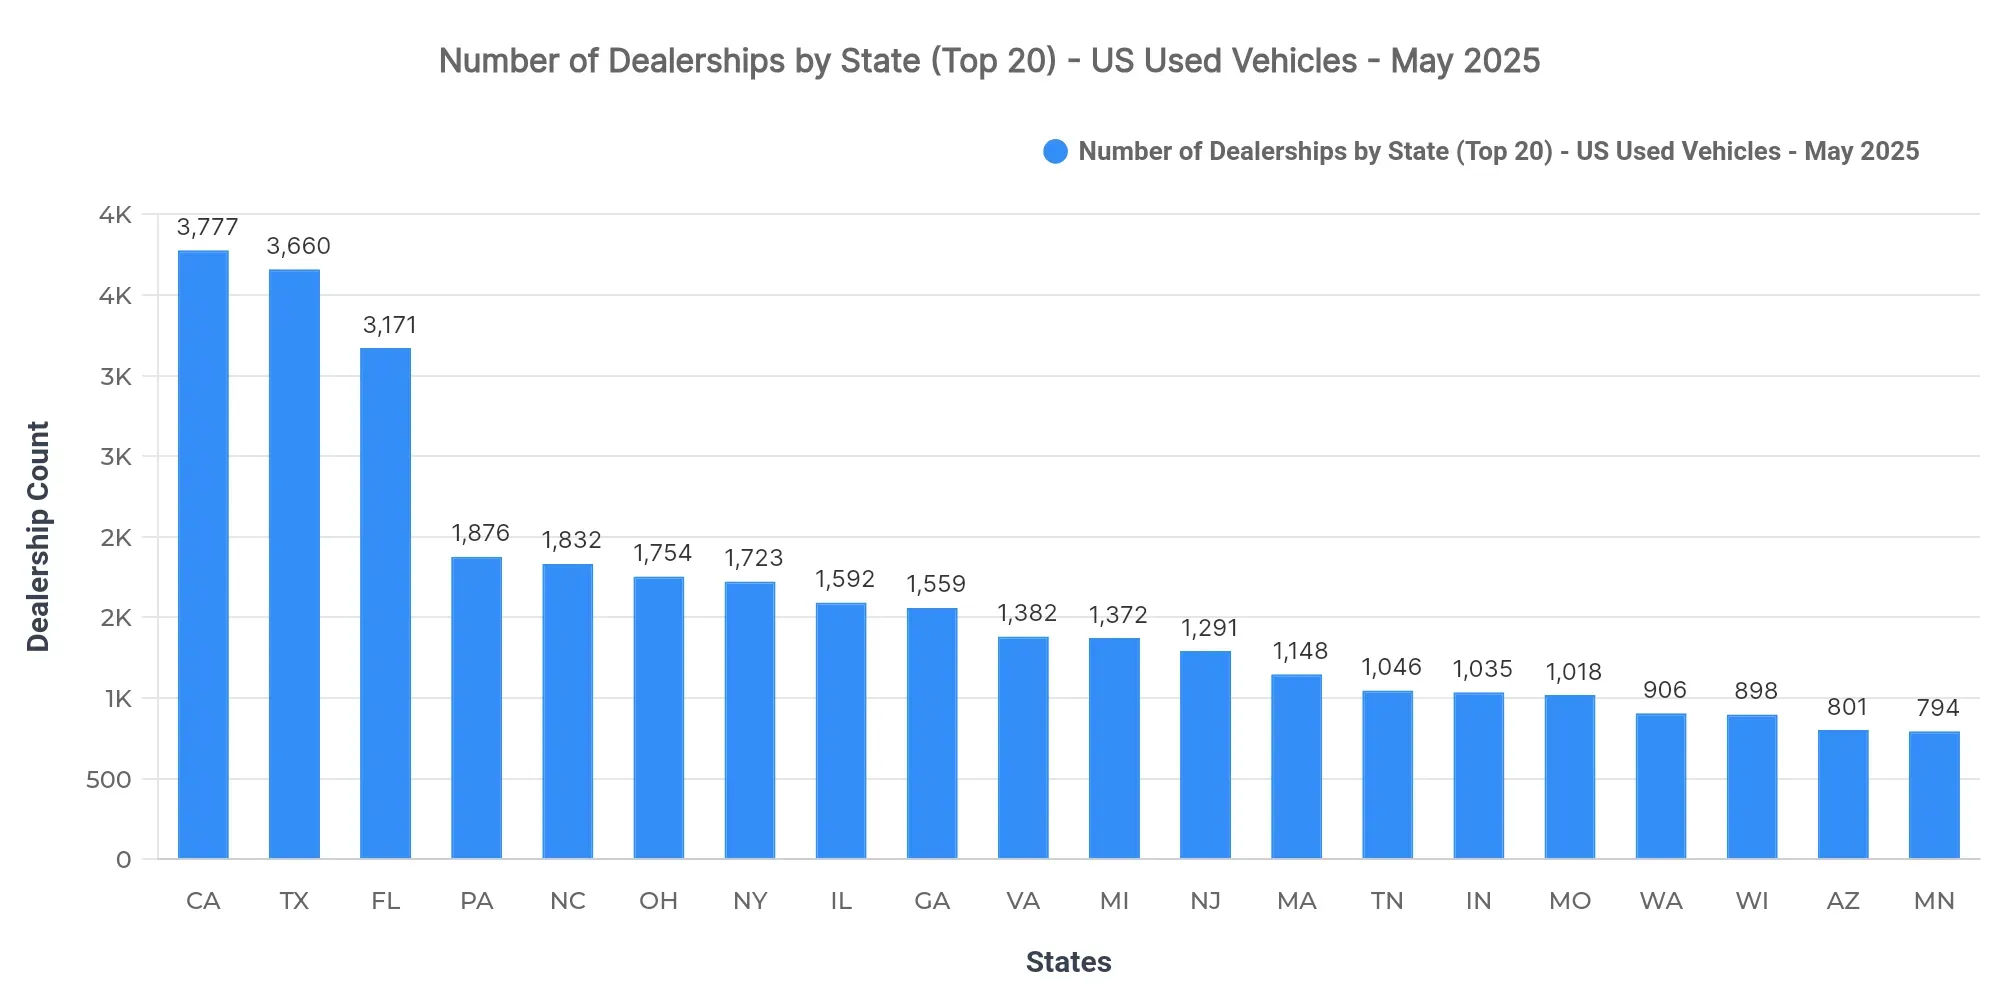
California (3,777), Texas (3,660), and Florida (3,171) lead in dealership counts, indicating robust market infrastructure. The concentration of dealerships in these states suggests higher market saturation, potentially reducing the entry opportunities for new players. With a significant dealer presence, these states are well-positioned to influence national market trends.
Top 10 States by Sold Volume
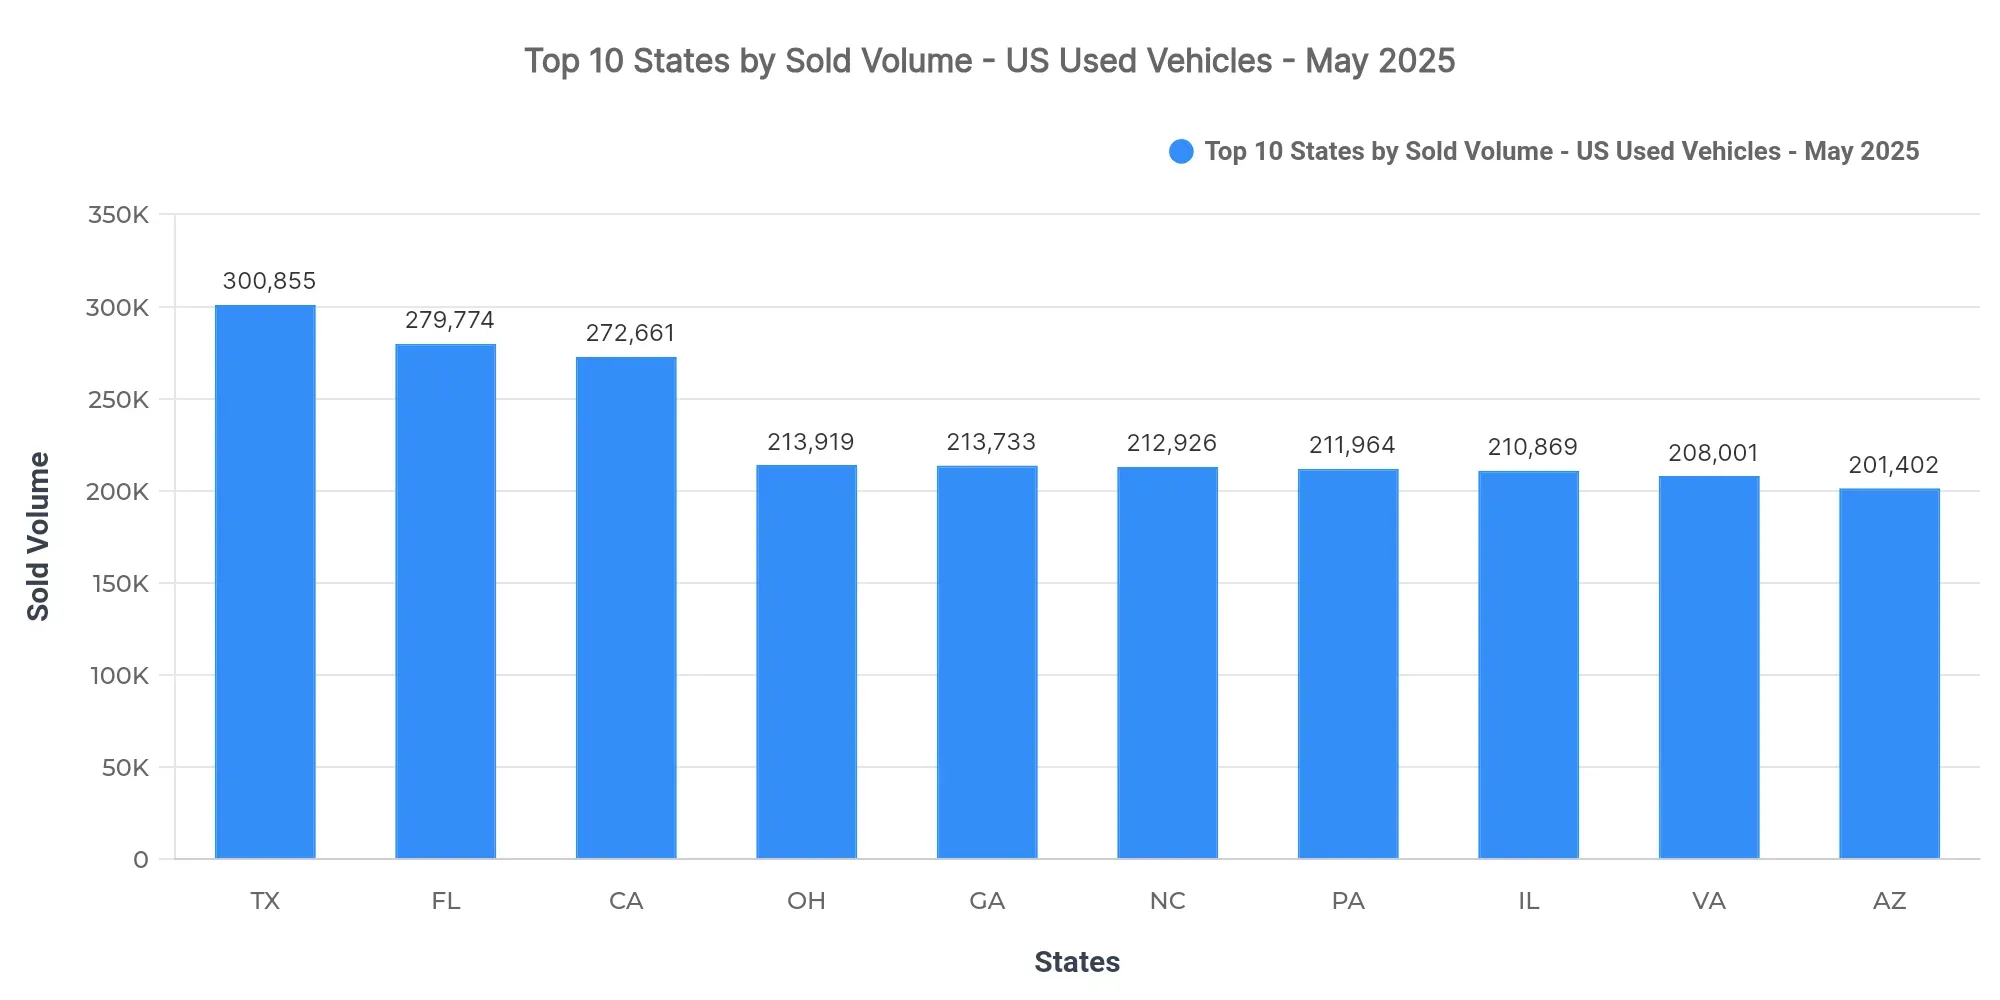
Texas (300,855), Florida (279,774), and California (272,661) lead in sold volume, collectively accounting for 11.2% of the national sold volume. The top three states show a significant market share showcasing their dominance. The remaining top 10 comprises Ohio, Georgia, North Carolina, Pennsylvania, Illinois, Virginia, and Arizona.
The market concentration in the top states reflects a strategic focus on high-demand regions. Buyer preferences in southern states reveal a leaning towards larger vehicle types, aligning with lifestyle and geographic needs.
Price Breakdown: Top 10 States by Sold Volume
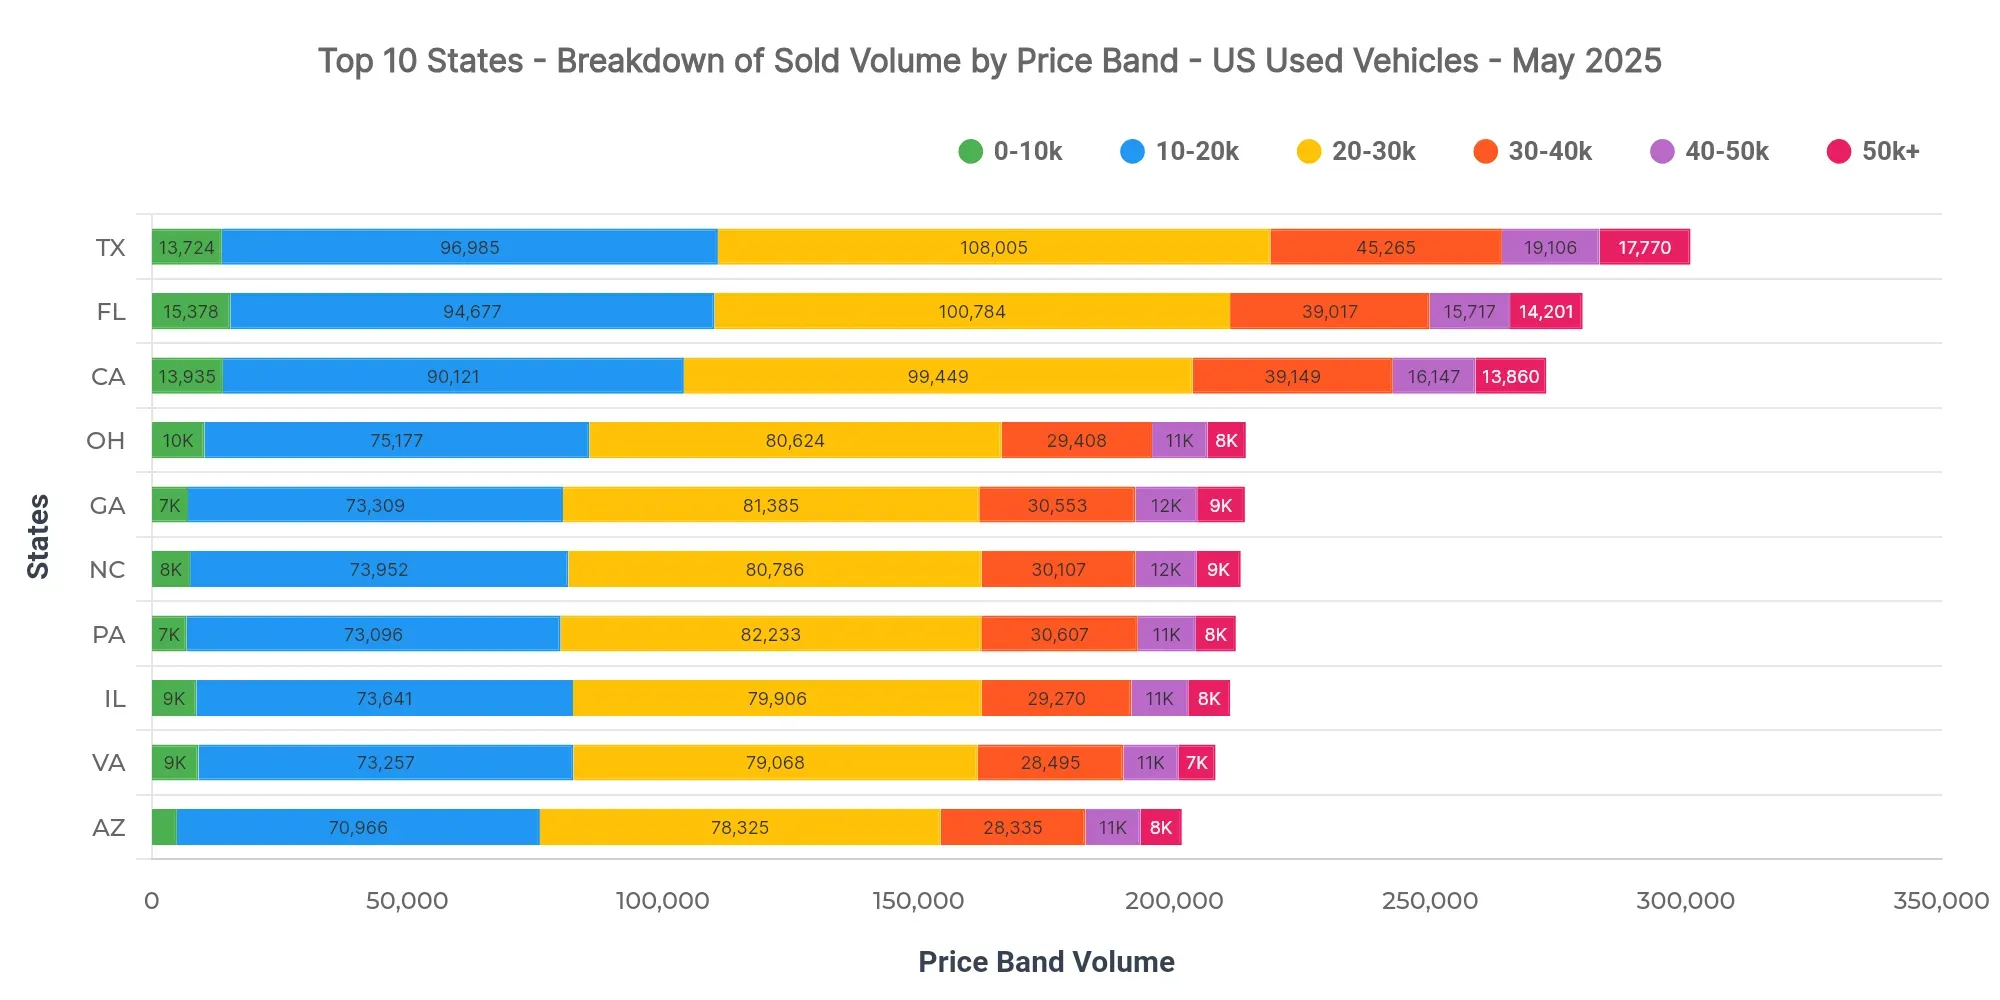
In Texas, the dominant price bands are $20K–$30K (35.9%), $10K–$20K (32.2%), and $30K–$40K (15%). This highlights a robust mid-market demand. Additionally, the $40K–$50K band (6.4%) provides some upper-price insight. Florida at $25,466 and California at $25,882 indicate slightly higher average prices compared to Texas.
Dealers in Texas should focus on optimizing inventory in the $20K–$30K range, which is the most active segment. Pricing trends suggest steady lending conditions complement the mid-market movements.
Market Breakdown by Fuel Types
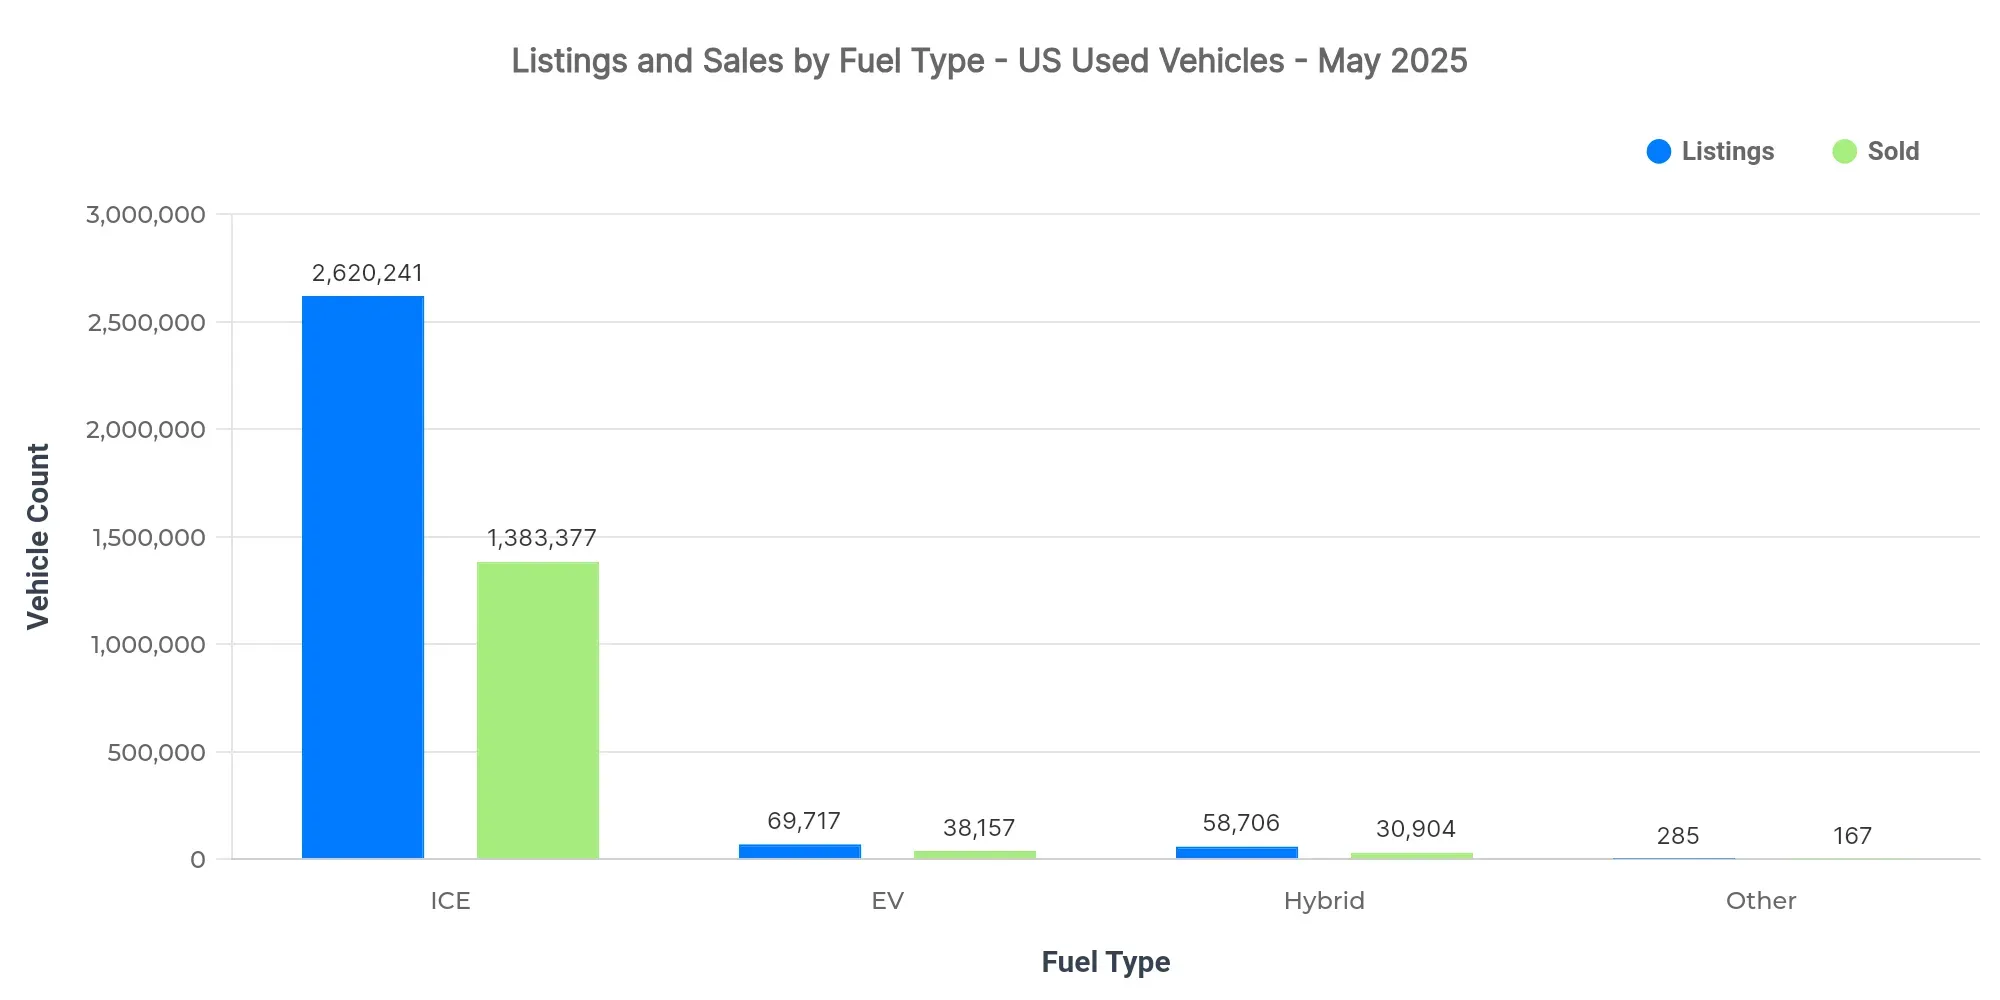
The analysis shows that ICE vehicles dominate both listings and sales, while hybrids and EVs also contribute significantly despite smaller volumes. EVs command premium pricing, reflecting newer technology adoption influences.
| Fuel Type | Listings Count | Sold Count | Avg Listing Price | Avg Sold Price |
|---|---|---|---|---|
| ICE | 2.62M | 1.38M | $26,771 | $25,218 |
| EV | 69.7K | 38.2K | $34,187 | $31,025 |
| Hybrid | 58.7K | 30.9K | $28,080 | $25,598 |
| Other | 285 | 167 | $14,054 | $14,408 |
- EV adoption continues its upward trajectory, reflecting increasing consumer interest.
- Premium pricing for EVs suggests significant demand and potential future growth.
- ICE vehicles maintain market dominance, but shifting dynamics may impact future pricing strategies.
Market Share by Body Types
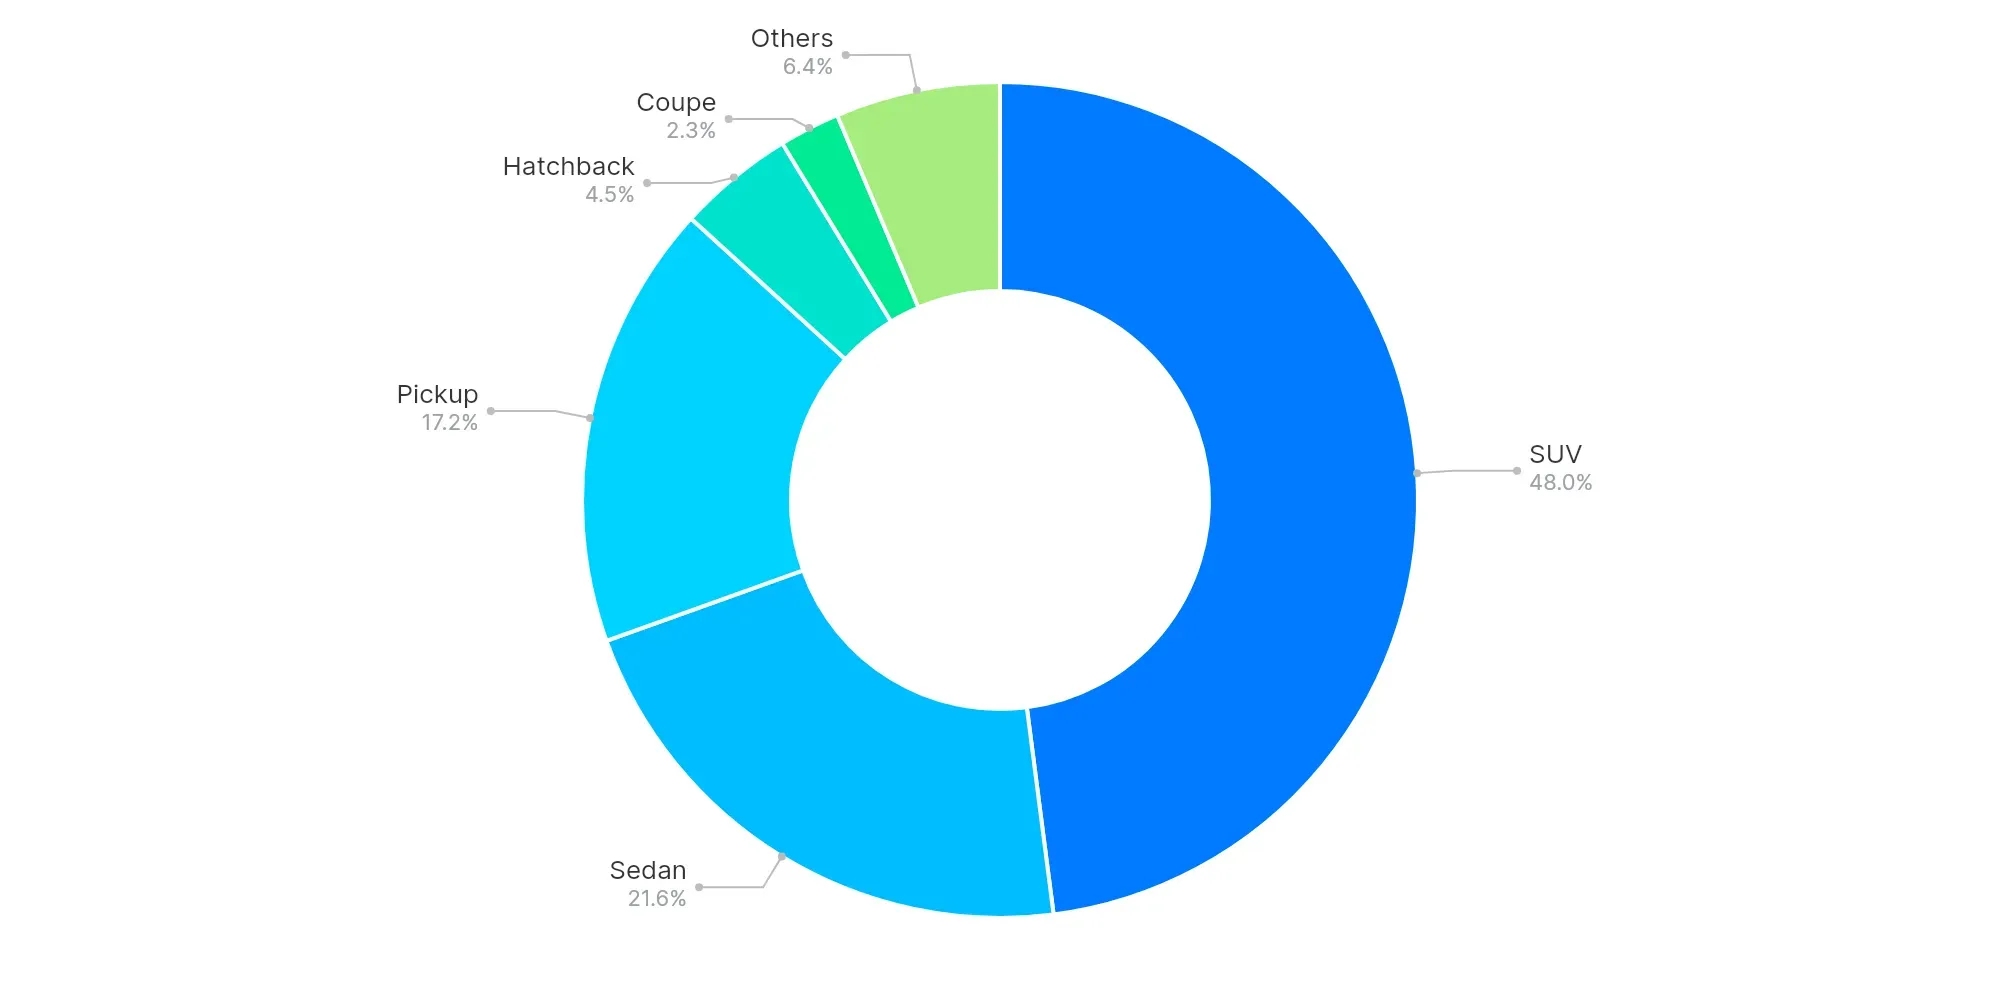
SUVs (48%), Sedans (21.6%), and Pickups (17.2%) dominate the market share by body type. The prominence of SUVs and Pickups underscores a strong preference for versatile and larger-vehicle segments. Consumer trends lean toward vehicles providing practicality and capability, indicative of lifestyle and utility needs.
High-Volume vs Low-Volume States (Executive Insights)
- Top-performing states: Texas, Florida, California
- Underpenetrated regions: Virgin Islands, American Samoa, Northern Mariana Islands
- Key price bands: $20K–$30K, $10K–$20K, $30K–$40K
- EV trend: Growing adoption and premium pricing
- Buyer preferences: Lean toward SUVs and larger vehicles for practicality
The used car market continues to trend positively, with significant traction in larger vehicle segments like SUVs and Pickups. Dealers should align inventory to capitalize on dominant price bands and focus on regions showing higher demand. Analysts should monitor EV trends as adoption rises, affecting both market strategy and pricing models.