

US Monthly Used Car Market Data – May 2024
This report offers insights into the US used vehicle market for May 2024, focusing on dealer activity, sales volume, pricing, fuel types, body types, and regional market performance. Each facet is analyzed to highlight substantial trends and regional differences, presenting a clear picture of the current market dynamics.
Number of Dealerships by State
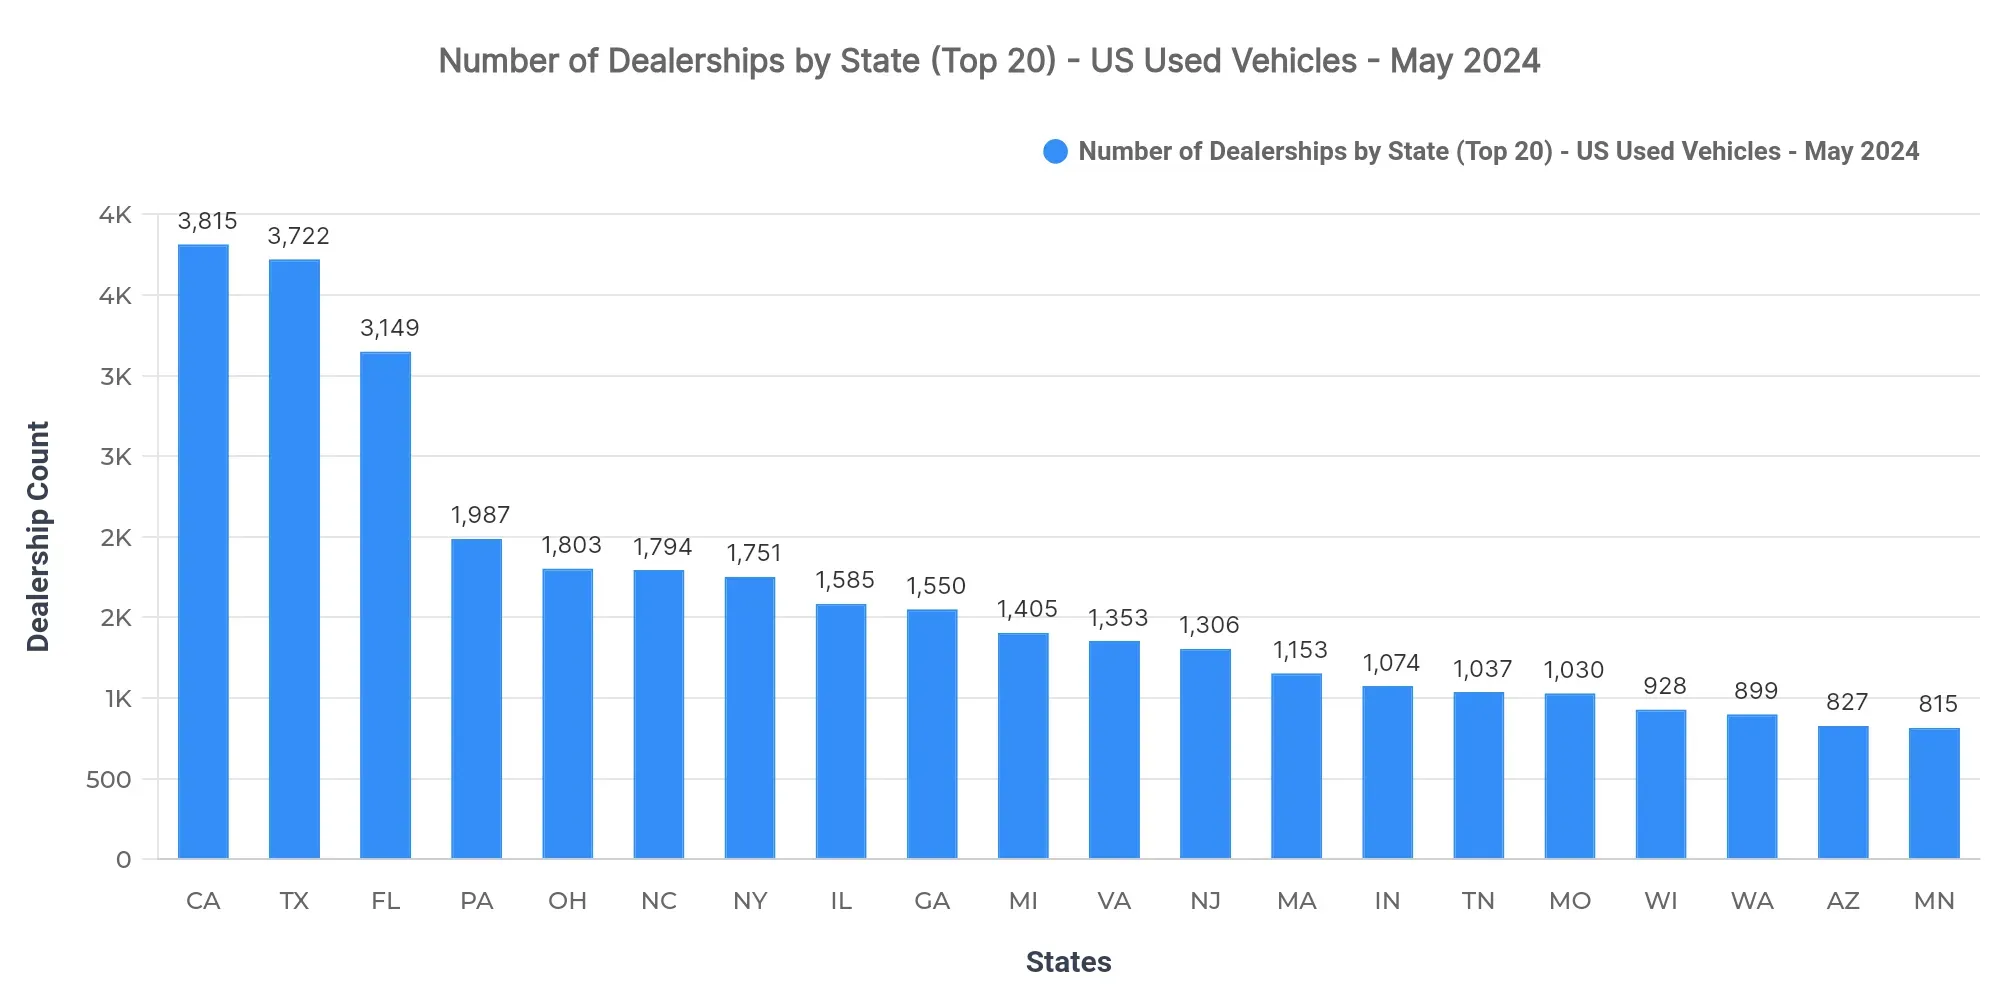
California (3,815), Texas (3,722), and Florida (3,149) lead in the number of dealerships, indicating a significant concentration in these populous and economically vibrant states. This concentration suggests potential market saturation, with competitive pressures likely intensifying in these regions.
Top 10 States by Sold Volume
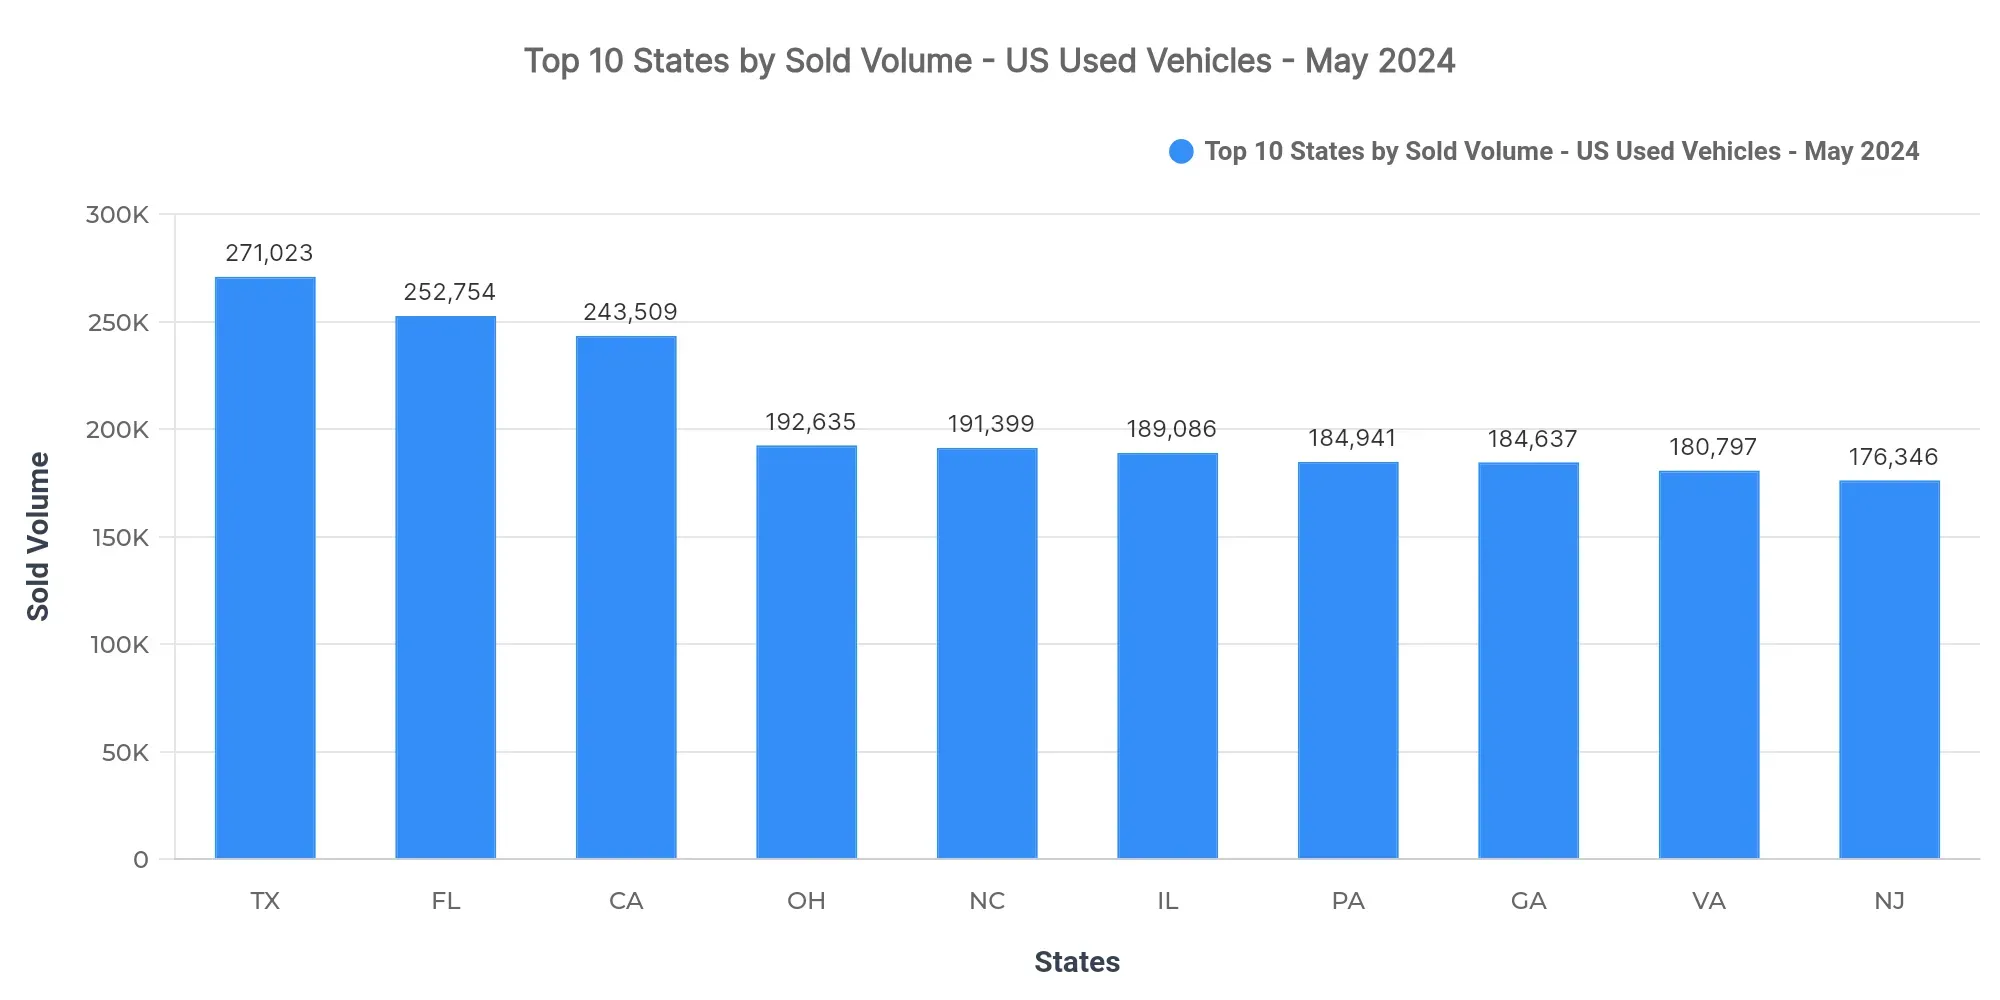
Texas (271,023), Florida (252,754), and California (243,509) lead with substantial sold volumes, jointly accounting for 11.4% of the national sales. The rest of the top 10 includes Ohio, North Carolina, Illinois, Pennsylvania, Georgia, Virginia, and New Jersey, highlighting strong regional demand.
The top states reflect a high market concentration, with a significant share concentrated in these regions, which collectively drive market dynamics. Notably, states like Ohio and North Carolina show robust participation, indicating that the Midwest and Southeast are strong secondary markets.
Price Breakdown: Top 10 States by Sold Volume
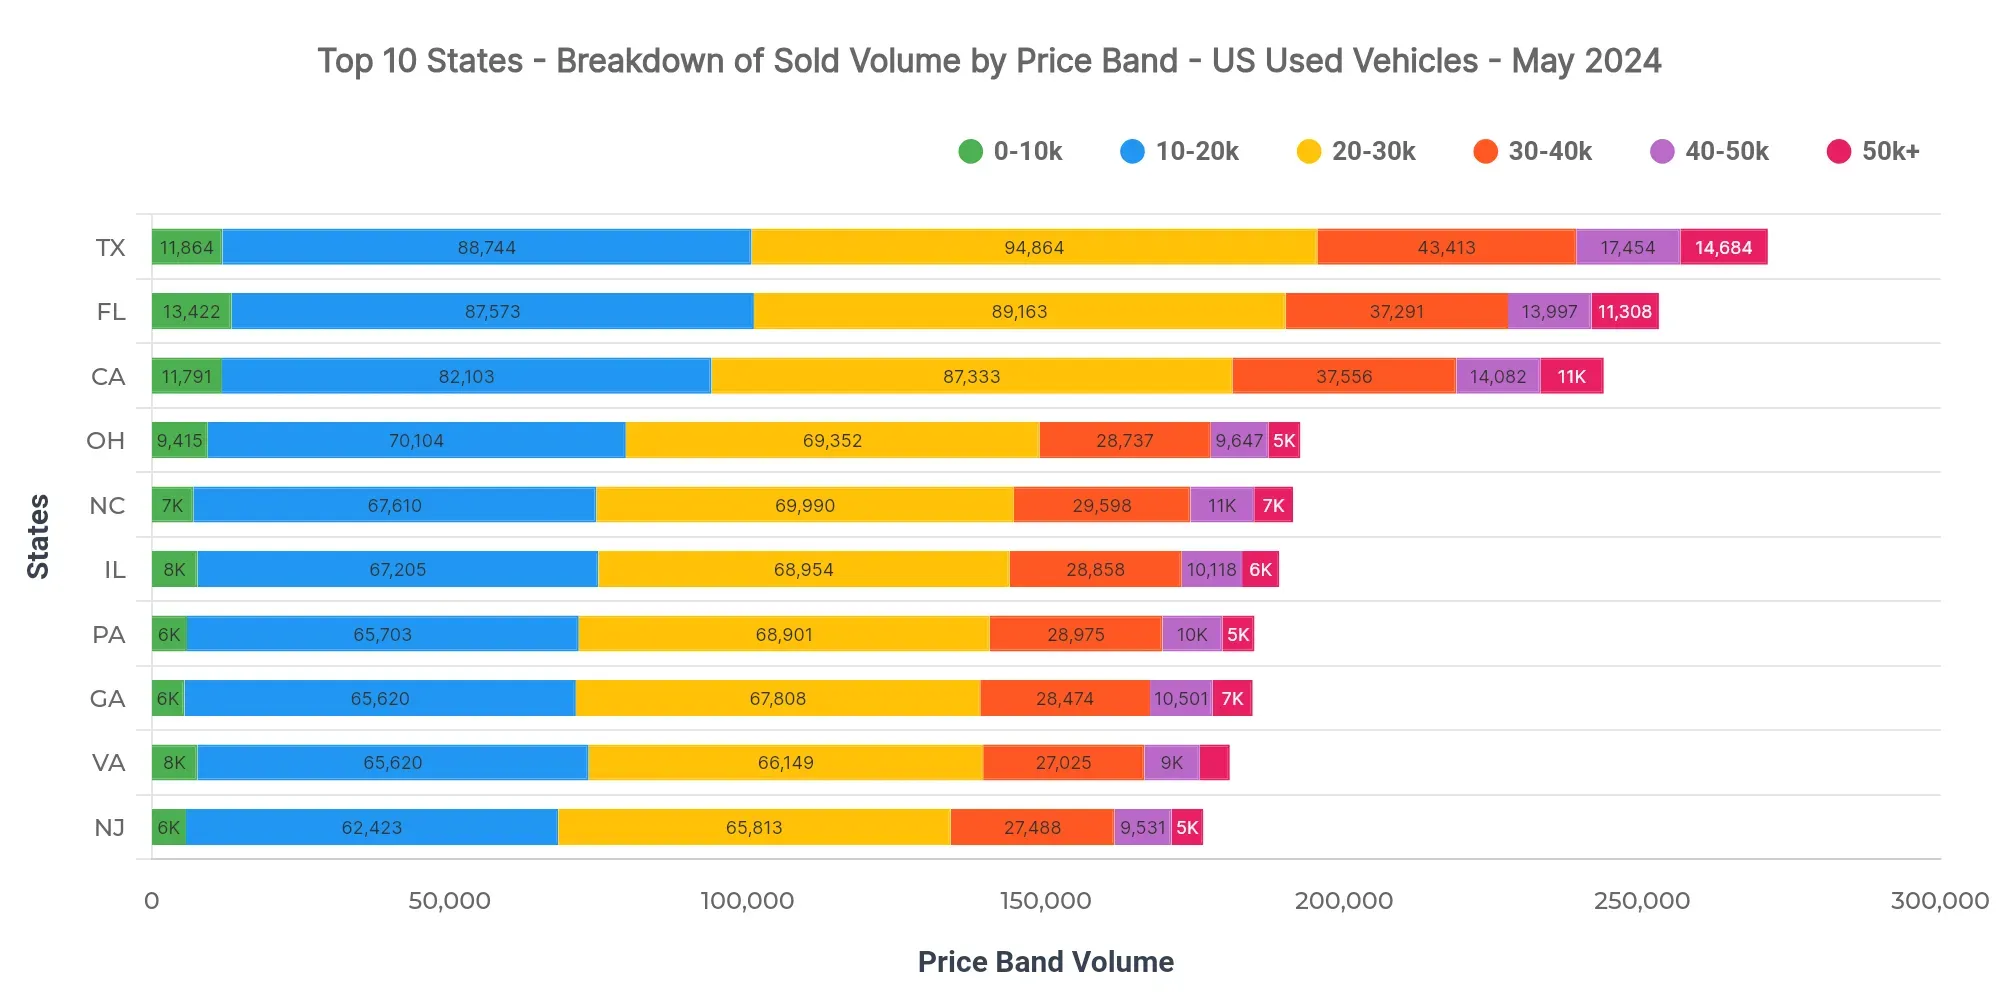
In Texas, the dominant price bands are $20K–$30K (35%), $10K–$20K (32.7%), and $30K–$40K (16%). The $40K–$50K band, with a 6.4% share, suggests a notable upper-price tail. In comparison, Florida shows an average sold price of $25,505, and California at $25,975.
Dealers in Texas should prioritize inventory management around the $10K–$30K range, given their substantial demand. Lending institutions might see opportunities in financing for the $20K–$40K segment, as these are the most active price bands.
Market Breakdown by Fuel Types
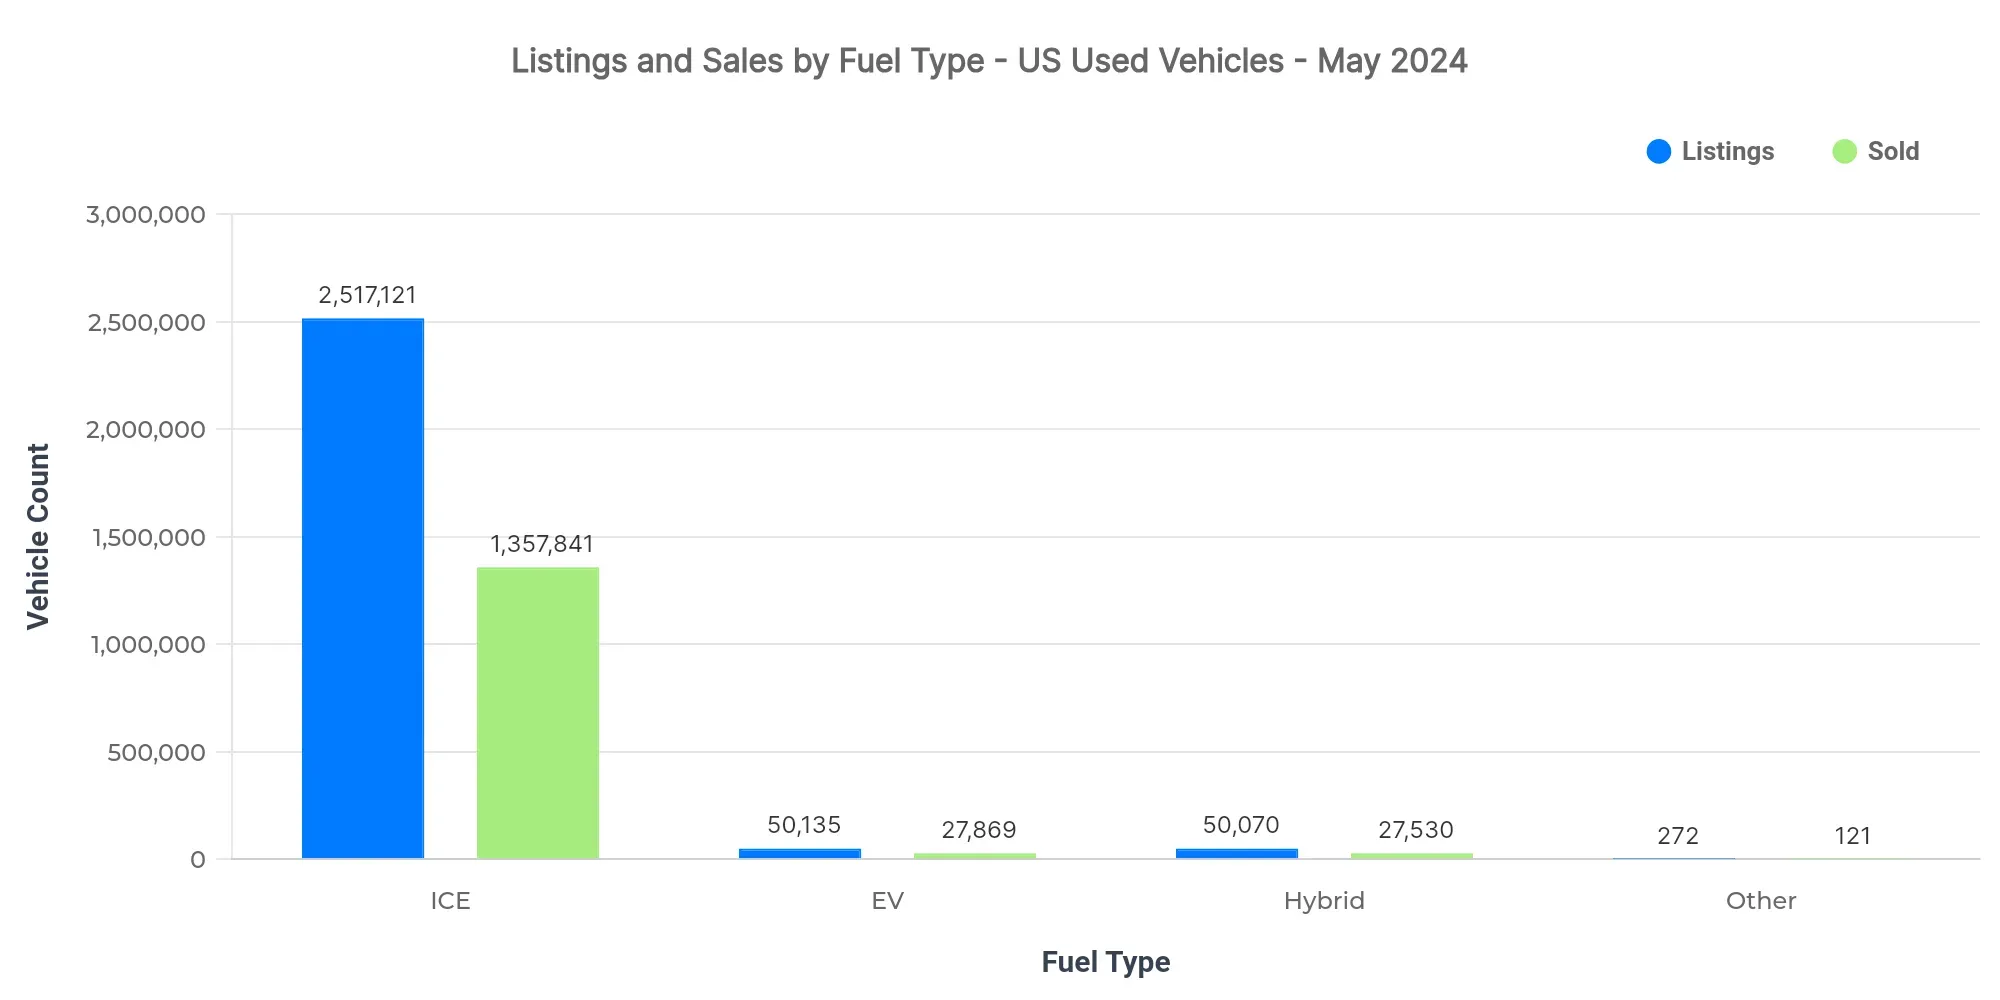
| Fuel Type | Listings Count | Sold Count | Avg Listing Price | Avg Sold Price |
|---|---|---|---|---|
| ICE | 2.52M | 1.36M | $25,683 | $25,316 |
| EV | 50.1K | 27.9K | $31,804 | $30,952 |
| Hybrid | 50.1K | 27.5K | $26,888 | $26,097 |
| Other | 272 | 121 | $16,117 | $15,829 |
- Electric Vehicle (EV) adoption is growing, supported by premium pricing compared to ICE vehicles.
- Hybrid vehicles present a cost-effective alternative, with pricing positioned between ICE and EVs.
- Market dynamics reflect a strong ICE presence, though EVs and hybrids are carving out a notable niche.
Market Share by Body Types
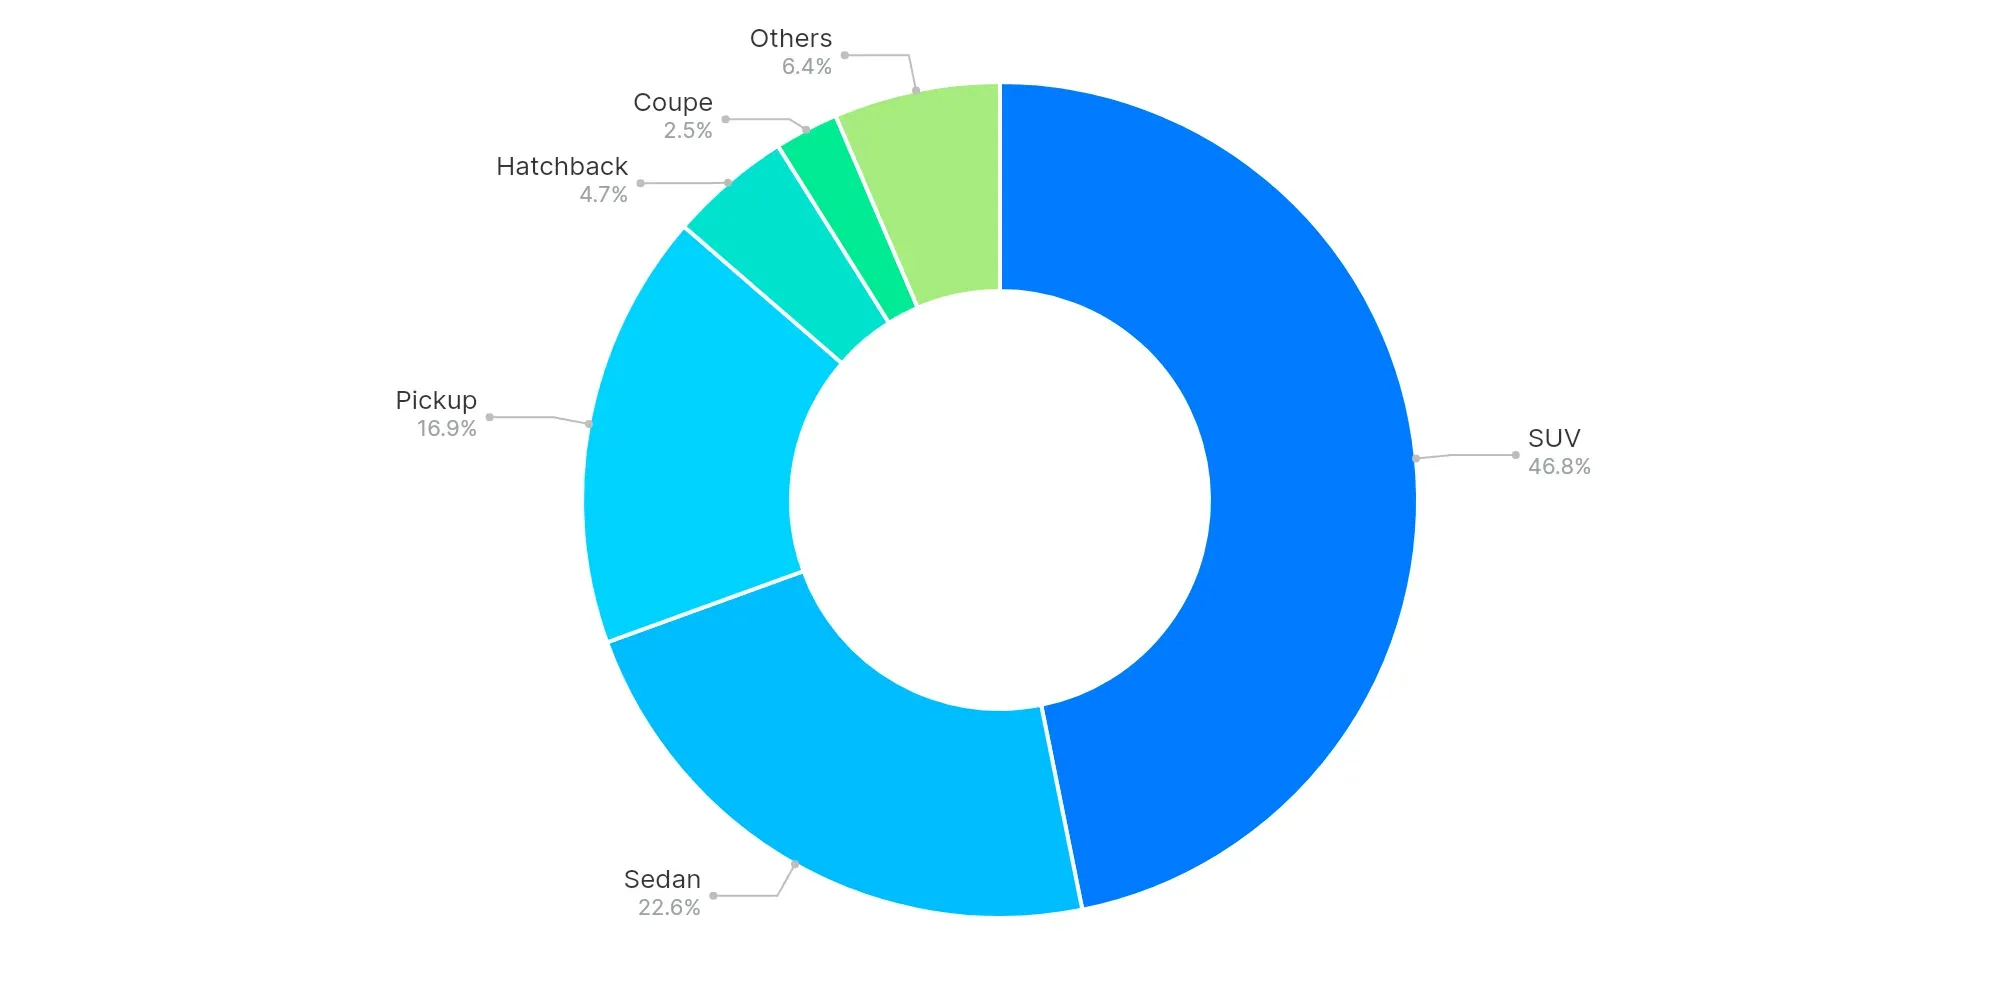
SUVs (46.8%), Sedans (22.6%), and Pickups (16.9%) dominate the body type market share. Larger vehicle segments, such as SUVs and Pickups, show a clear preference among consumers, with a continued trend towards spacious and versatile vehicles.
High-Volume vs Low-Volume States (Executive Insights)
- Top-performing states: Texas, Florida, California
- Underpenetrated regions: Virgin Islands, American Samoa, Northern Mariana Islands
- Key price bands: $10K–$20K, $20K–$30K
- EV trend: Increasing adoption with premium pricing
- Buyer preferences: High demand for larger vehicles like SUVs and Pickups
Overall, the US used car market shows sustained momentum in high-volume states, driven primarily by robust dealership networks and targeted pricing strategies. Dealers should leverage these insights to align inventory and marketing strategies with prevailing consumer preferences and regional demand patterns.