

US Monthly Used Car Market Data – March 2026
This report examines the US used vehicle market in March 2026, focusing on key components such as dealership activity, sales volume, pricing dynamics, fuel types, body type distribution, and regional performance. The analysis is supported by current datasets detailing these elements.
Number of Dealerships by State
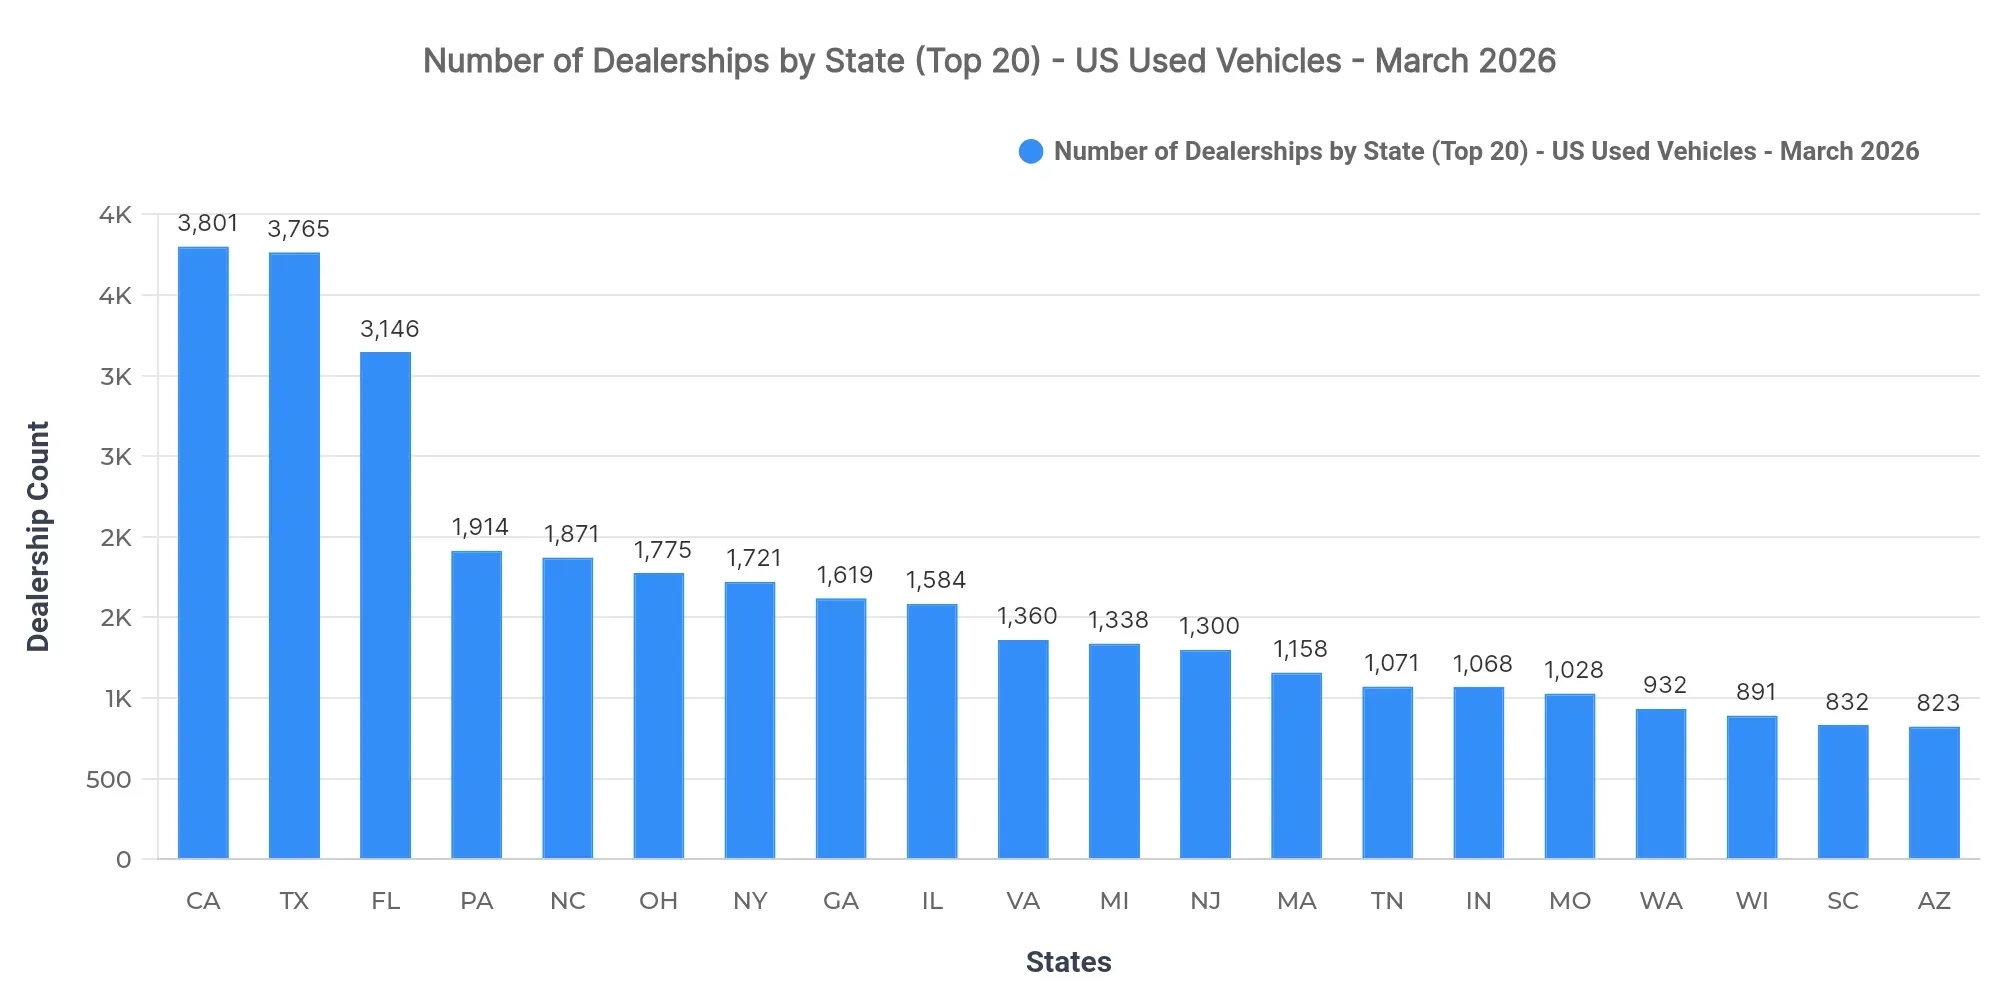
California (3,801), Texas (3,765), and Florida (3,146) lead in the number of dealerships, suggesting these states have a particularly robust dealer network contributing to extensive market access. The concentration of dealerships in these states indicates potential saturation, emphasizing the necessity for dealers in other regions to identify niche opportunities for growth.
Top 10 States by Sold Volume
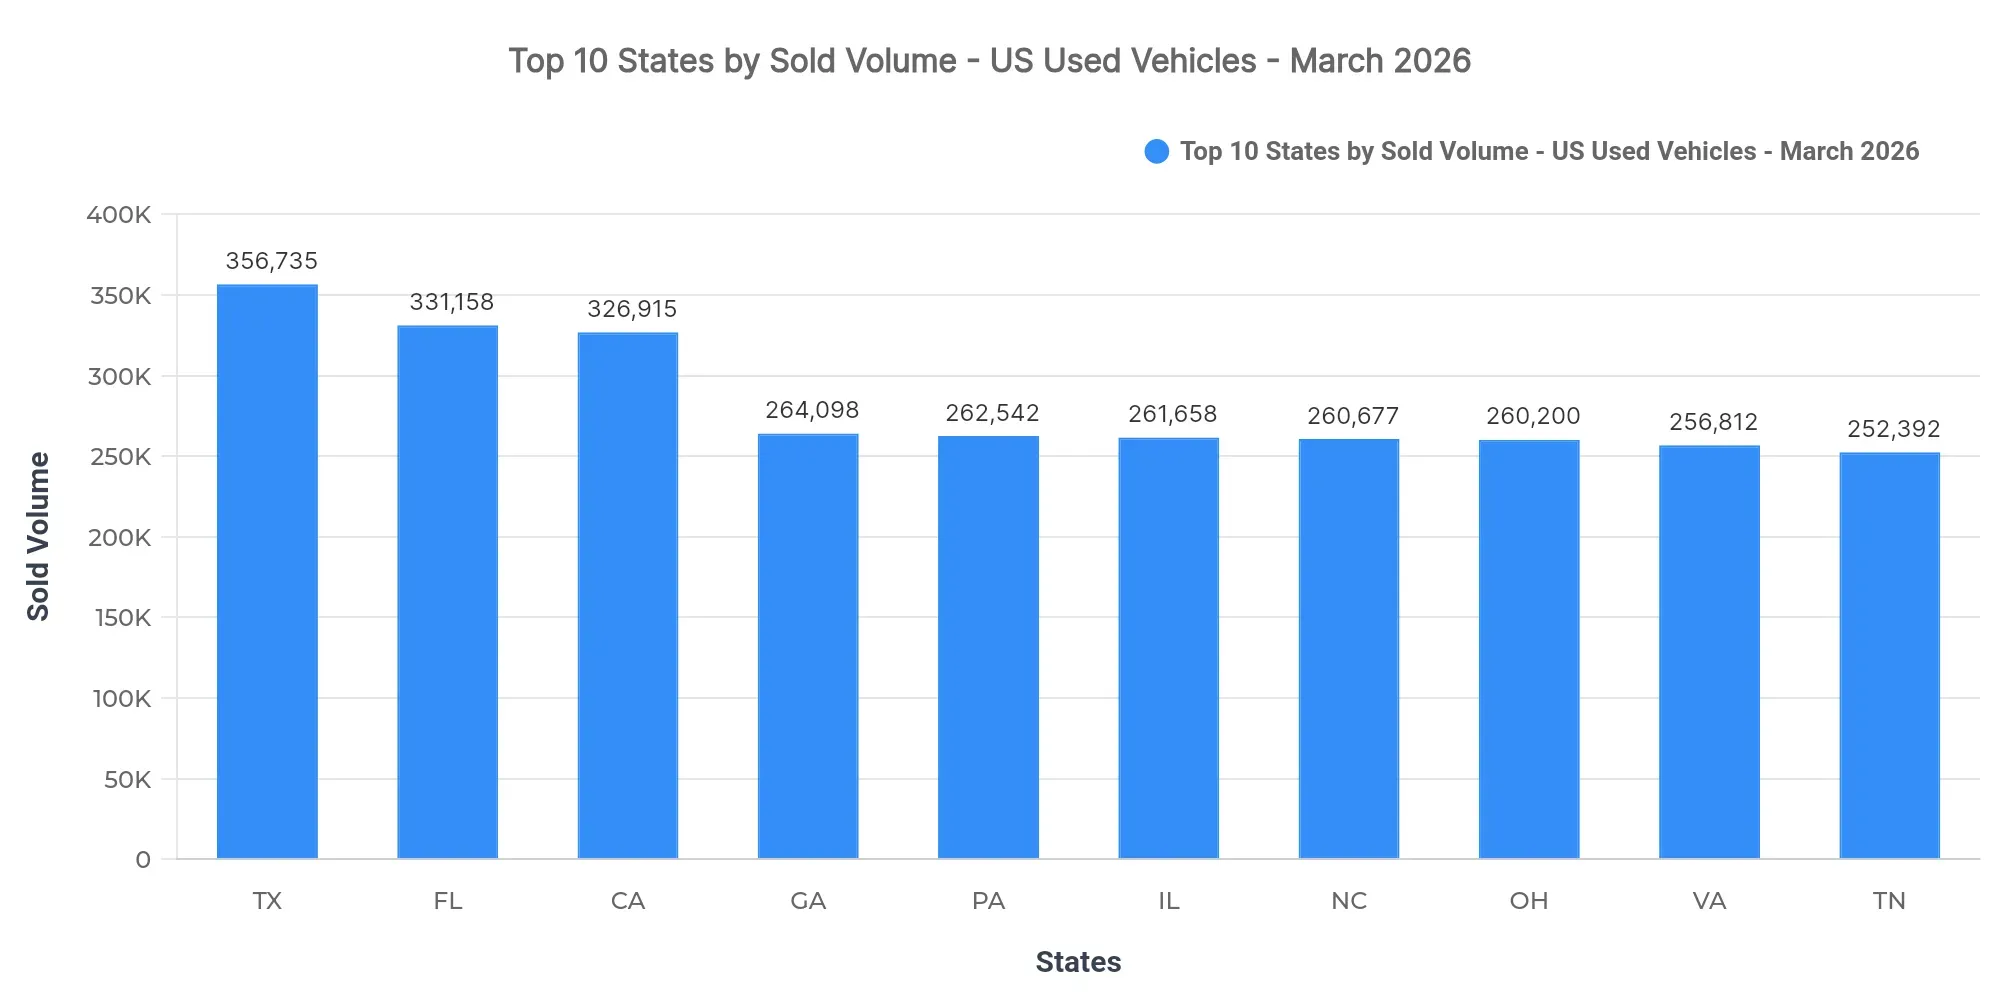
Texas (356,735), Florida (331,158), and California (326,915) lead in sold volume, collectively contributing 10.8% of the national sold volume. Other top-performing states include Georgia, Pennsylvania, Illinois, North Carolina, Ohio, Virginia, and Tennessee. The dominance of these states highlights strong consumer demand and the importance of maintaining inventory diversity to cater to their large customer bases.
Market concentration in these top few states suggests a reliance on key metropolitan areas. Conversely, regional demand patterns indicate varying buyer preferences that underline the strategic importance of localized market adaptations across states.
Price Breakdown: Top 10 States by Sold Volume
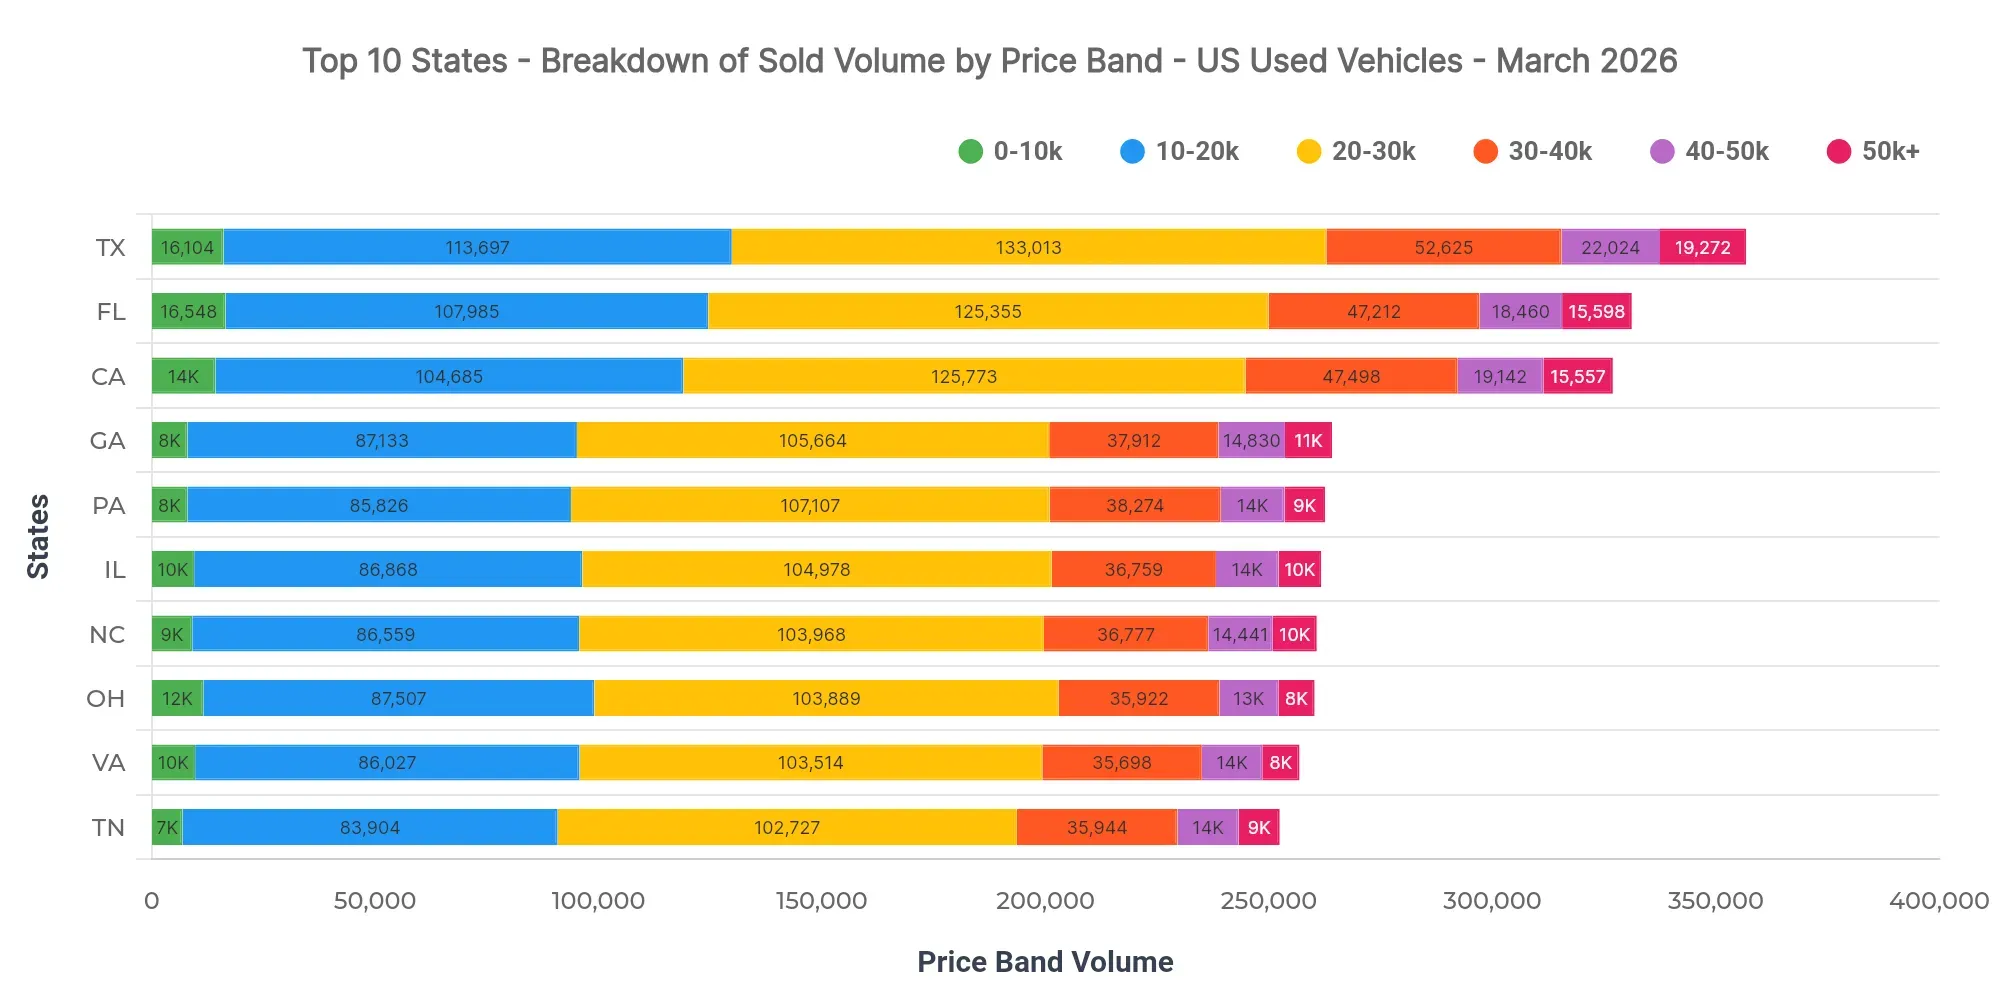
In Texas, the dominant price bands are $20K–$30K (37.3%), $10K–$20K (31.9%), and $30K–$40K (14.8%). Notably, vehicles priced $40K–$50K make up 6.2%, indicating an upper-price tail for higher-end models. Florida at $25,632 and California at $26,044 illustrate slightly higher average sold prices compared to Texas.
Dealers should emphasize maintaining a variety of inventory within these dominant price ranges to capitalize on buyer interest. Pricing strategies must consider regional economic conditions, especially for financing terms sensitive to these price bands.
Market Breakdown by Fuel Types
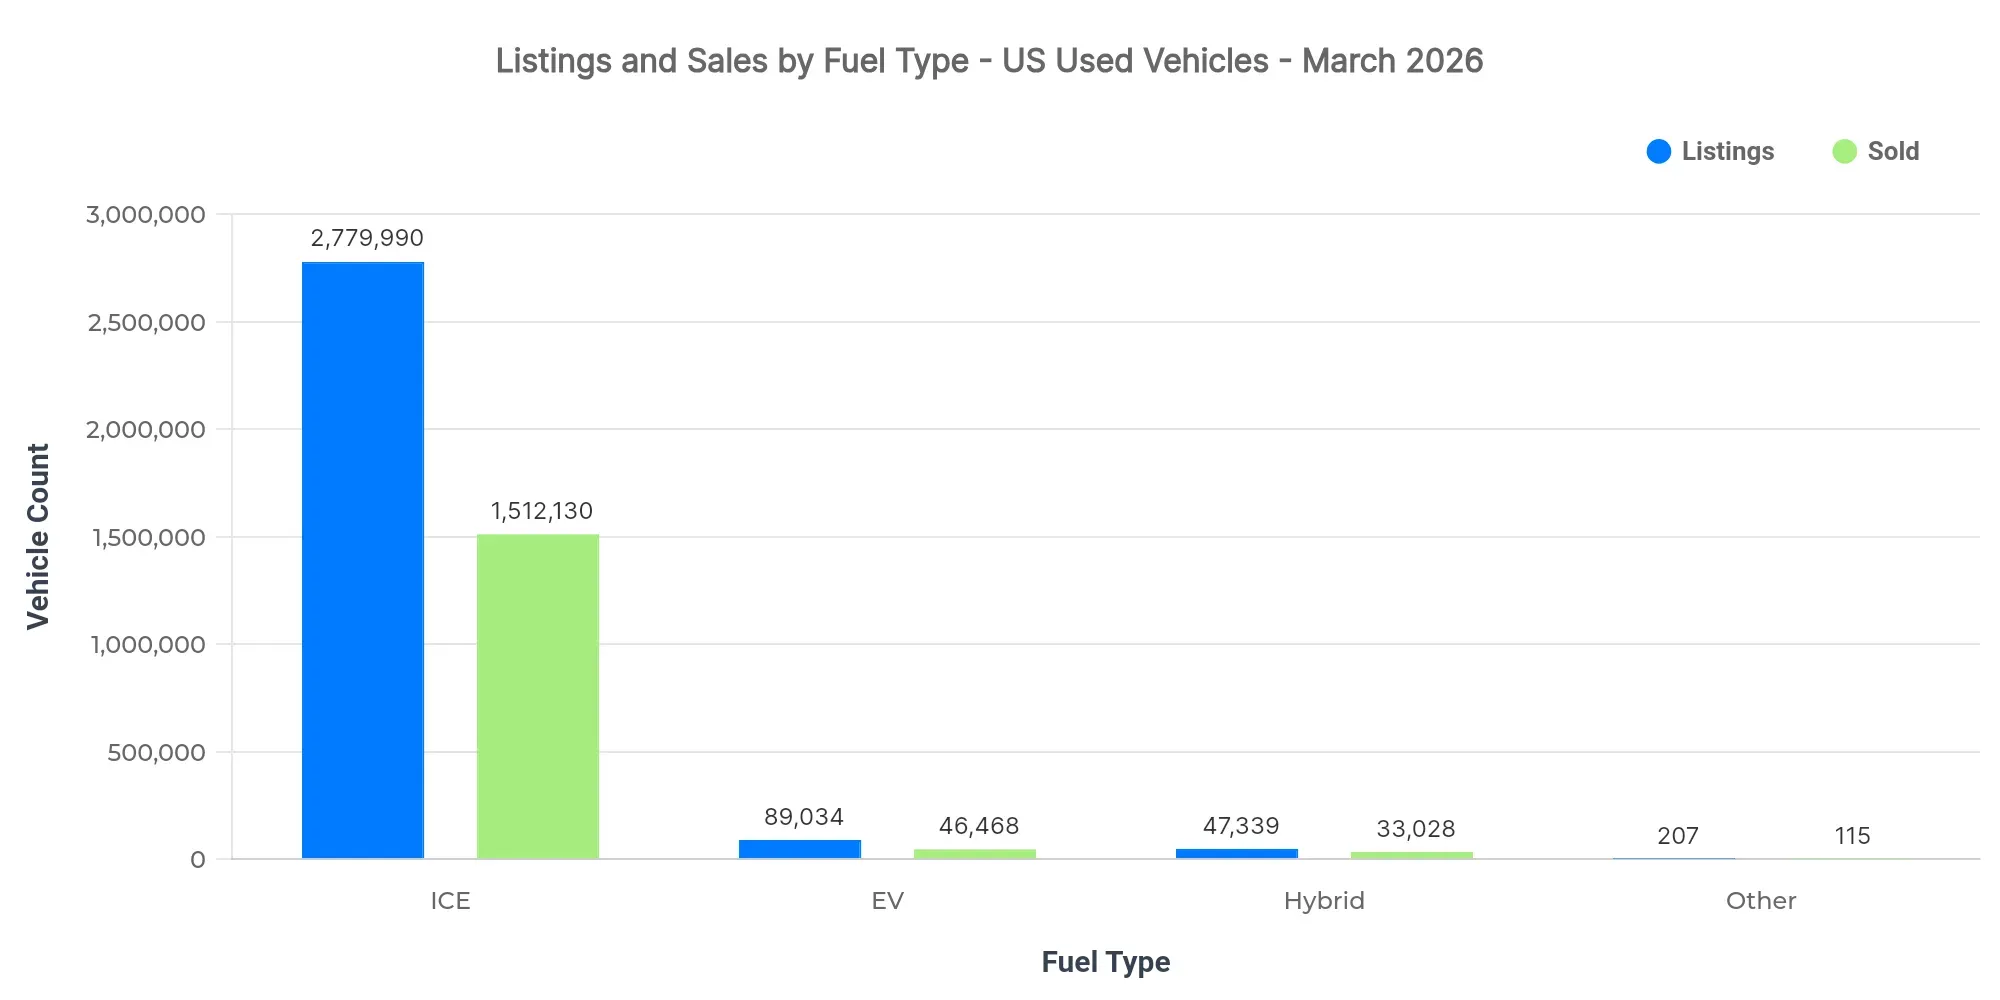
| Fuel Type | Listings Count | Sold Count | Avg Listing Price | Avg Sold Price |
|---|---|---|---|---|
| ICE | 2.78M | 1.51M | $24,076 | $25,519 |
| EV | 89.0K | 46.5K | $33,429 | $30,991 |
| Hybrid | 47.3K | 33.0K | $27,170 | $26,343 |
| Other | 207 | 115 | $10,989 | $10,688 |
- Rising interest in electric vehicles (EVs) is evident despite higher average listing prices, underscoring growing EV adoption.
- Internal Combustion Engine (ICE) vehicles continue to dominate the market by volume, maintaining relevance across price segments.
- Market dynamics indicate shifting consumer preferences towards hybrids and EVs, which could adjust supply strategies.
Market Share by Body Types
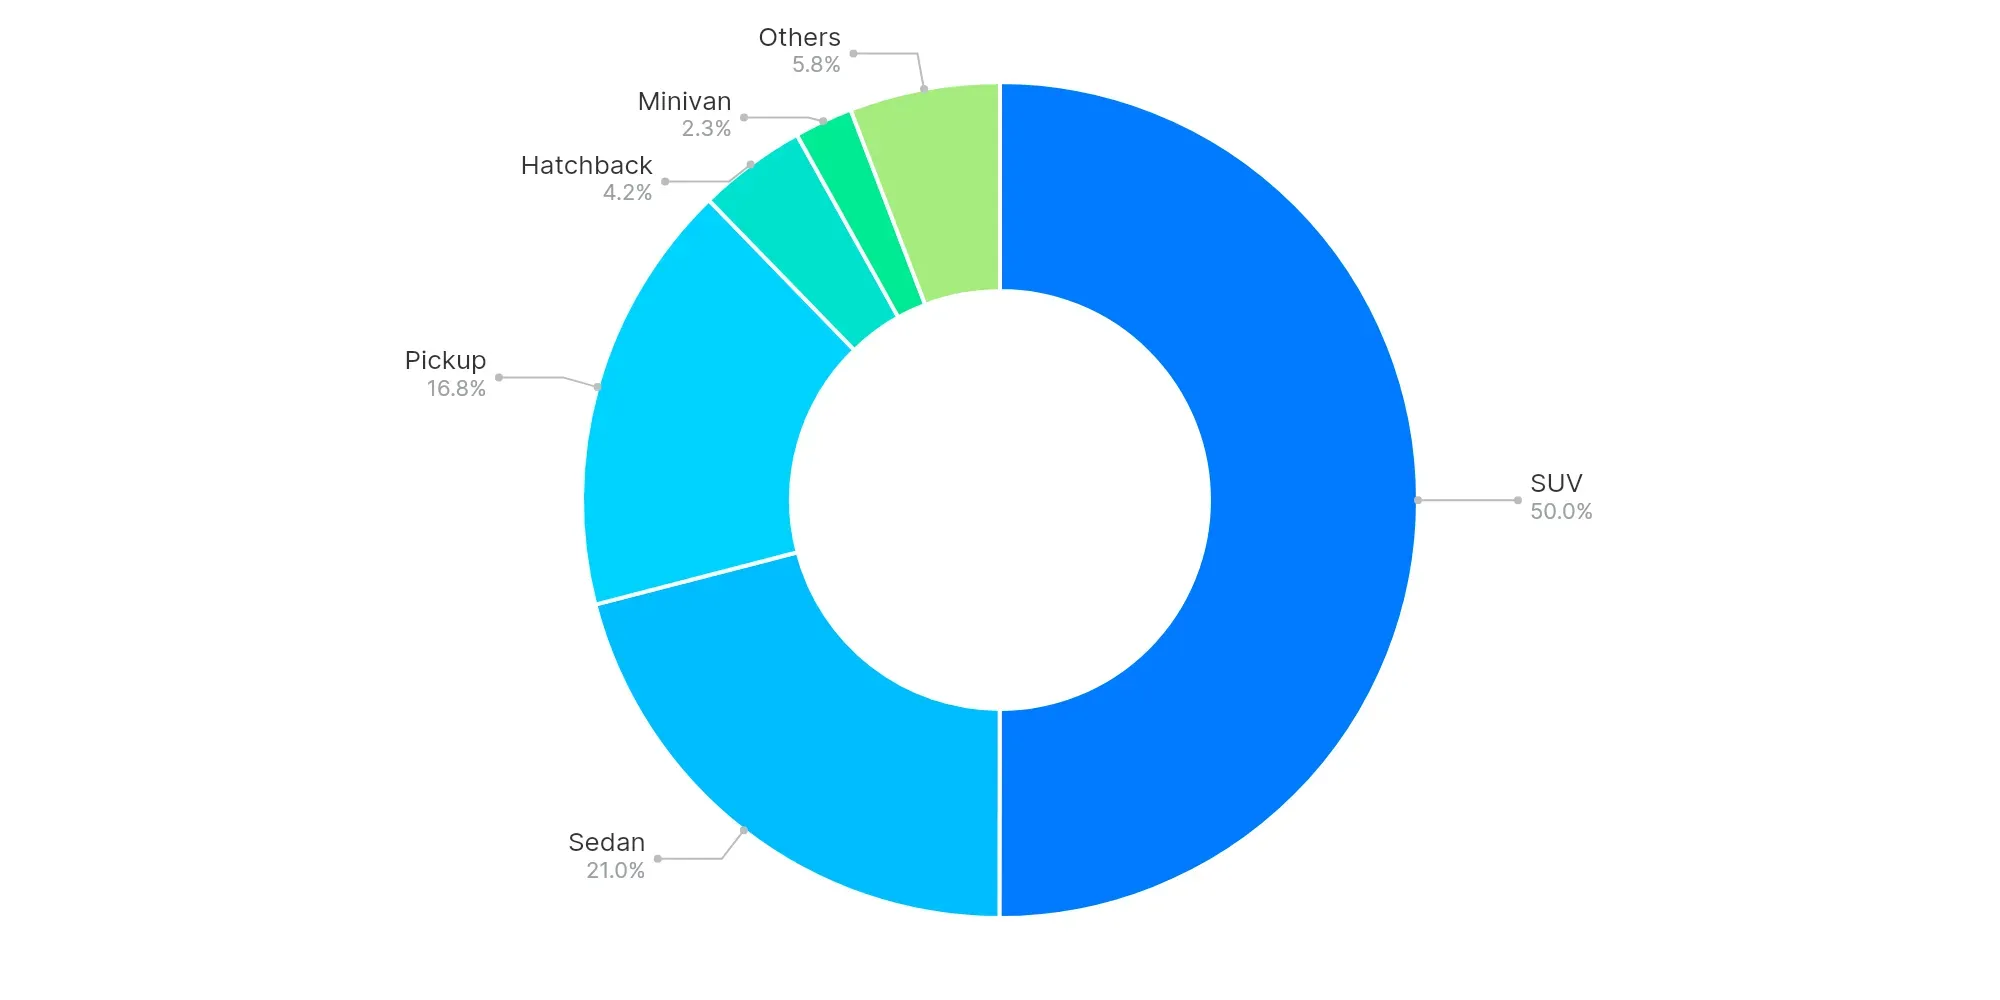
SUVs (50.0%), Sedans (21.0%), and Pickups (16.8%) are the leading body types in the market. The strong presence of SUVs and Pickups highlights the consumer trend toward larger vehicles, emphasizing durability and versatility. Additionally, consumer preferences are shifting towards multifunctional vehicles, indicating potential areas for inventory adjustments to meet these demands.
High-Volume vs Low-Volume States (Executive Insights)
- Top-performing states: Texas, Florida, California
- Underpenetrated regions: Virgin Islands, American Samoa, Northern Mariana Islands
- Key price bands: $10K–$20K, $20K–$30K
- EV trend: Growing adoption across markets
- Buyer preferences: Shift towards SUVs and EV integration
The March 2026 dataset highlights dynamic market trends and provides actionable insights, emphasizing the need for strategic inventory management and targeted marketing in high-demand regions. Dealers and analysts should use these findings to fine-tune strategies and exploit emerging market opportunities.