

US Monthly Used Car Market Data – March 2025
This report provides insights into the US used car market in March 2025, focusing on dealership activity, sales volume, pricing trends, fuel and body type preferences, and regional performance across the country. The analysis draws on the most current data for each of these segments to highlight trends and implications for market stakeholders.
Number of Dealerships by State
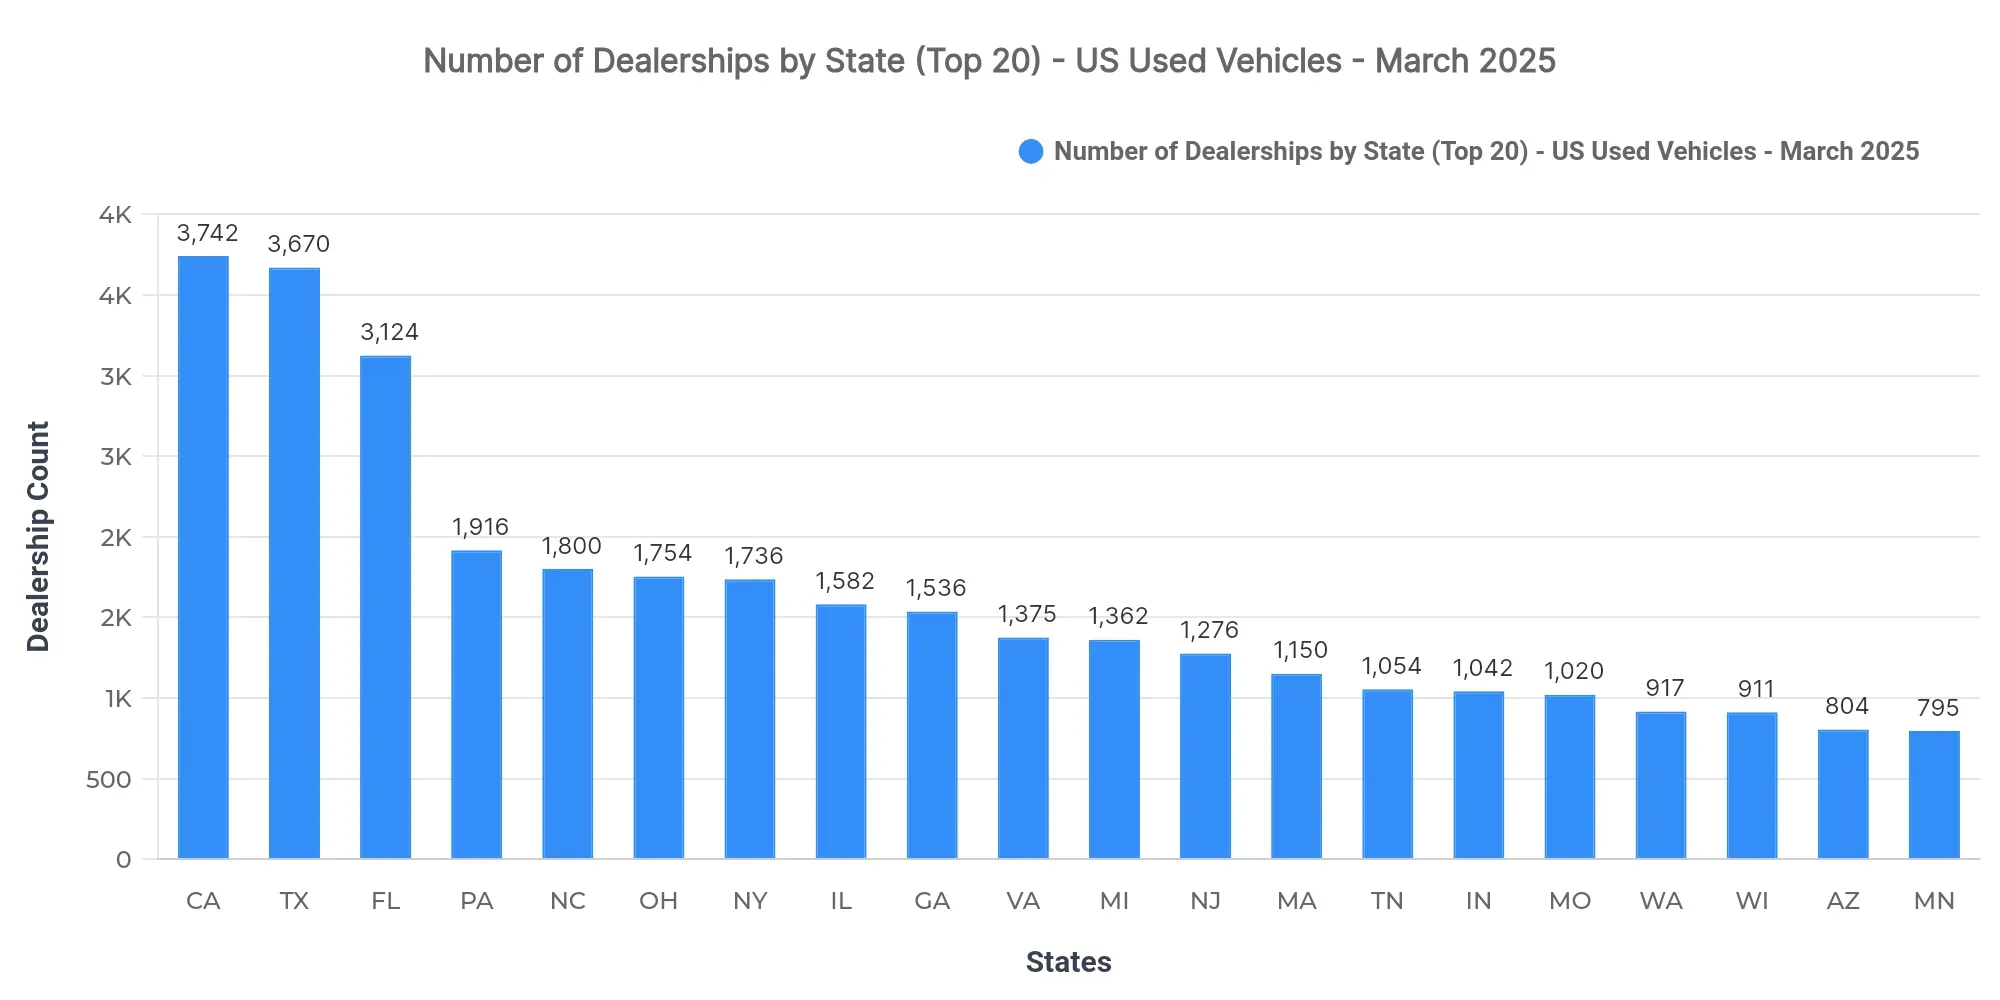
California (3,742), Texas (3,670), and Florida (3,124) lead in the number of dealerships. This widespread dealer network in these top states indicates a saturated market with high competition levels, suggesting mature markets that could pressure margins as dealers vie for share.
Top 10 States by Sold Volume
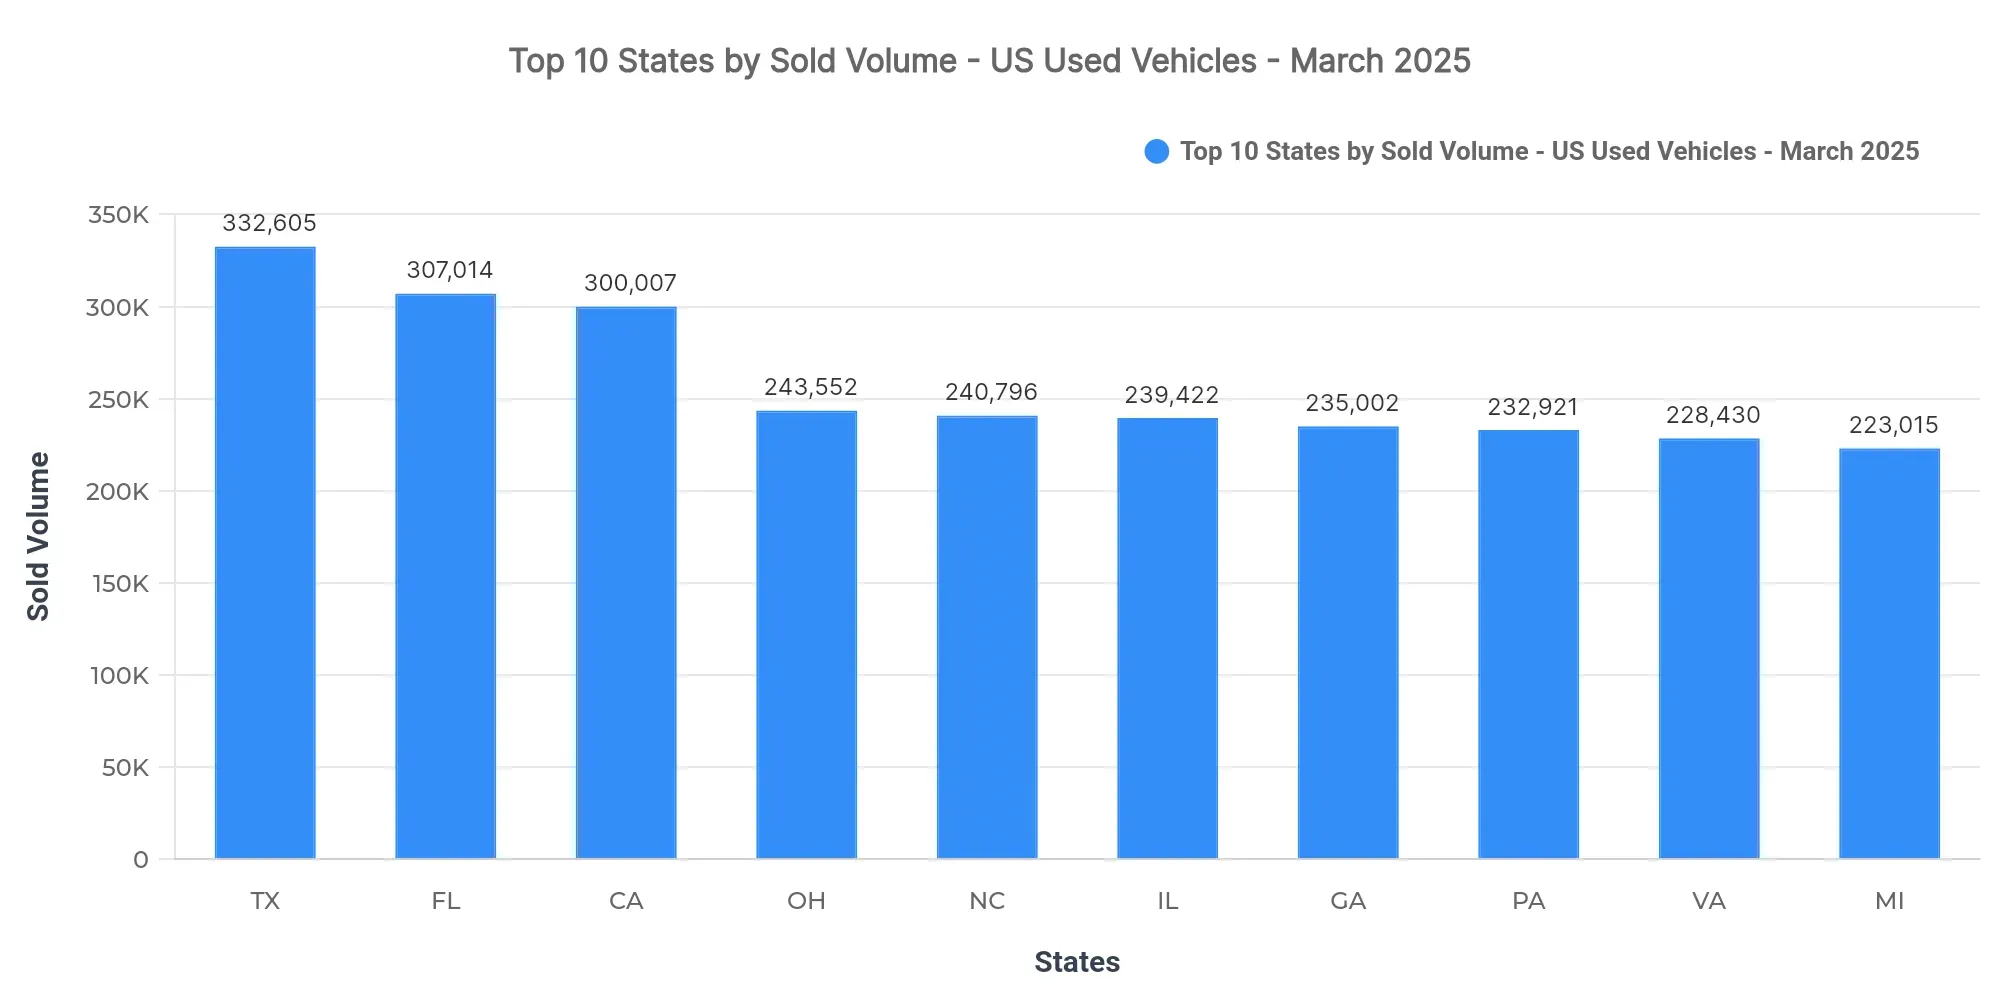
Texas (332,605), Florida (307,014), and California (300,007) lead in sales volume, collectively contributing to 11.2% of the national sold volume. The remaining top-10 states by volume include Ohio, North Carolina, Illinois, Georgia, Pennsylvania, Virginia, and Michigan. The high concentration of sales in these states underlines their role as pivotal markets, driving overall national performance.
A significant concentration is seen in Texas, Florida, and California, suggesting targeted marketing and logistical strategies could enhance market penetration. Meanwhile, regional demand patterns remain robust in established automotive hubs like the Midwest and Southeast, indicative of traditional preference trends.
Price Breakdown: Top 10 States by Sold Volume
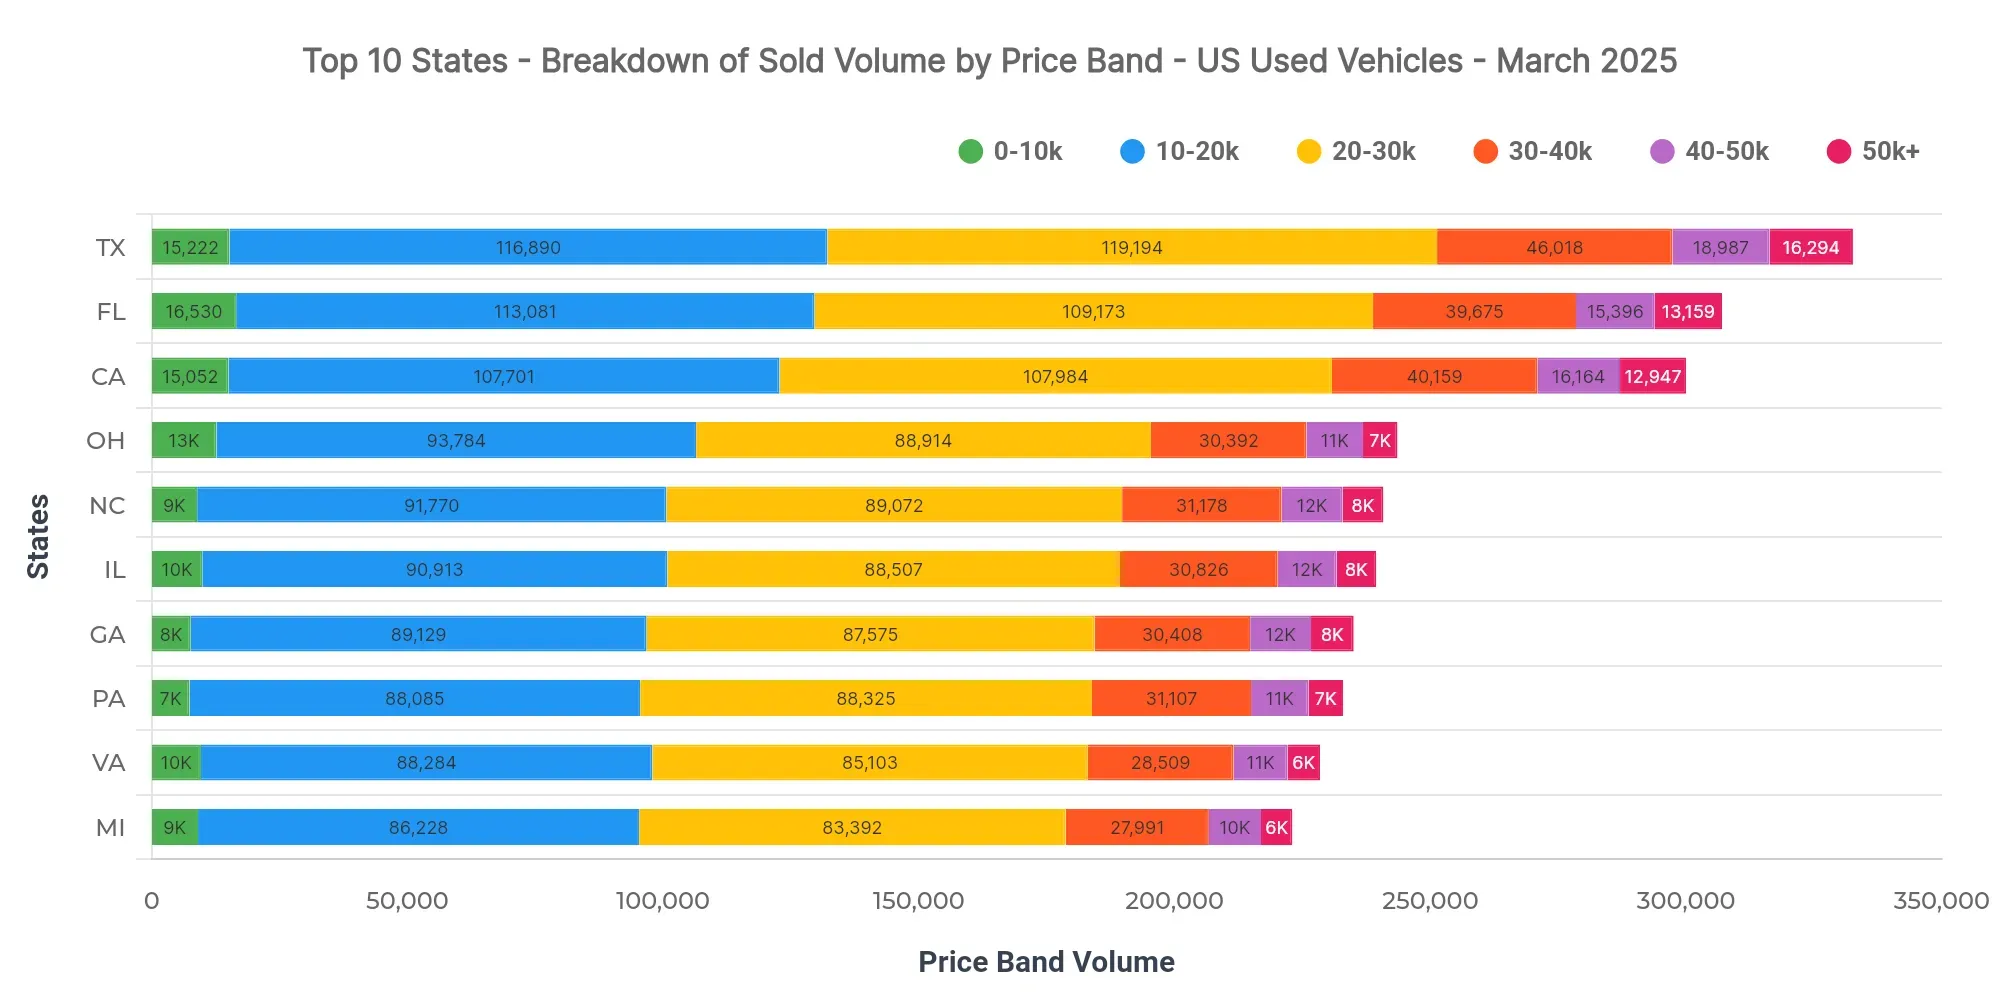
In Texas, dominant price bands include $20K–$30K (35.8%) and $10K–$20K (35.1%). The $30K–$40K segment also captures a notable share with 13.8%. A minor presence is noted in the $40K–$50K range at 5.7%. Comparatively, Florida prices average $24,808, and California at $25,316.
For dealers, aligning inventory with dominant price bands can optimize turnover rates in Texas. Pricing strategies in lending should accommodate lower average sold prices in prominent states, reflecting consumer purchasing capacities.
Market Breakdown by Fuel Types
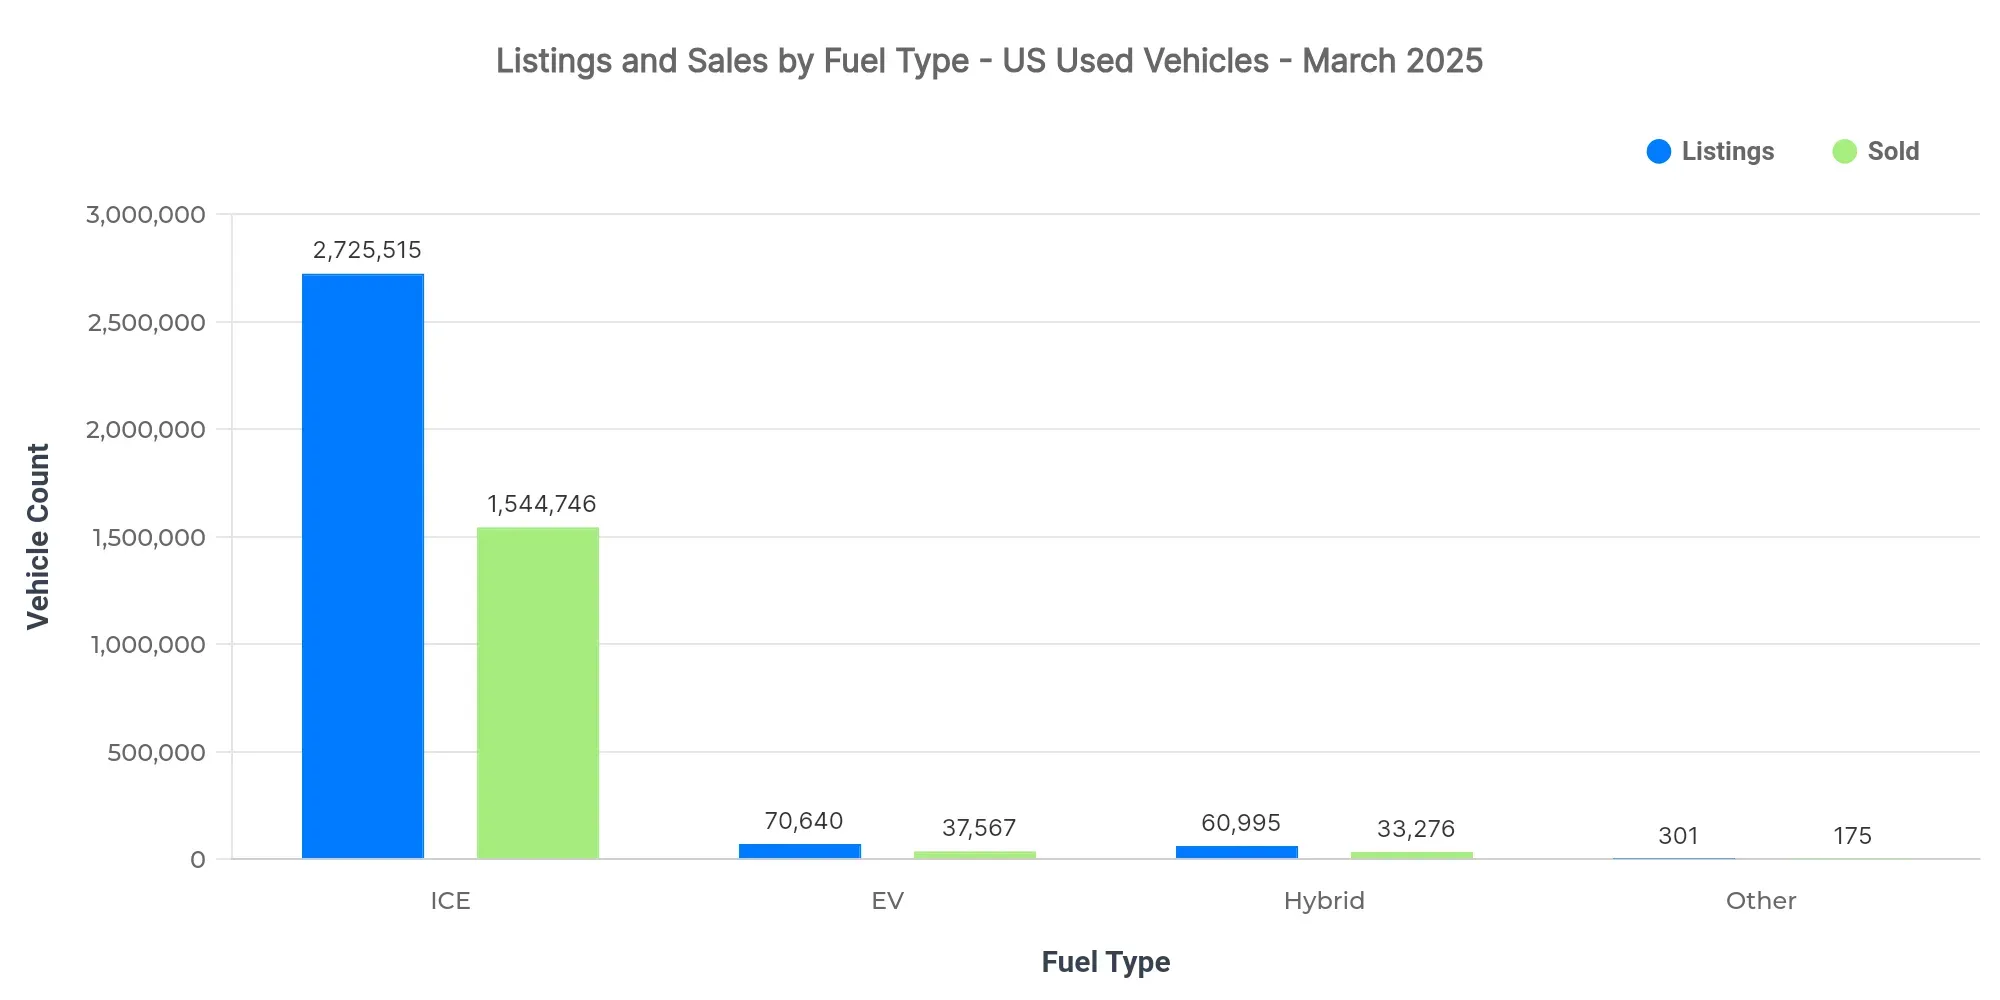
| Fuel Type | Listings Count | Sold Count | Avg Listing Price | Avg Sold Price |
|---|---|---|---|---|
| ICE | 2.73M | 1.54M | $25,532 | $24,668 |
| EV | 70.64K | 37.57K | $33,874 | $30,901 |
| Hybrid | 60.99K | 33.28K | $26,354 | $25,747 |
| Other | 301 | 175 | $14,734 | $14,475 |
Internal combustion engines dominate sales and listings; however, EVs maintain a premium price point, reflecting their growing segment value. Hybrid vehicles offer a competitive middle ground based on pricing dynamics.
- EV adoption is gaining momentum but remains secondary to ICE vehicles.
- Price positioning indicates market adaptation opportunities, especially for hybrids.
- Market dynamics could shift with regulatory and pricing pressures on ICE units.
Market Share by Body Types
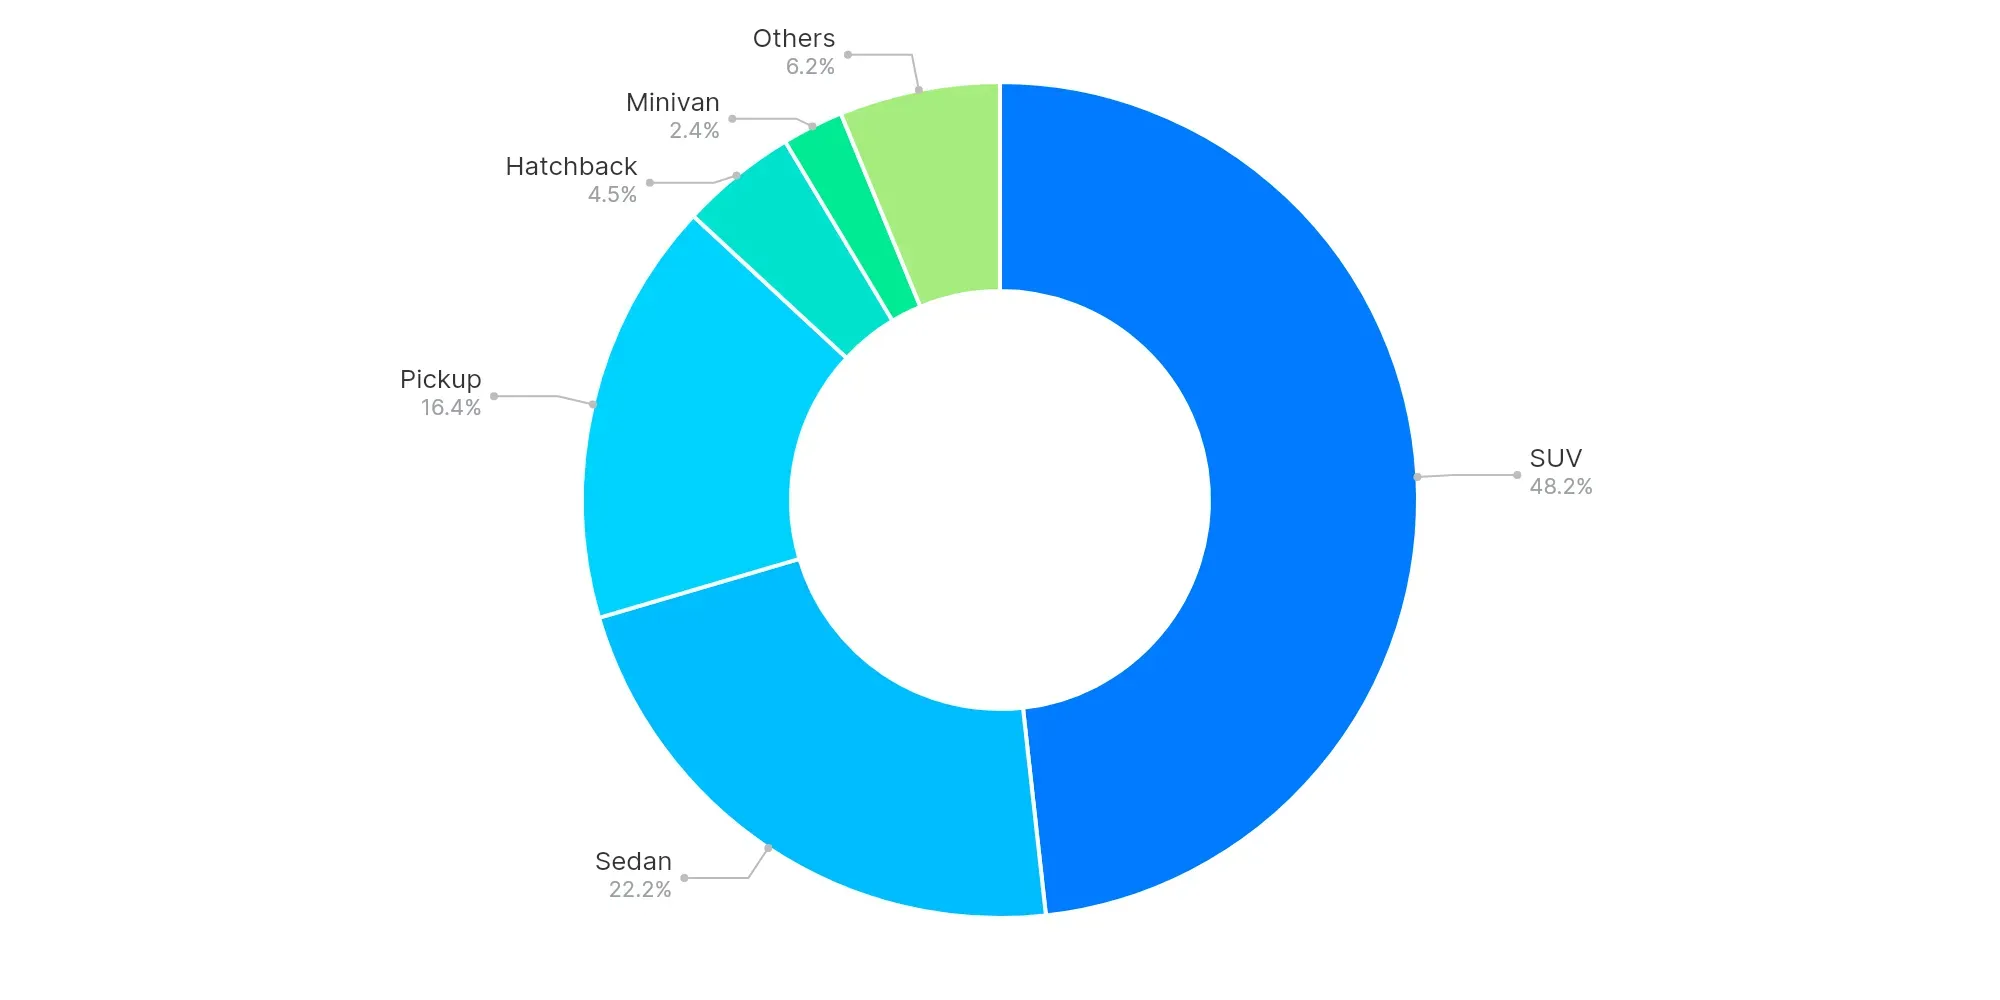
SUV (48.2%), Sedan (22.2%), and Pickup (16.4%) show strong shares. SUVs and Pickups categorize as larger-vehicle segments, showing consumer preference for more versatile and capacious models. The trend suggests a continued lean toward utility and versatility in consumer choices.
High-Volume vs Low-Volume States (Executive Insights)
- Top-performing states: Texas, Florida, California
- Underpenetrated regions: Virgin Islands, Northern Mariana Islands, American Samoa
- Key price bands: $20K–$30K, $10K–$20K
- EV trend: Gradual growth with premium pricing
- Buyer preferences: Lean towards SUVs and Pickups for ability and capacity
Current market analysis indicates robust dealer activity in major states with competitive pressures shaping regional strategies. Insightful actions for dealers include adjusting inventory in line with dominant trends and considering pricing strategies that reflect regional economic conditions and vehicle preferences. For analysts, understanding these patterns allows for nuanced projections of market activity, guiding future decision-making and resource allocation.