

US Monthly Used Car Market Data – March 2024
This report evaluates key metrics in the U.S. used car market for March 2024, focusing on dealership activity, sales volume, pricing trends, the prevalence of different fuel and body types, and regional performance.
Number of Dealerships by State
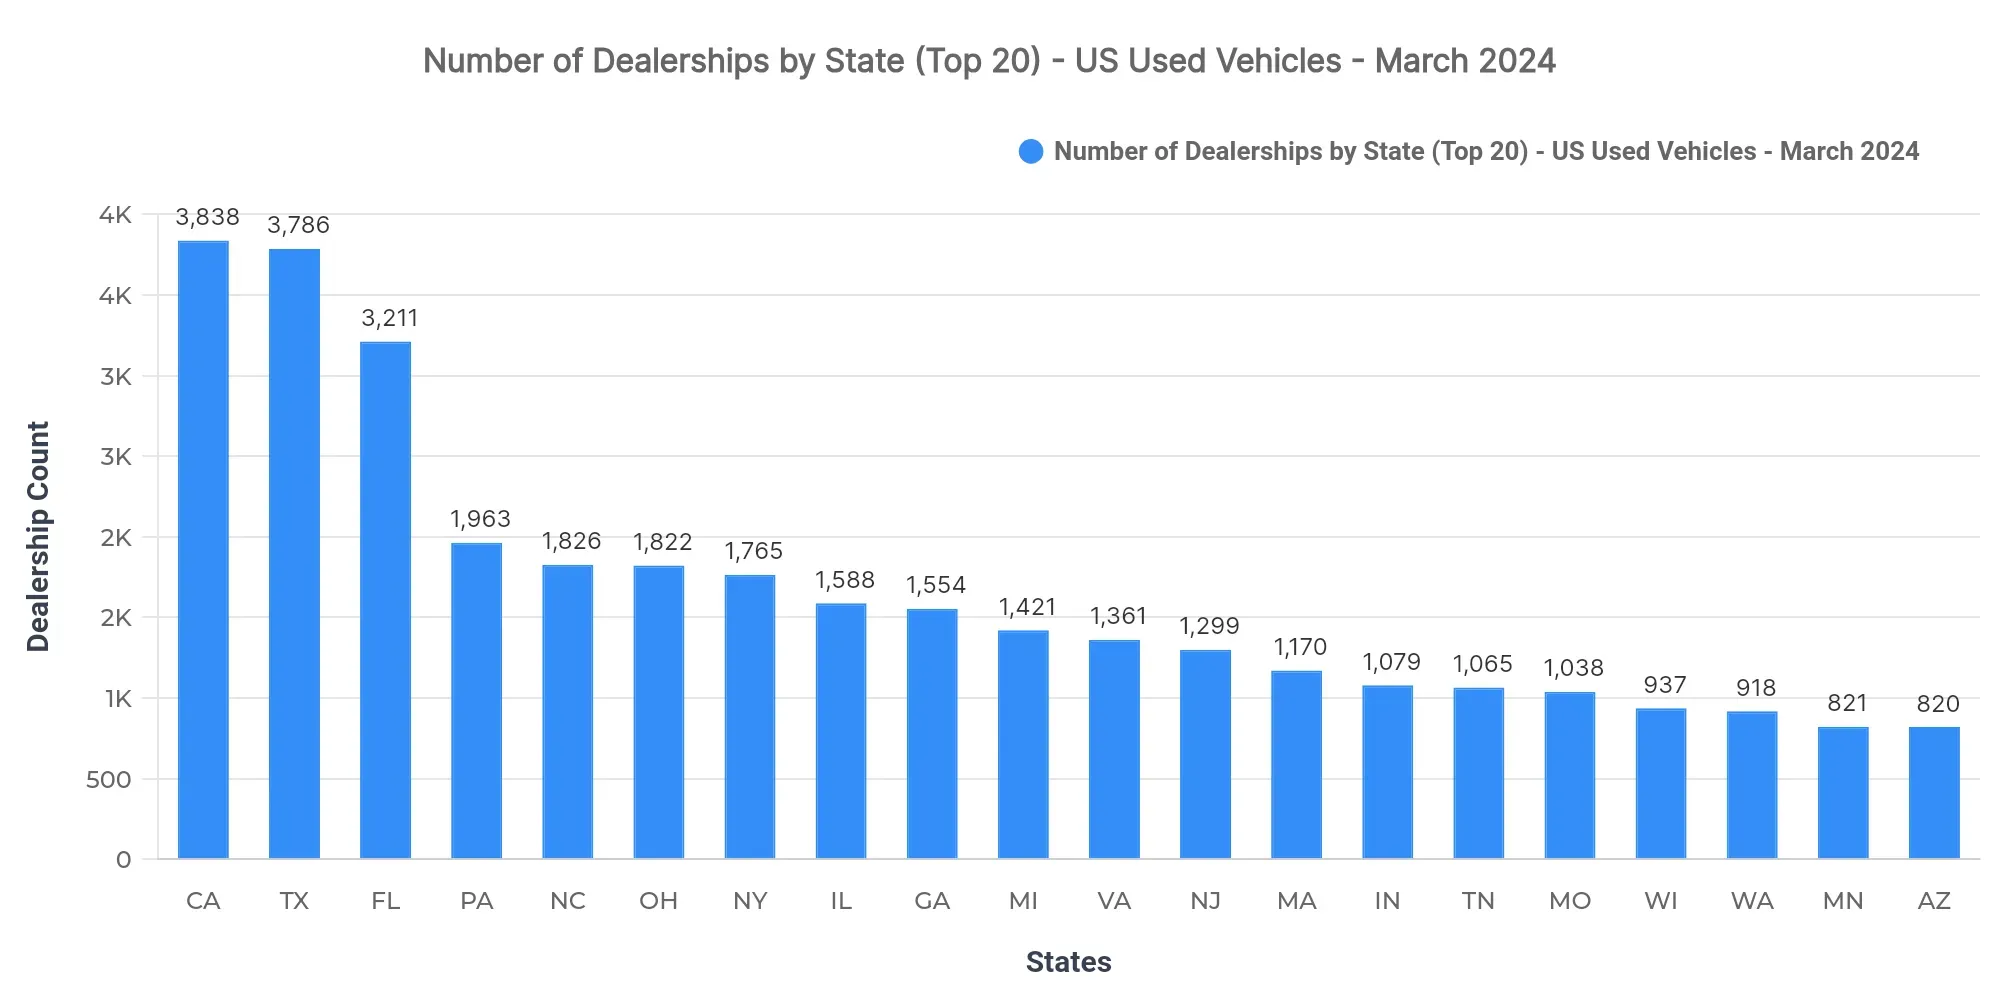
California (3,838), Texas (3,786), and Florida (3,211) lead in dealership numbers, reflecting a strong market presence. The concentration of dealerships in these states suggests a highly competitive and saturated market where maintaining differentiation is crucial.
Top 10 States by Sold Volume
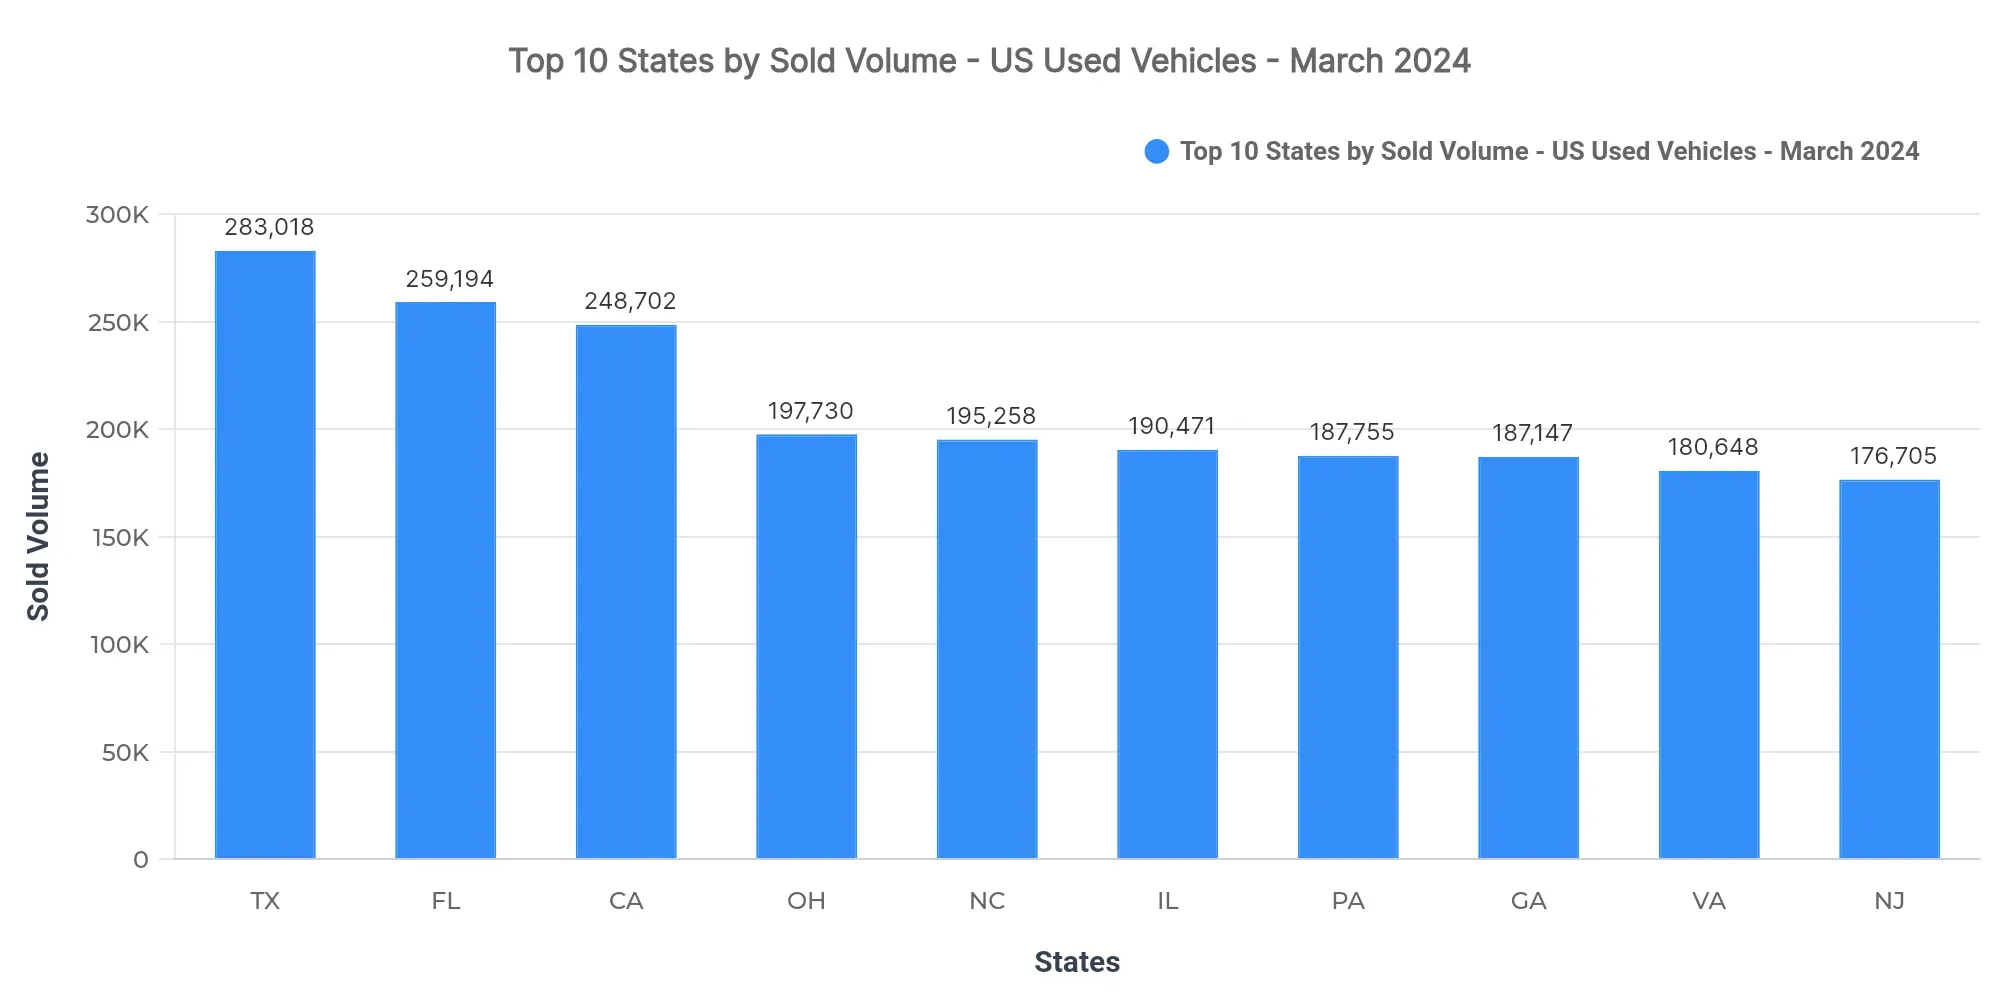
Texas (283,018), Florida (259,194), and California (248,702) lead in sold volume, together accounting for 11.7% of the national market. The remaining top-10 states include Ohio, North Carolina, Illinois, Pennsylvania, Georgia, Virginia, and New Jersey.
The dominance of Texas, Florida, and California indicates a concentrated demand in these regions, suggesting potential economies of scale for delivery and logistics. Regional patterns show significant demand spread across the Midwest and Southeast, reflecting economic activity and vehicular needs in these areas.
Price Breakdown: Top 10 States by Sold Volume
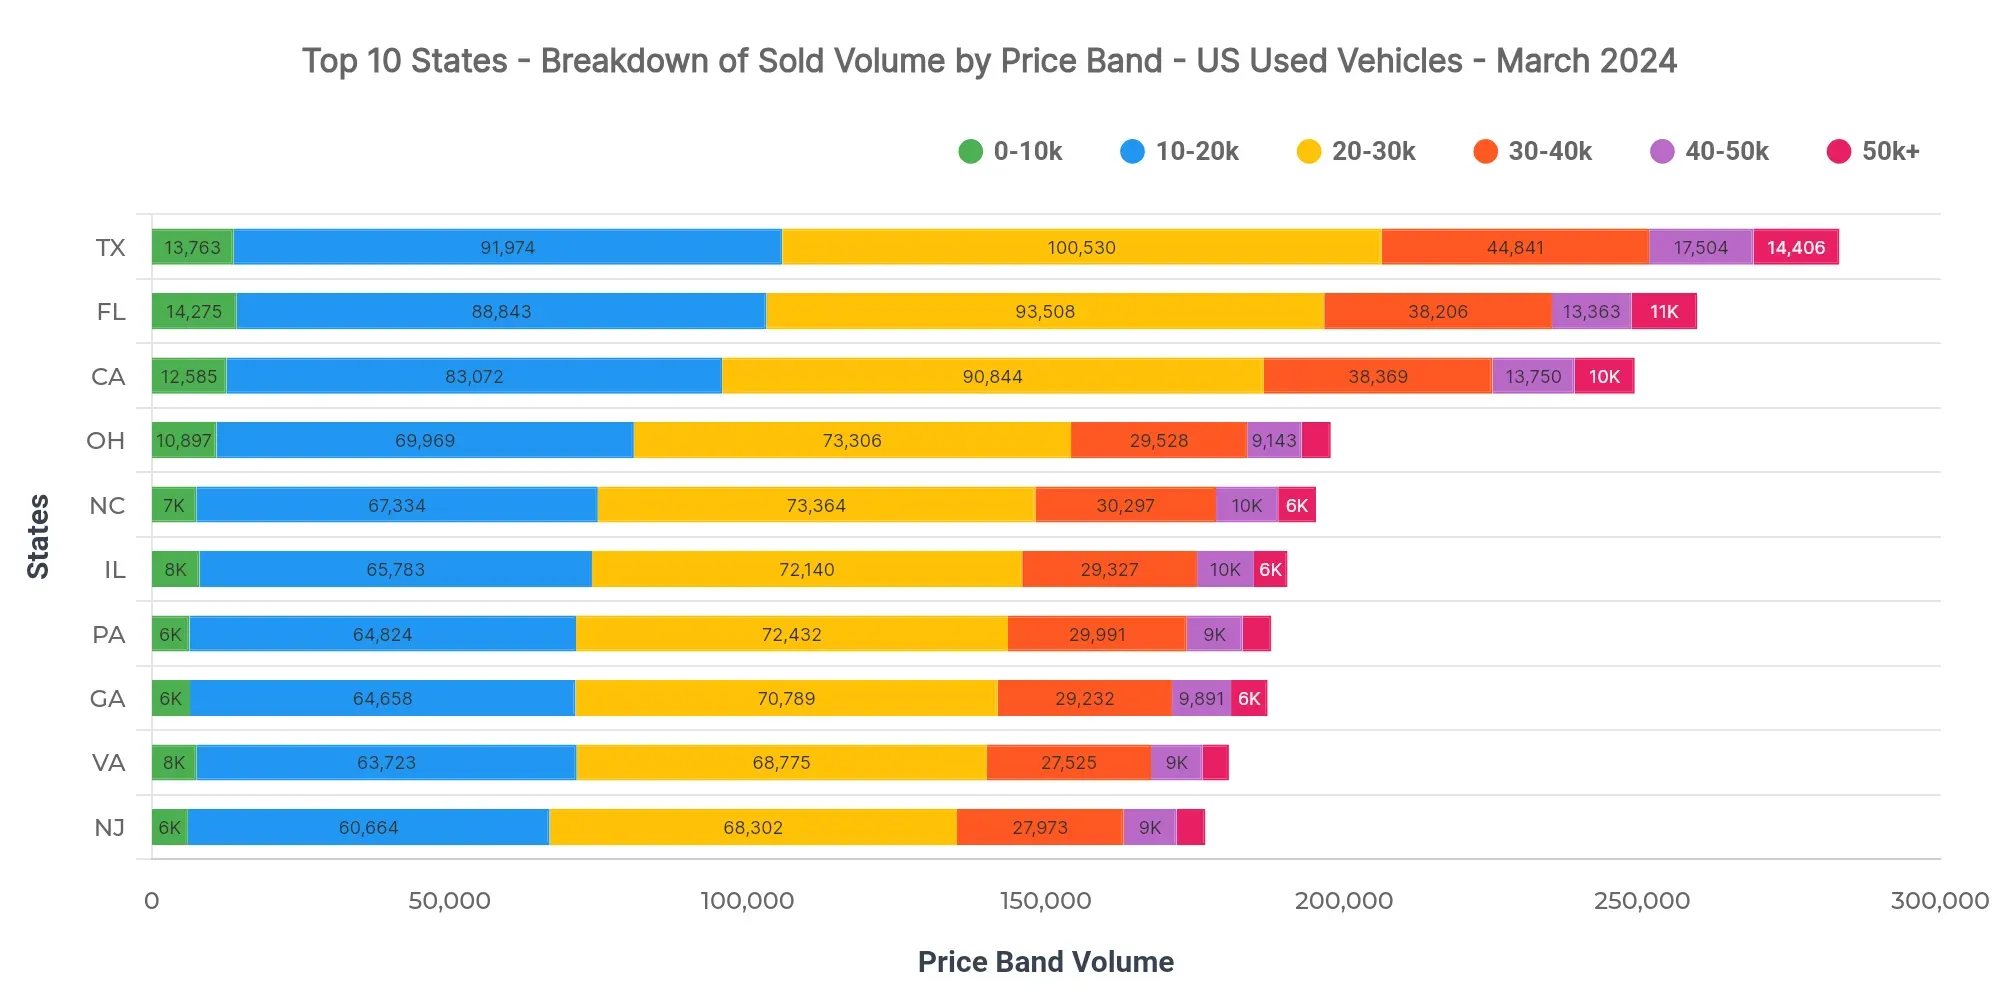
In Texas, dominant price bands include $20K–$30K (35.5%), $10K–$20K (32.5%), and $30K–$40K (15.8%). A notable segment also exists at $40K–$50K (6.2%). Comparatively, Florida at $25,458 and California at $25,947 have similar pricing but might differ in affordability and lending terms. Dealers in these states must balance inventory to match dominant price preferences, while lenders can optimize loan offerings for prevalent price bands.
Market Breakdown by Fuel Types
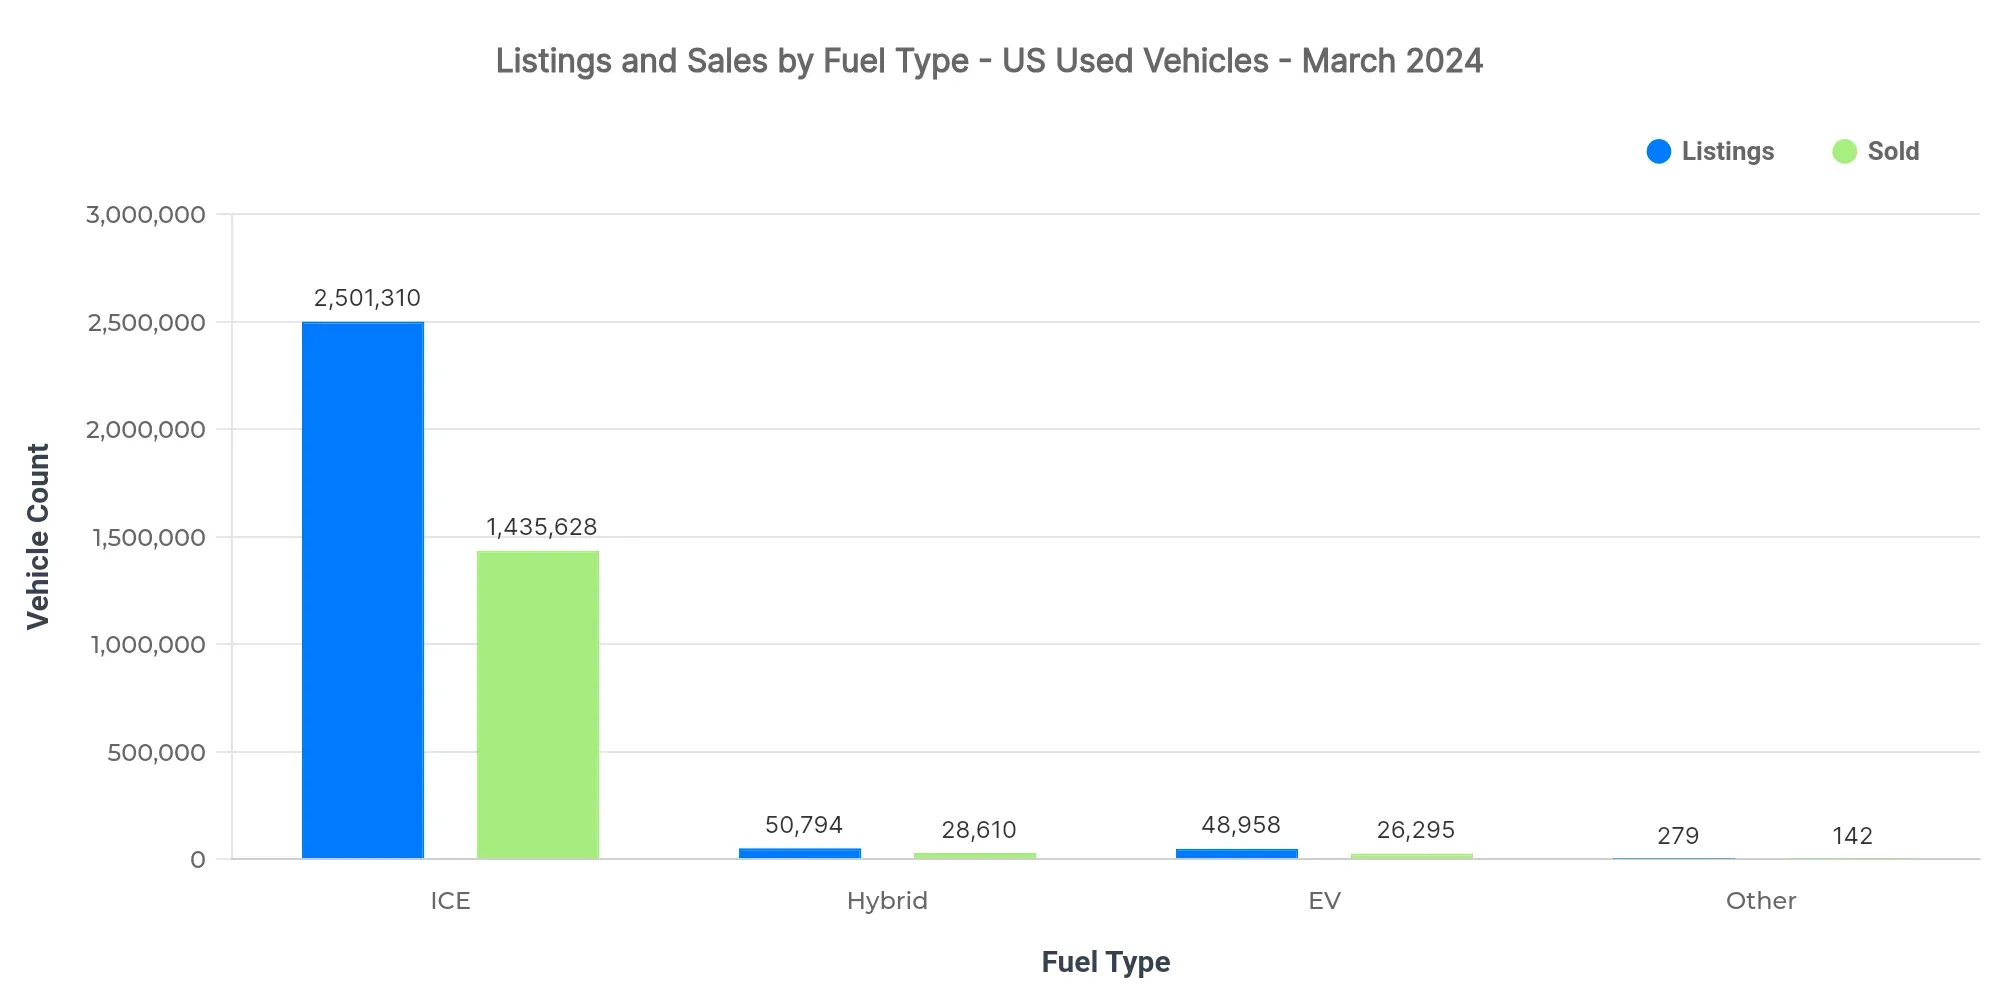
| Fuel Type | Listings Count | Sold Count | Avg Listing Price | Avg Sold Price |
|---|---|---|---|---|
| ICE | 2.50M | 1.44M | $25,727 | $25,254 |
| Hybrid | 50.8K | 28.6K | $27,019 | $25,544 |
| EV | 49.0K | 26.3K | $32,722 | $32,543 |
| Other | 279 | 142 | $16,391 | $16,723 |
- Despite the lower listing count, EVs achieve premium pricing.
- ICE vehicles dominate the market, primarily due to their volume.
- Market dynamics indicate an increasing interest and gradual adoption of EVs, driven by eco-consciousness and potential long-term cost savings.
Market Share by Body Types
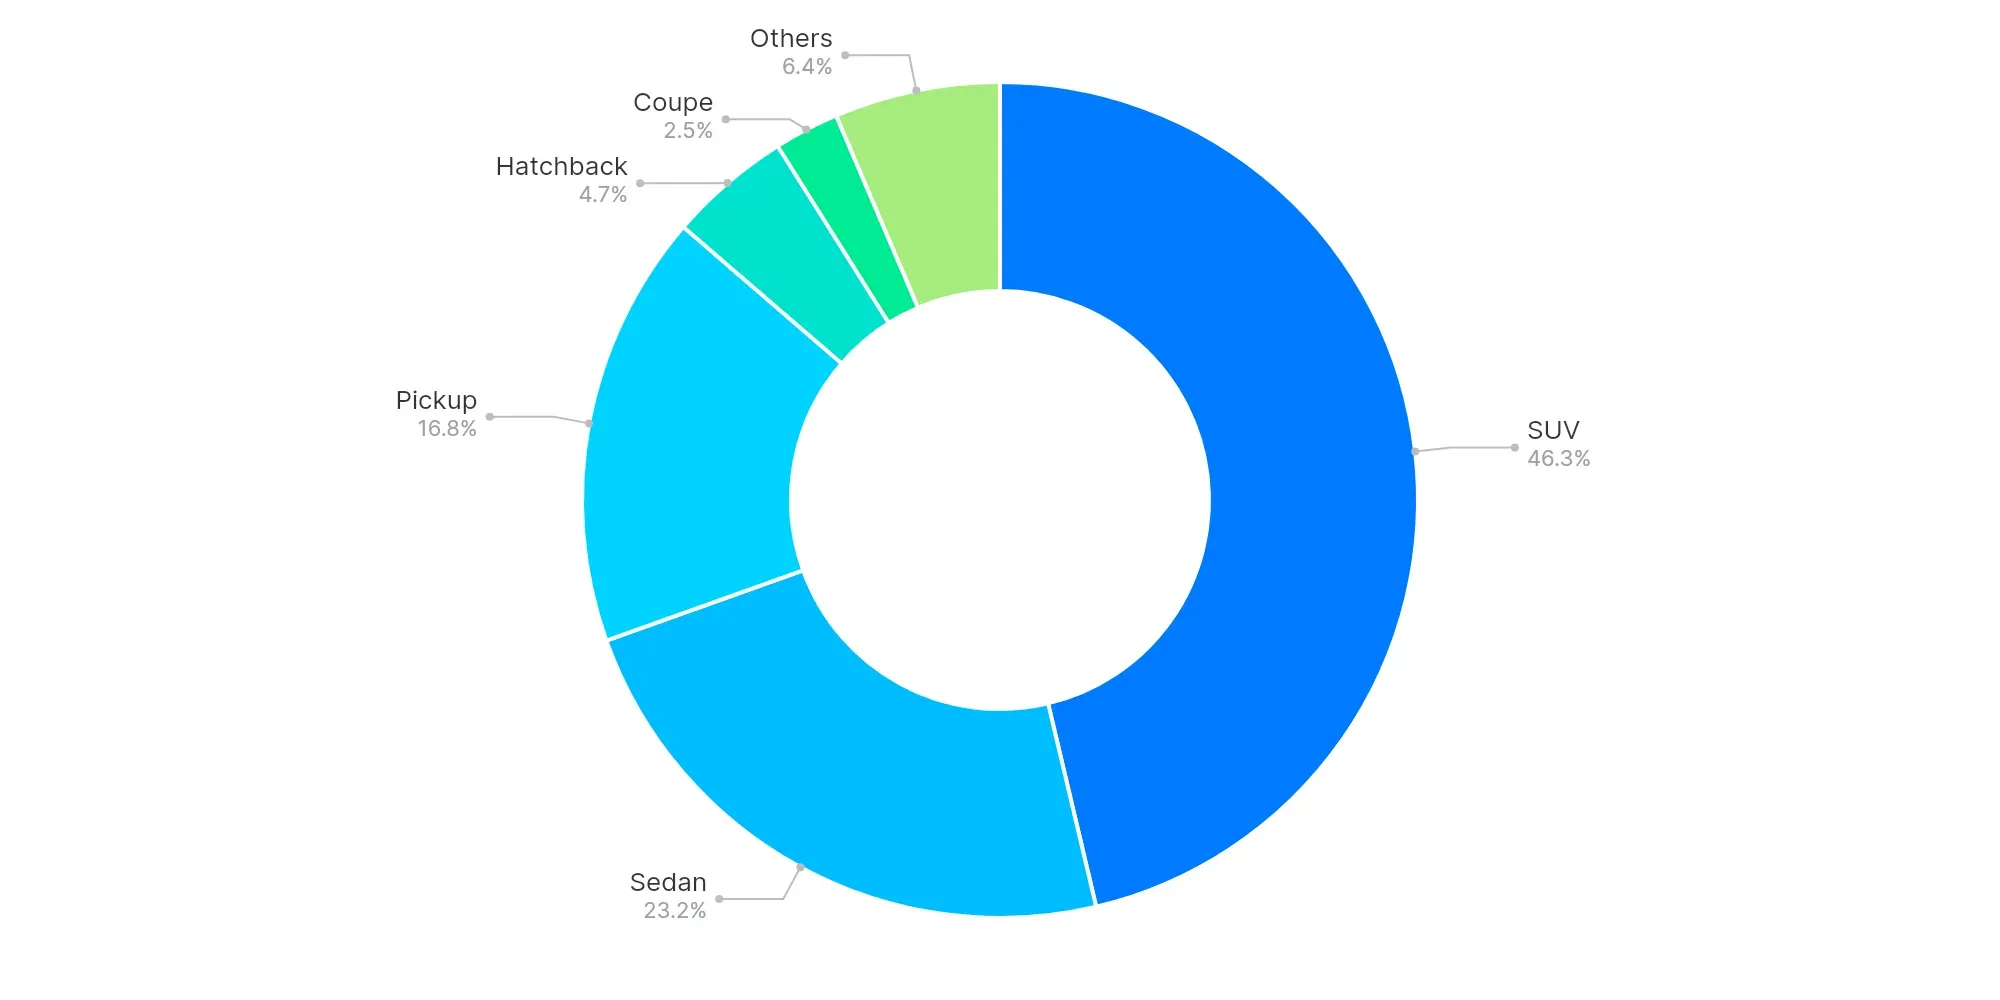
SUV (46.3%), Sedan (23.2%), and Pickup (16.8%) dominate the market, indicating a consumer preference for larger vehicles. The prevalence of SUVs and Pickups reflects ongoing trends towards spacious, versatile vehicles for both urban and rural needs.
High-Volume vs Low-Volume States (Executive Insights)
- Top-performing states: Texas, Florida, and California
- Underpenetrated regions: Virgin Islands, American Samoa, Northern Mariana Islands
- Key price bands: $20K–$30K, $10K–$20K, $30K–$40K
- EV trend: Gradual adoption with premium pricing
- Buyer preferences: SUVs and Pickups dominate, reflecting demand for utility and space
In conclusion, the U.S. used car market in March 2024 shows robust growth in large states, while emerging trends in fuel types and body preferences provide strategic insights for dealers and analysts. Understanding these patterns will help industry stakeholders optimize their operations and adapt to shifting consumer and market demands.