

US Monthly Used Car Market Data – June 2025
This report explores key indicators in the US used car market for June 2025, including dealer activity, sales volume, pricing, fuel types, body types, and regional performance. The analysis is derived solely from the most recent dataset, providing an accurate overview of current market trends and dynamics.
Number of Dealerships by State
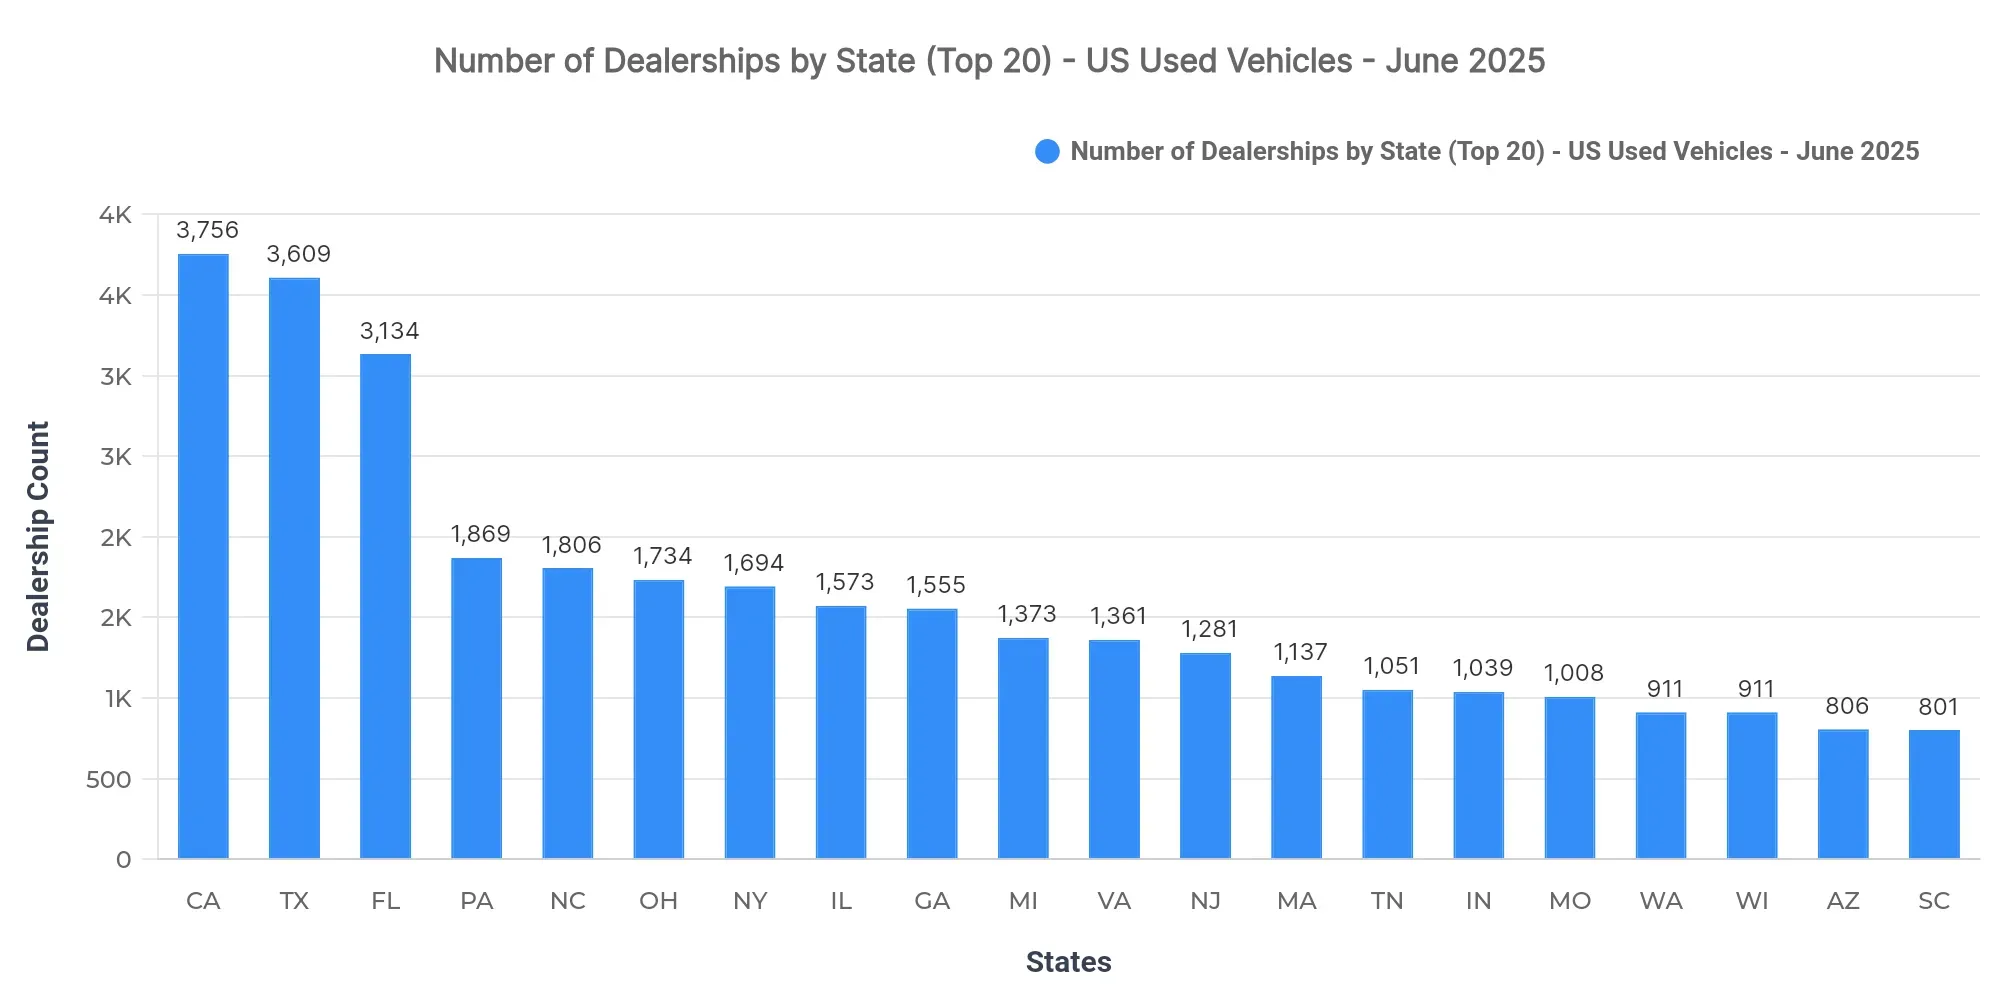
California (3,756), Texas (3,609), and Florida (3,134) lead in dealership presence. The concentration of dealerships in these states underscores a high level of market saturation, especially in populous regions, indicating a competitive environment for dealers aiming to capture consumer attention.
Top 10 States by Sold Volume
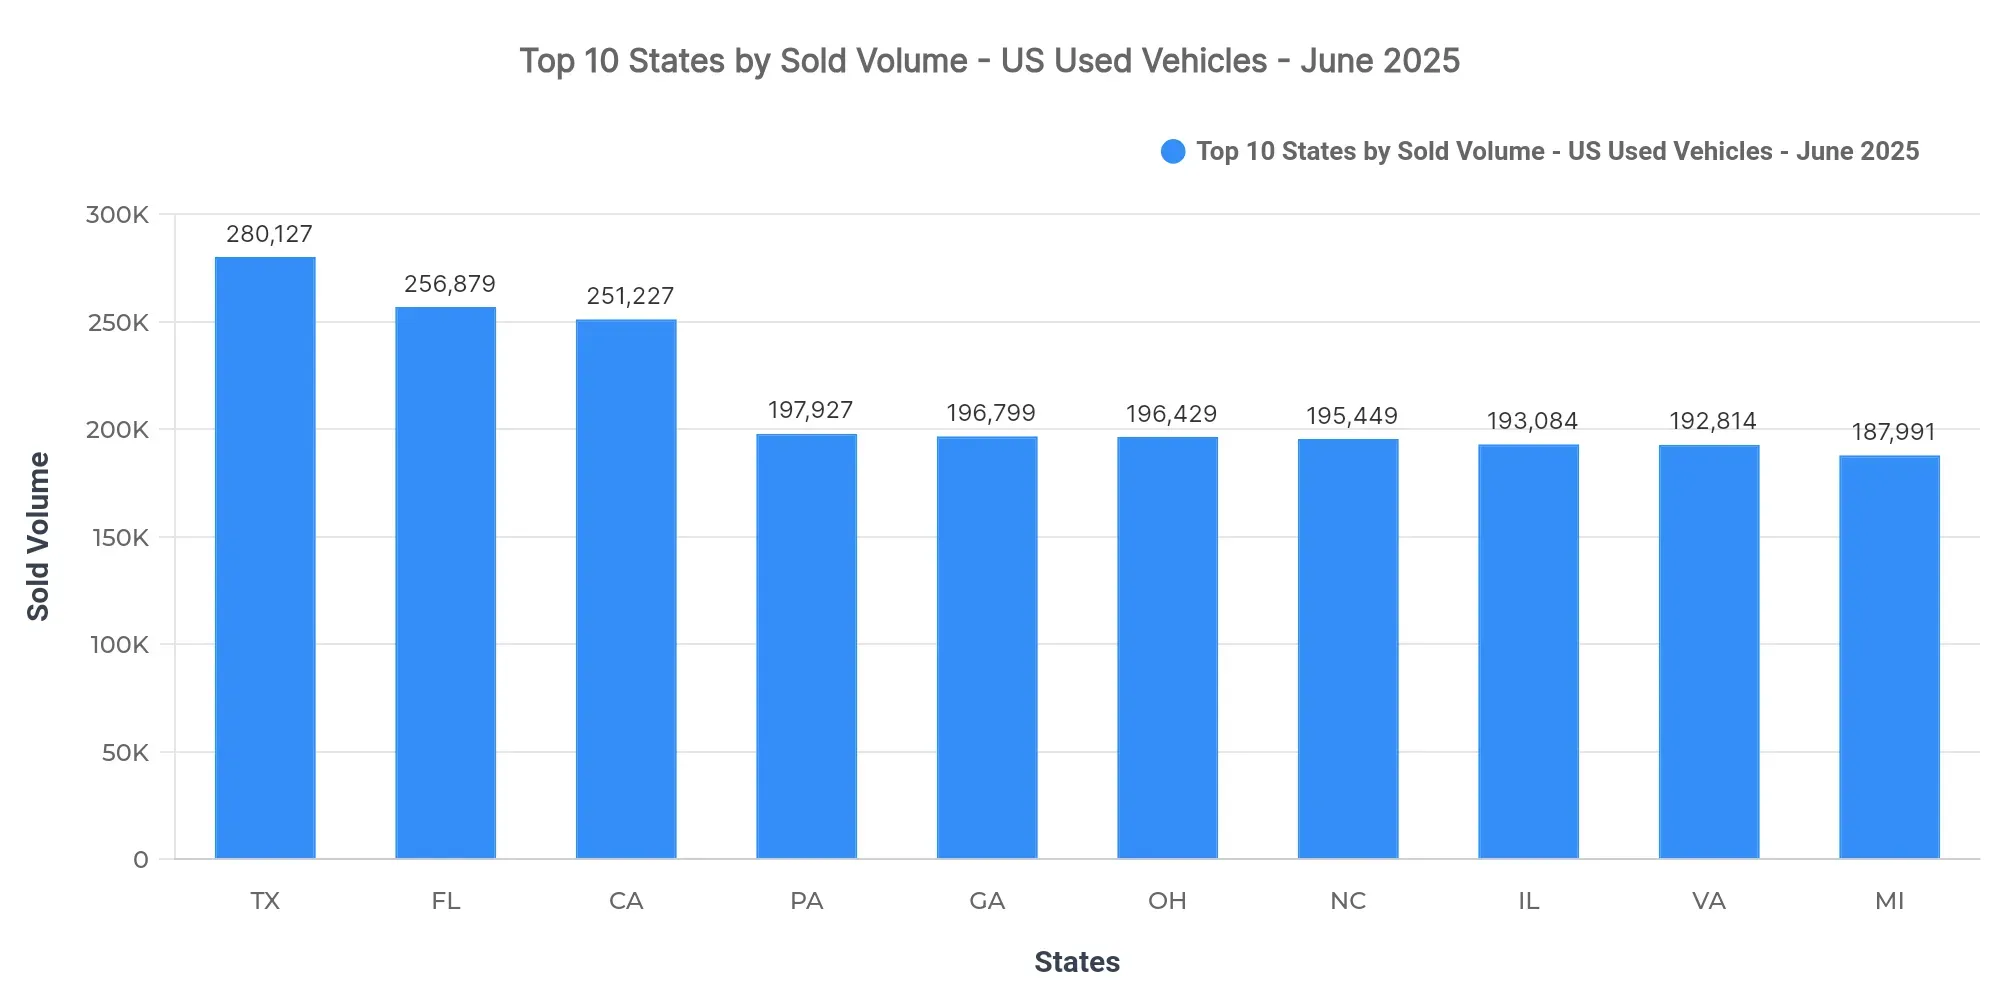
Texas (280,127), Florida (256,879), and California (251,227) lead. The top 3 combined share of national sold volume is 11.2%. The remaining top-10 states are Pennsylvania, Georgia, Ohio, North Carolina, Illinois, Virginia, and Michigan. High sales concentration in Texas, Florida, and California suggests a robust consumer base and increased dealership pressure in these regions. Demand in these states reflects regional preferences, with warmer climates and urbanization influencing vehicle choices.
Price Breakdown: Top 10 States by Sold Volume
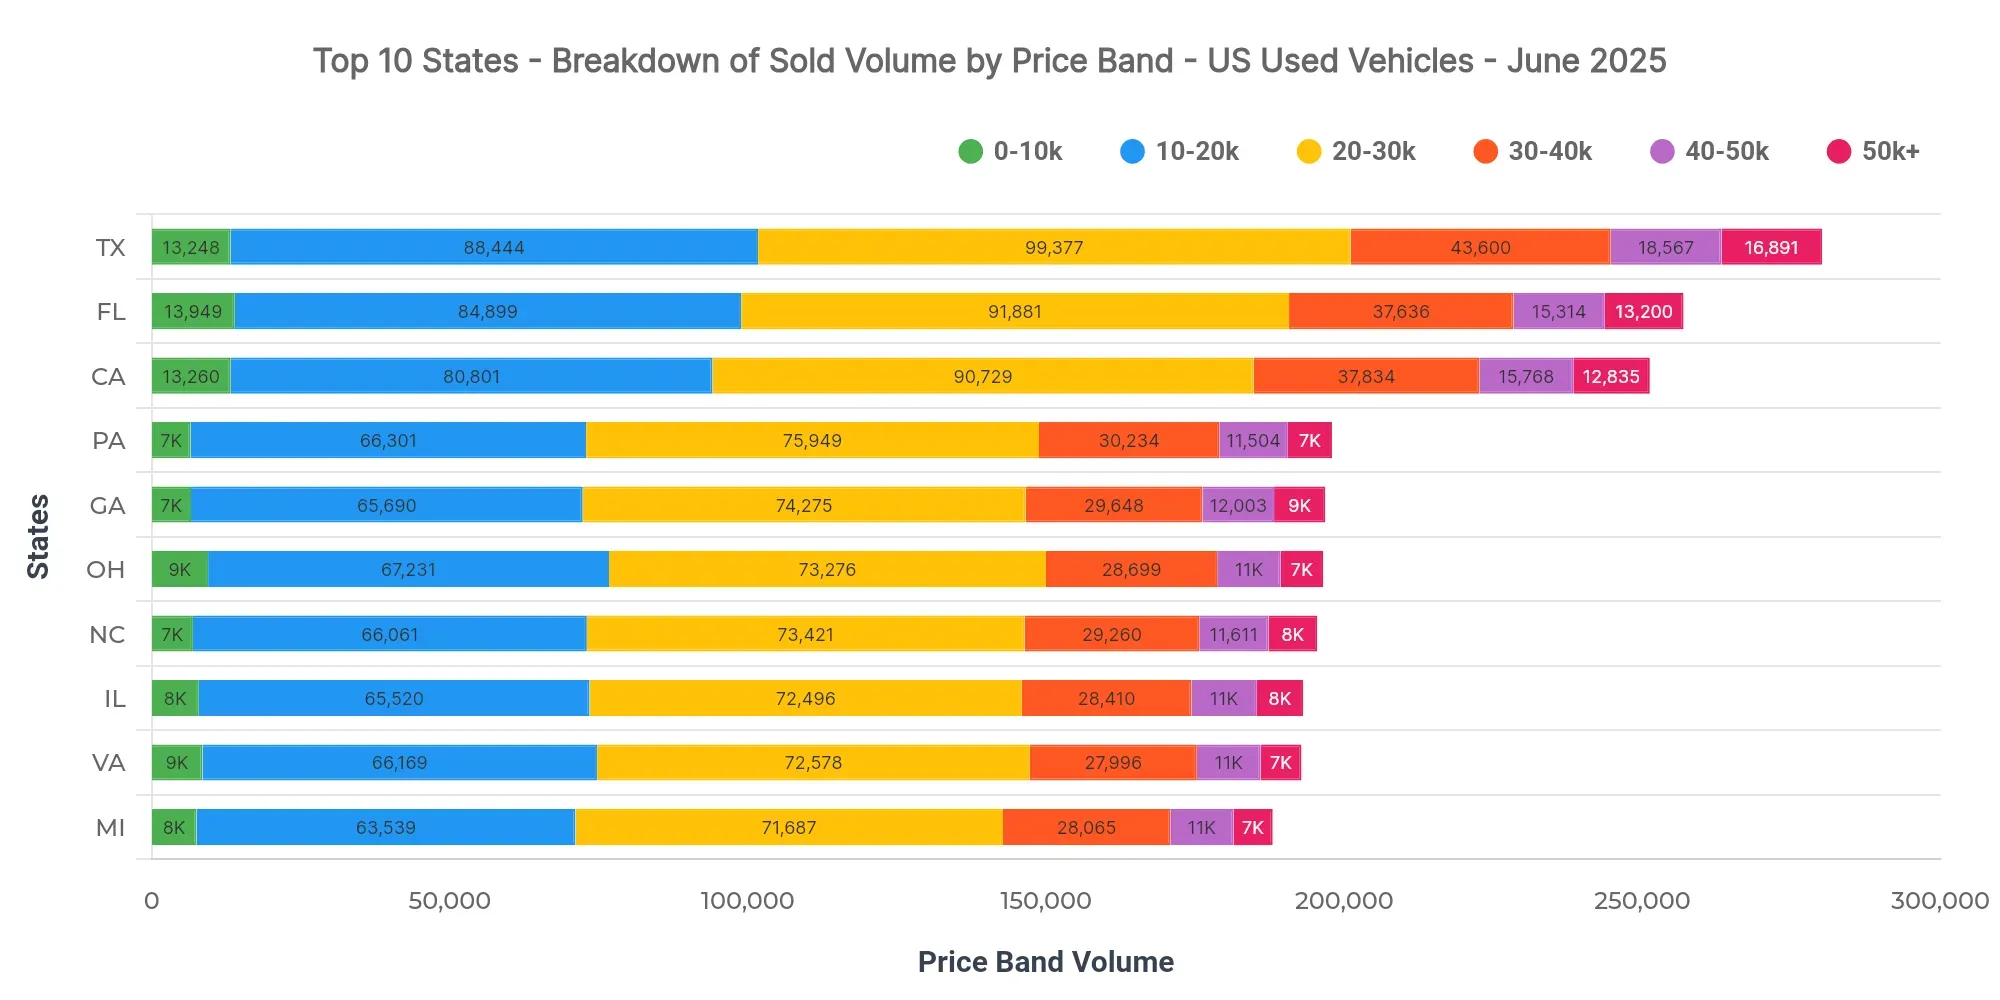
In Texas, the dominant price bands are $20K–$30K (35.5%), $10K–$20K (31.6%), and $30K–$40K (15.6%), with a notable amount between $40K–$50K at 6.6%. Florida at $25,729 and California at $26,168 reflect variant consumer spending power across high-volume states. Dealers should focus on vehicles within the prevalent price ranges to maximize sales potential. For pricing and lending strategies, the presence of higher-priced bands nearing 15% suggests an opportunity to cater to upscale buyers.
Market Breakdown by Fuel Types
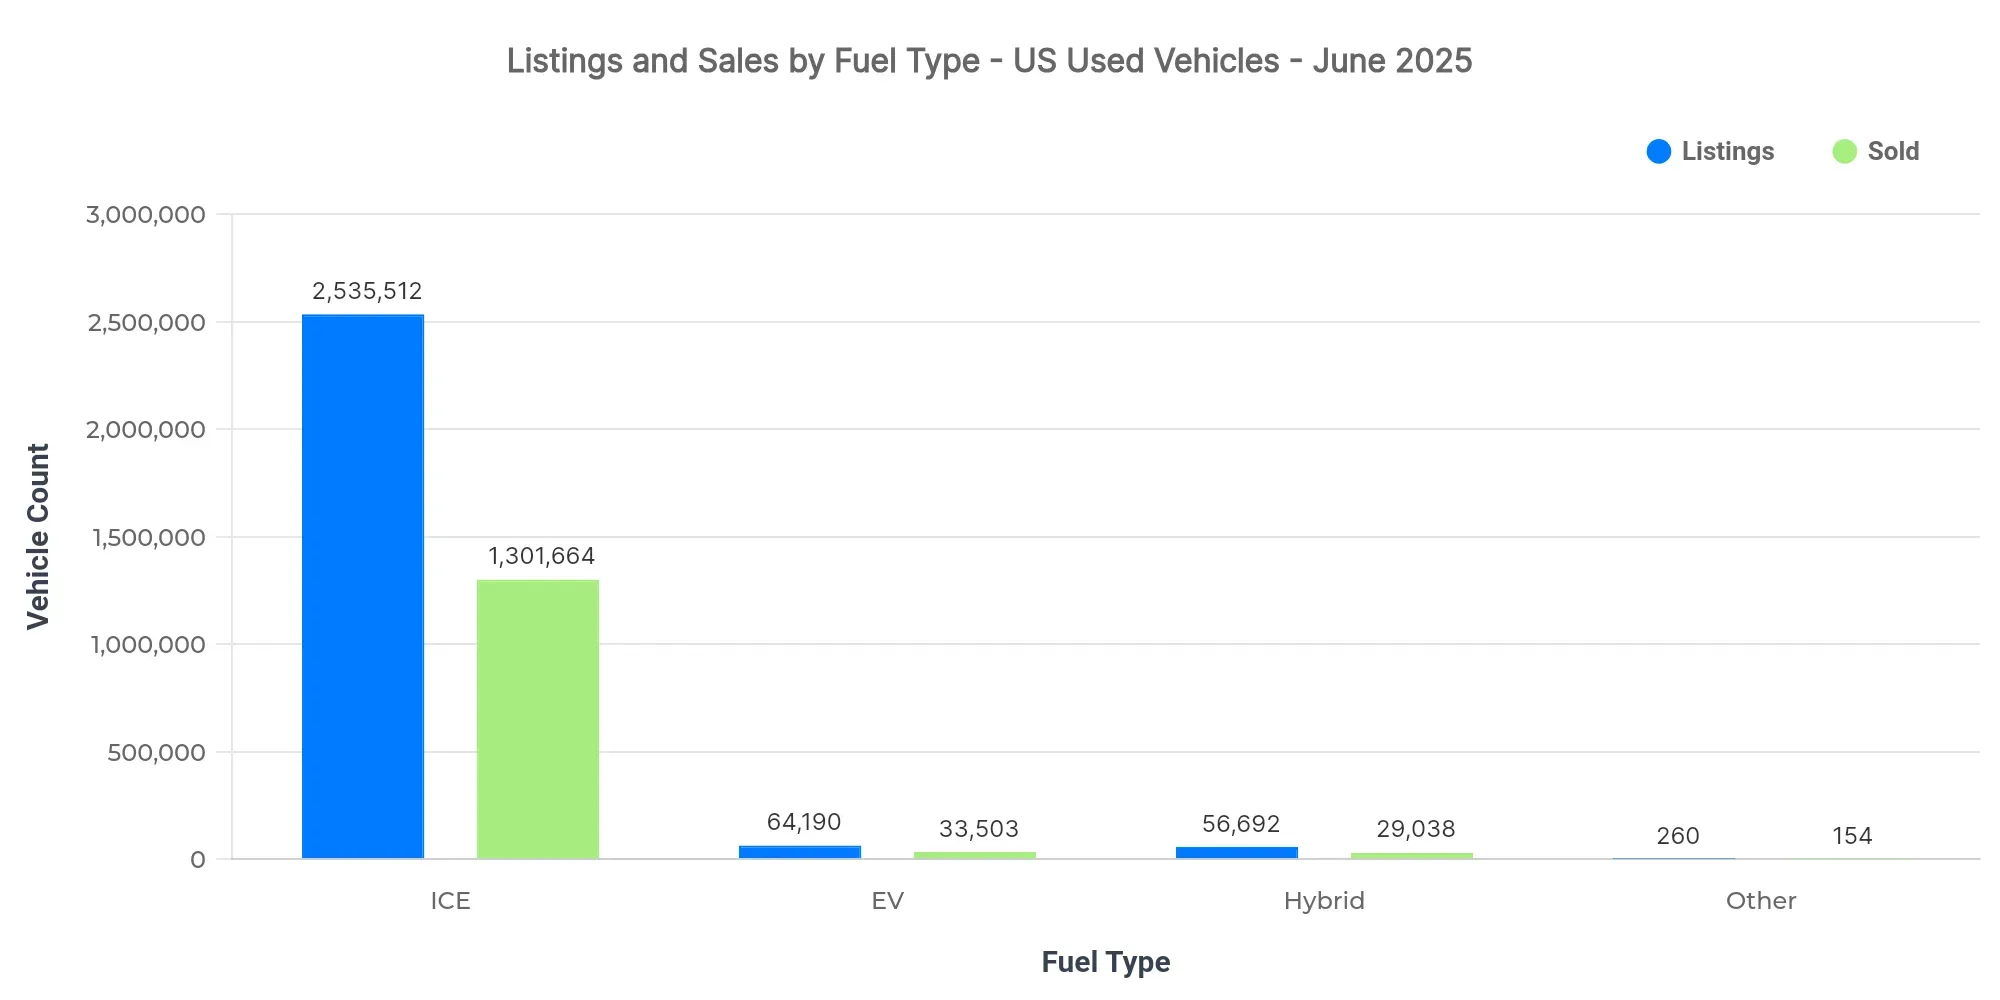
| Fuel Type | Listings Count | Sold Count | Avg Listing Price | Avg Sold Price |
|---|---|---|---|---|
| ICE | 2.54M | 1.30M | $26,864 | $25,673 |
| EV | 64.19K | 33.50K | $33,444 | $30,691 |
| Hybrid | 56.69K | 29.04K | $29,511 | $26,374 |
| Other | 260 | 154 | $13,394 | $13,979 |
- EV adoption is noticeable; however, ICE vehicles continue to dominate.
- Pricing positions EVs higher, indicating a premium market status.
- Market dynamics reveal a growing hybrid segment balancing traditional and electric preferences.
Market Share by Body Types
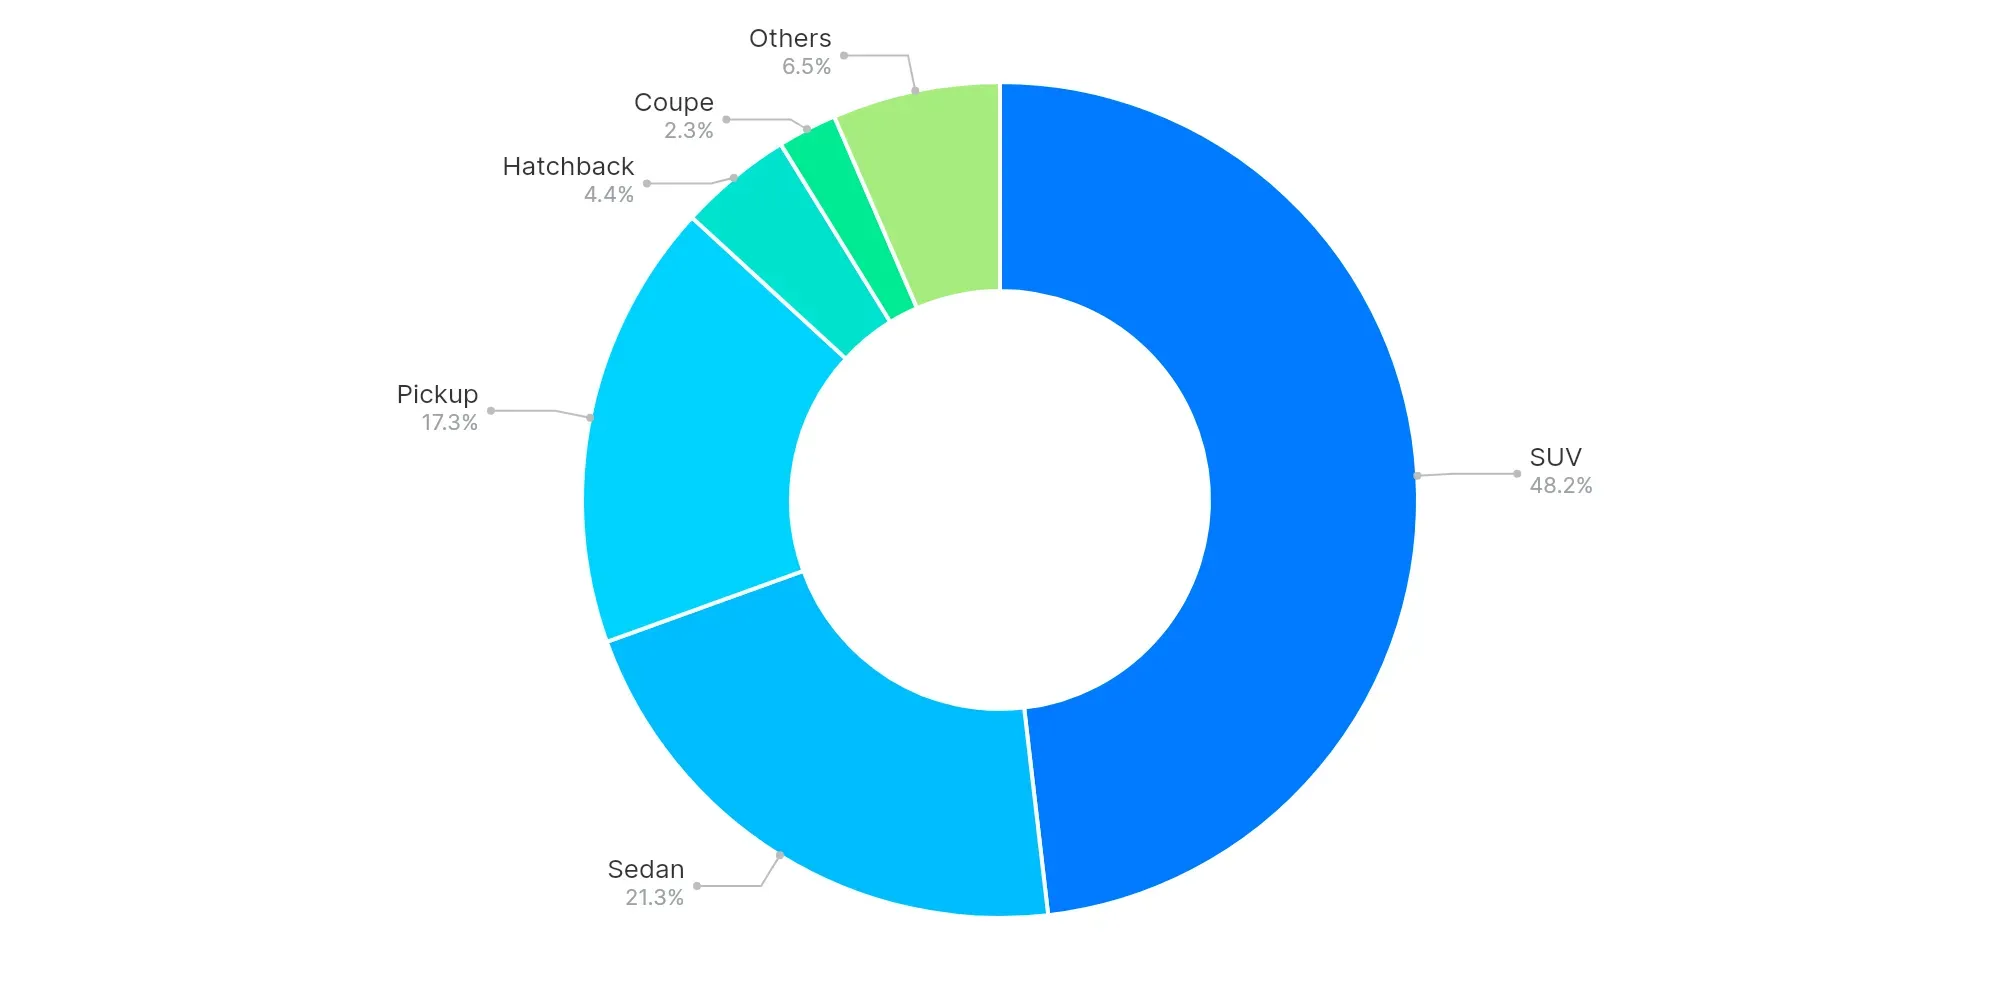
SUV (48.2%), Sedan (21.3%), and Pickup (17.3%) dominate, indicating a consumer preference for larger vehicles such as SUVs and Pickups. This trend towards spacious and versatile vehicles suggests a sustained demand for family and utility features in vehicle purchases.
High-Volume vs Low-Volume States (Executive Insights)
- Top-performing states: Texas, Florida, California
- Underpenetrated regions: Virgin Islands, American Samoa, Northern Mariana Islands
- Key price bands: $20K–$30K, $10K–$20K, $30K–$40K
- EV trend: Rising but secondary to ICE dominance
- Buyer preferences: Shift towards larger body types and mid-range price categories
The market continues to show strong regional dynamics with significant demand in the southern and western states. Dealers should leverage insights into price bands and body type preferences to optimize inventory. Continued monitoring of EV market penetration provides opportunities for strategic expansion in green vehicles.