

US Monthly Used Car Market Data – June 2024
This report provides an analysis of the US used vehicle market in June 2024, focusing on dealer activity, sales volumes, pricing, fuel and body types, as well as regional performance. Key insights highlight the states leading the market in dealership presence and sales volume, along with pricing trends, consumer preferences, and market dynamics for various vehicle categories.
Number of Dealerships by State
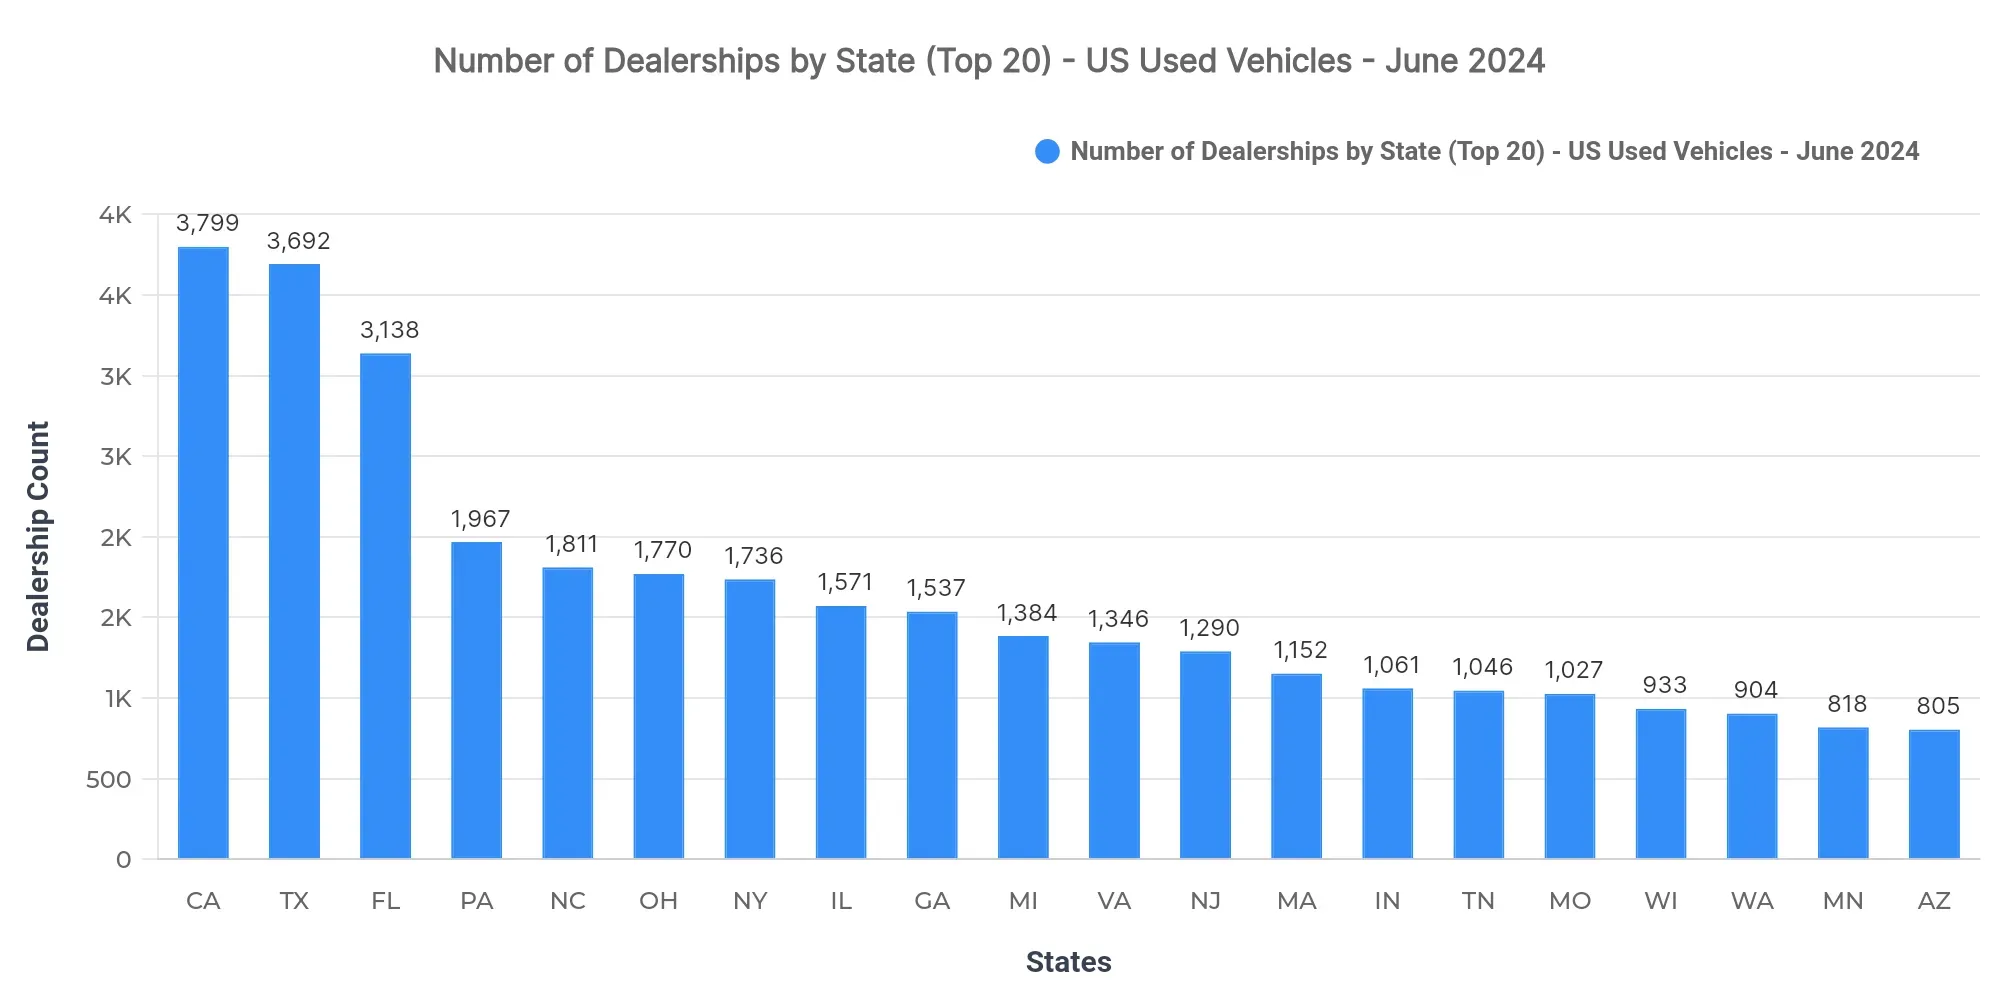
California (3,799), Texas (3,692), and Florida (3,138) lead in the number of dealerships, showcasing robust dealer activity in these key markets. This concentration suggests a highly competitive environment, especially in states with established dealership networks. Saturation in these regions likely incentivizes differentiation through pricing or service offerings.
Top 10 States by Sold Volume
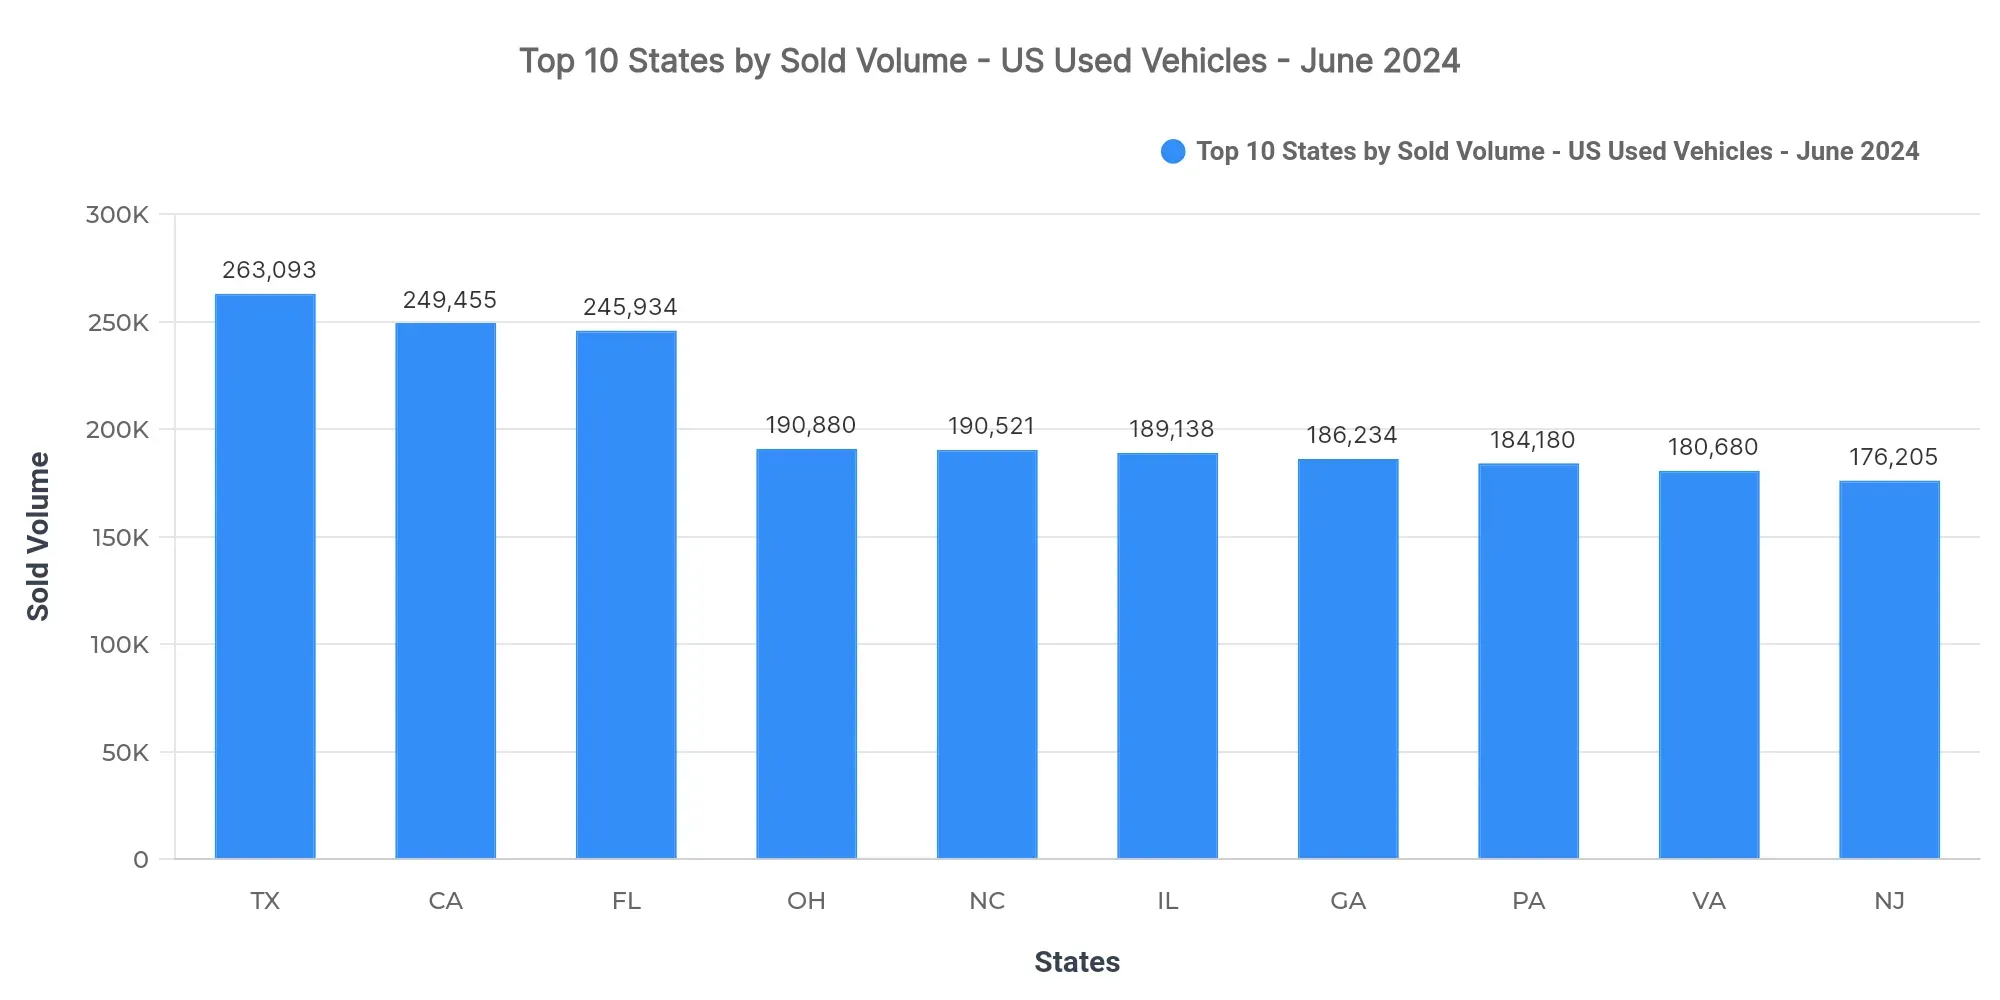
Texas (263,093), California (249,455), and Florida (245,934) lead the nation in sold used car volumes, representing a combined 11.3% share of the national sold volume. The remaining top ten states include Ohio, North Carolina, Illinois, Georgia, Pennsylvania, Virginia, and New Jersey.
The concentration of sales in these three states reflects strong demand, posing opportunities for new dealership openings or marketing strategies tailored to local consumer preferences. Regionally, Southern and Western states display higher sales volumes, indicative of a growing demand for varied vehicle types and competitive pricing.
Price Breakdown: Top 10 States by Sold Volume
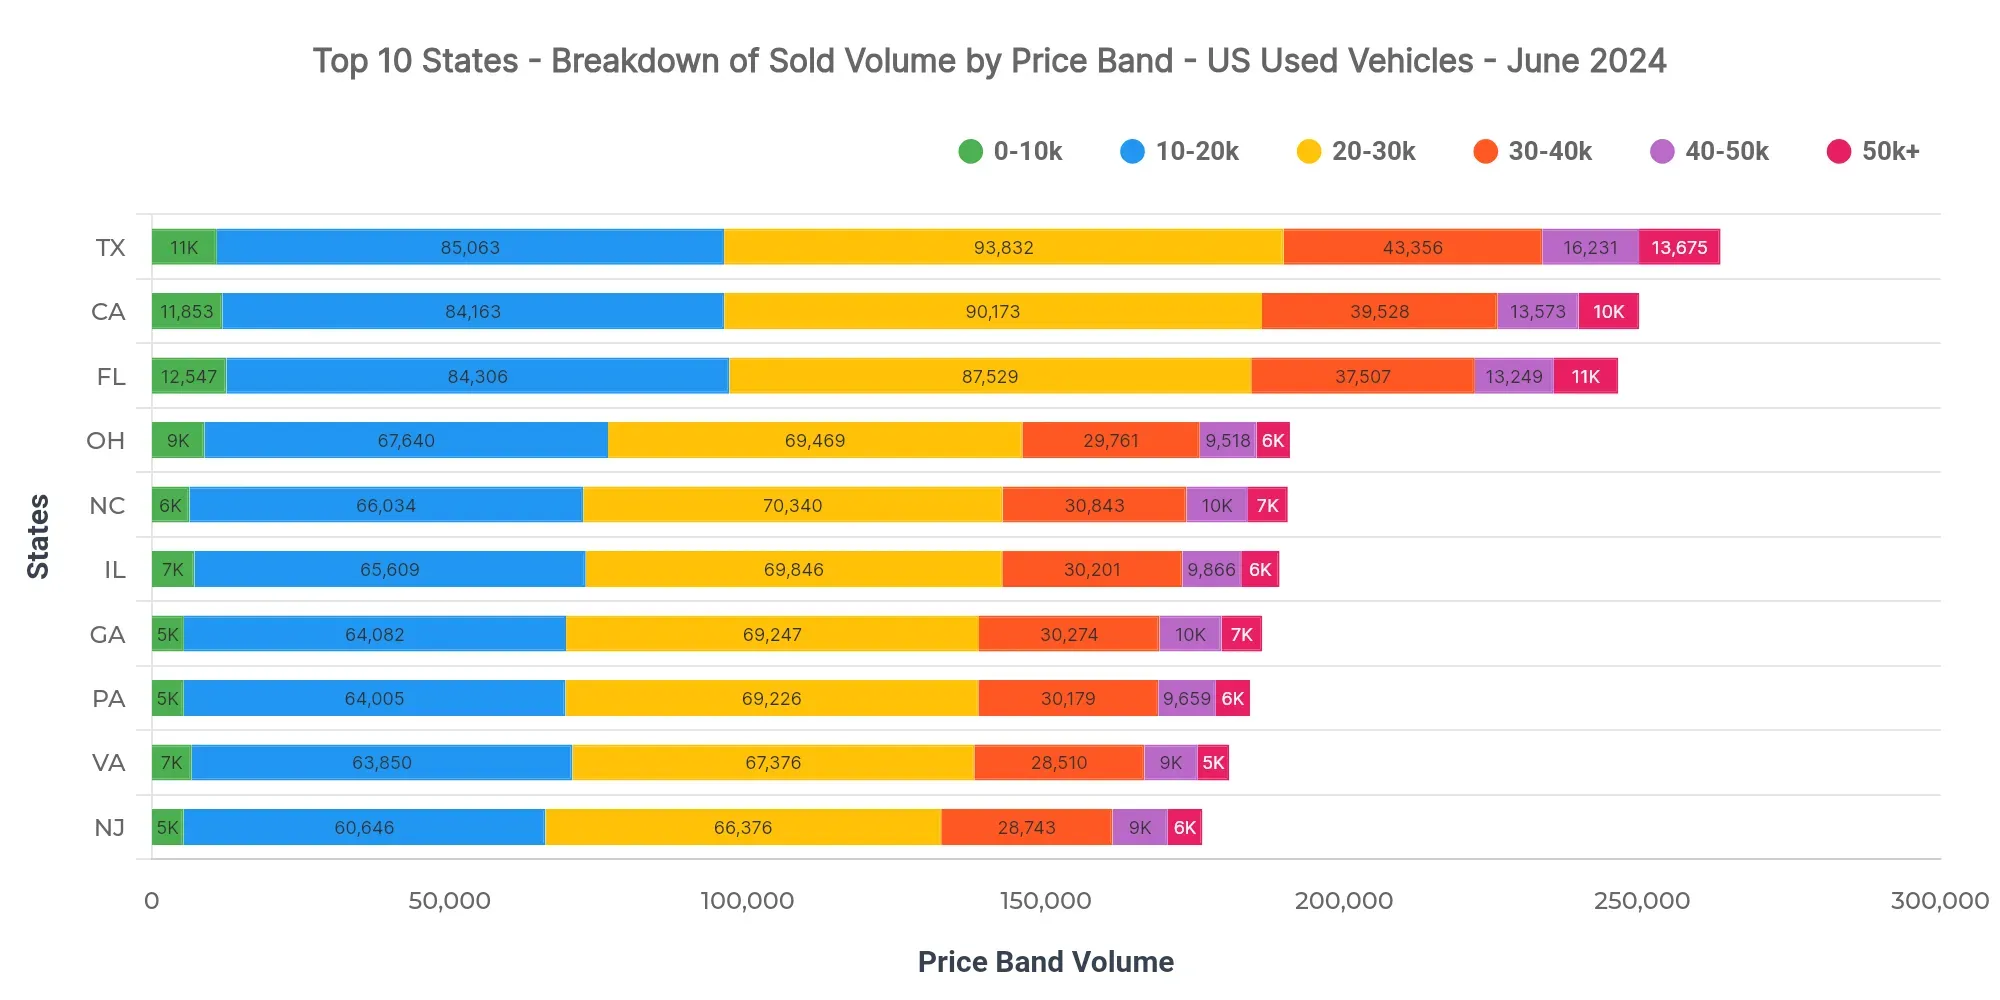
In Texas, vehicles priced between $20K–$30K (35.7%), $10K–$20K (32.3%), and $30K–$40K (16.5%) dominate sales. The price band $40K–$50K holds a smaller share (6.2%) but contributes to the market's diversity. In comparison, California and Florida show competitive average sold prices, with Florida at $25,632 and California at $26,114.
For dealers, alignment with dominant price segments in Texas may optimize inventory turnover. Pricing strategies should consider nuanced demand shifts towards select bands, influencing lending terms to accommodate purchasing power.
Market Breakdown by Fuel Types
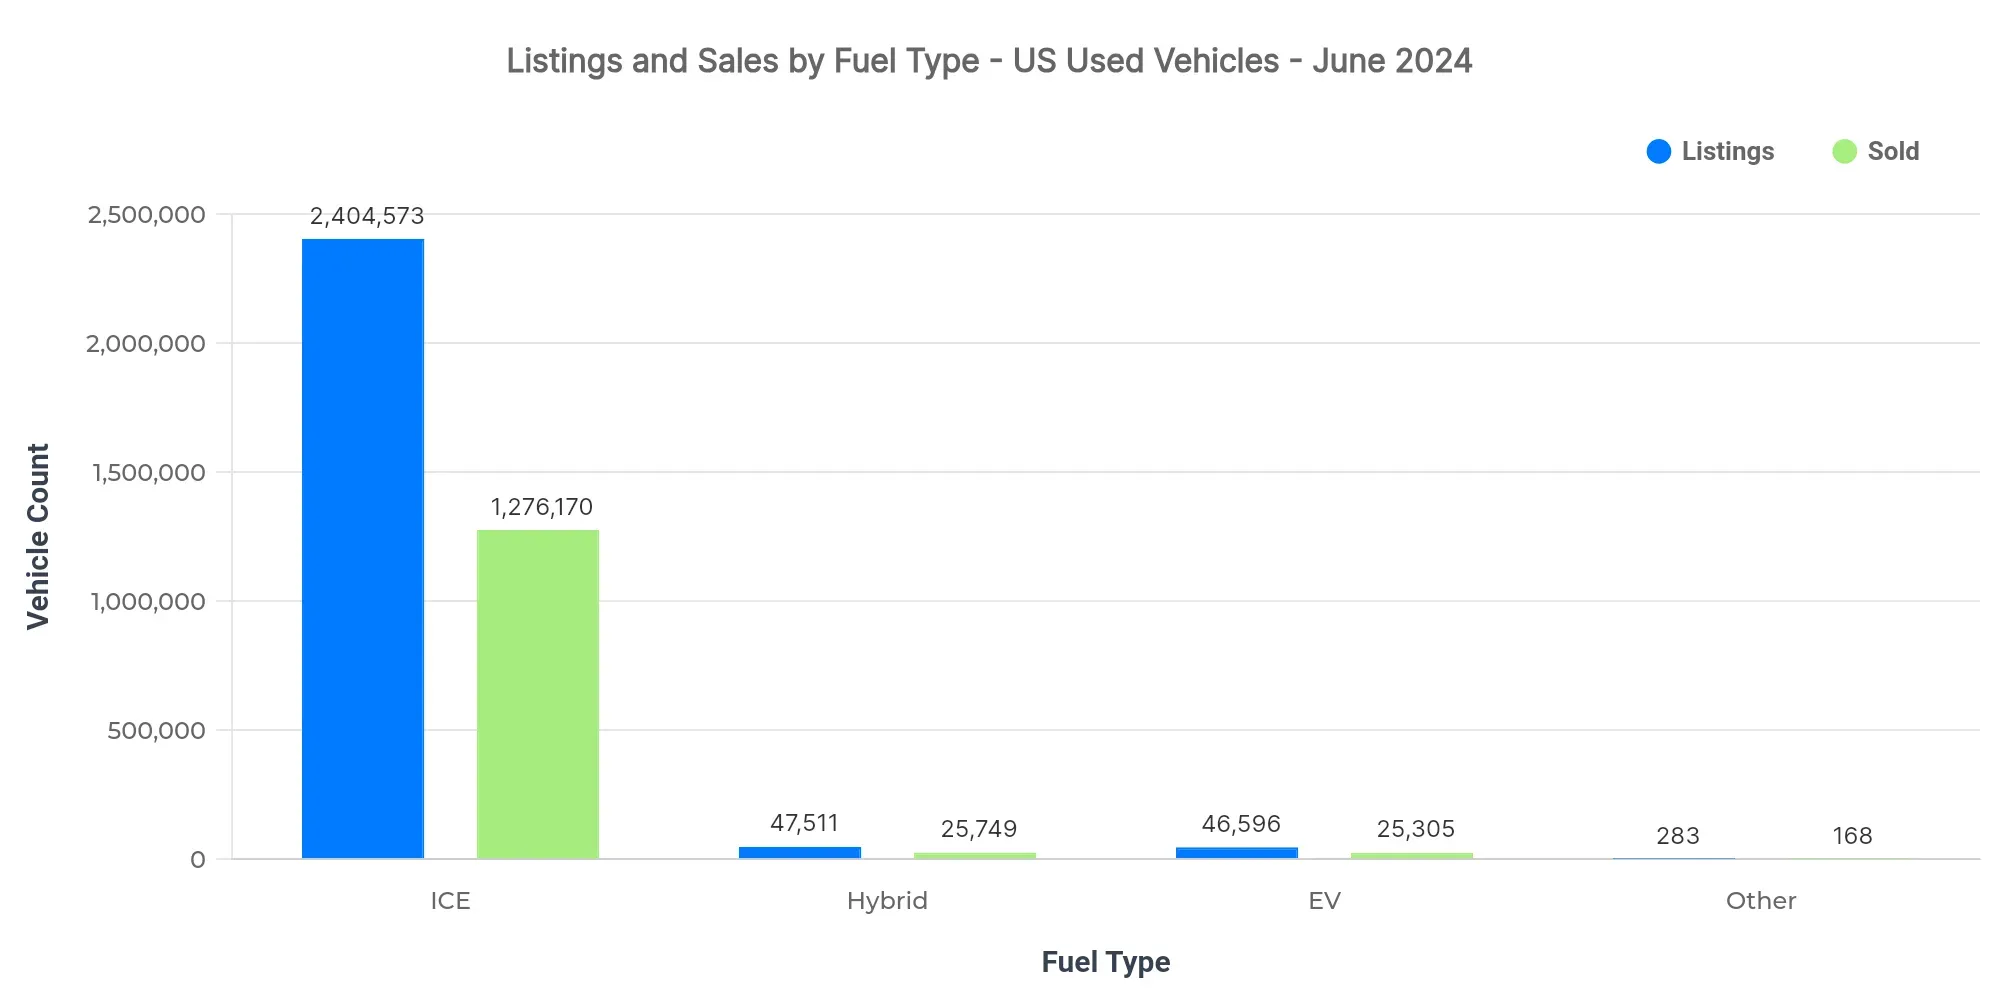
| Fuel Type | Listings Count | Sold Count | Avg Listing Price | Avg Sold Price |
|---|---|---|---|---|
| ICE | 2.40M | 1.27M | $26,194 | $25,511 |
| Hybrid | 47.51K | 25.75K | $27,920 | $26,303 |
| EV | 46.60K | 25.31K | $33,298 | $31,007 |
| Other | 283 | 168 | $17,895 | $21,848 |
- Continued EV adoption is observed through strong listing and sales counts, despite premium pricing.
- Hybrids demonstrate competitive pricing, appealing to budget-conscious but eco-minded consumers.
- ICE vehicles maintain dominance, signaling entrenched market dynamics favoring traditional engines.
Market Share by Body Types
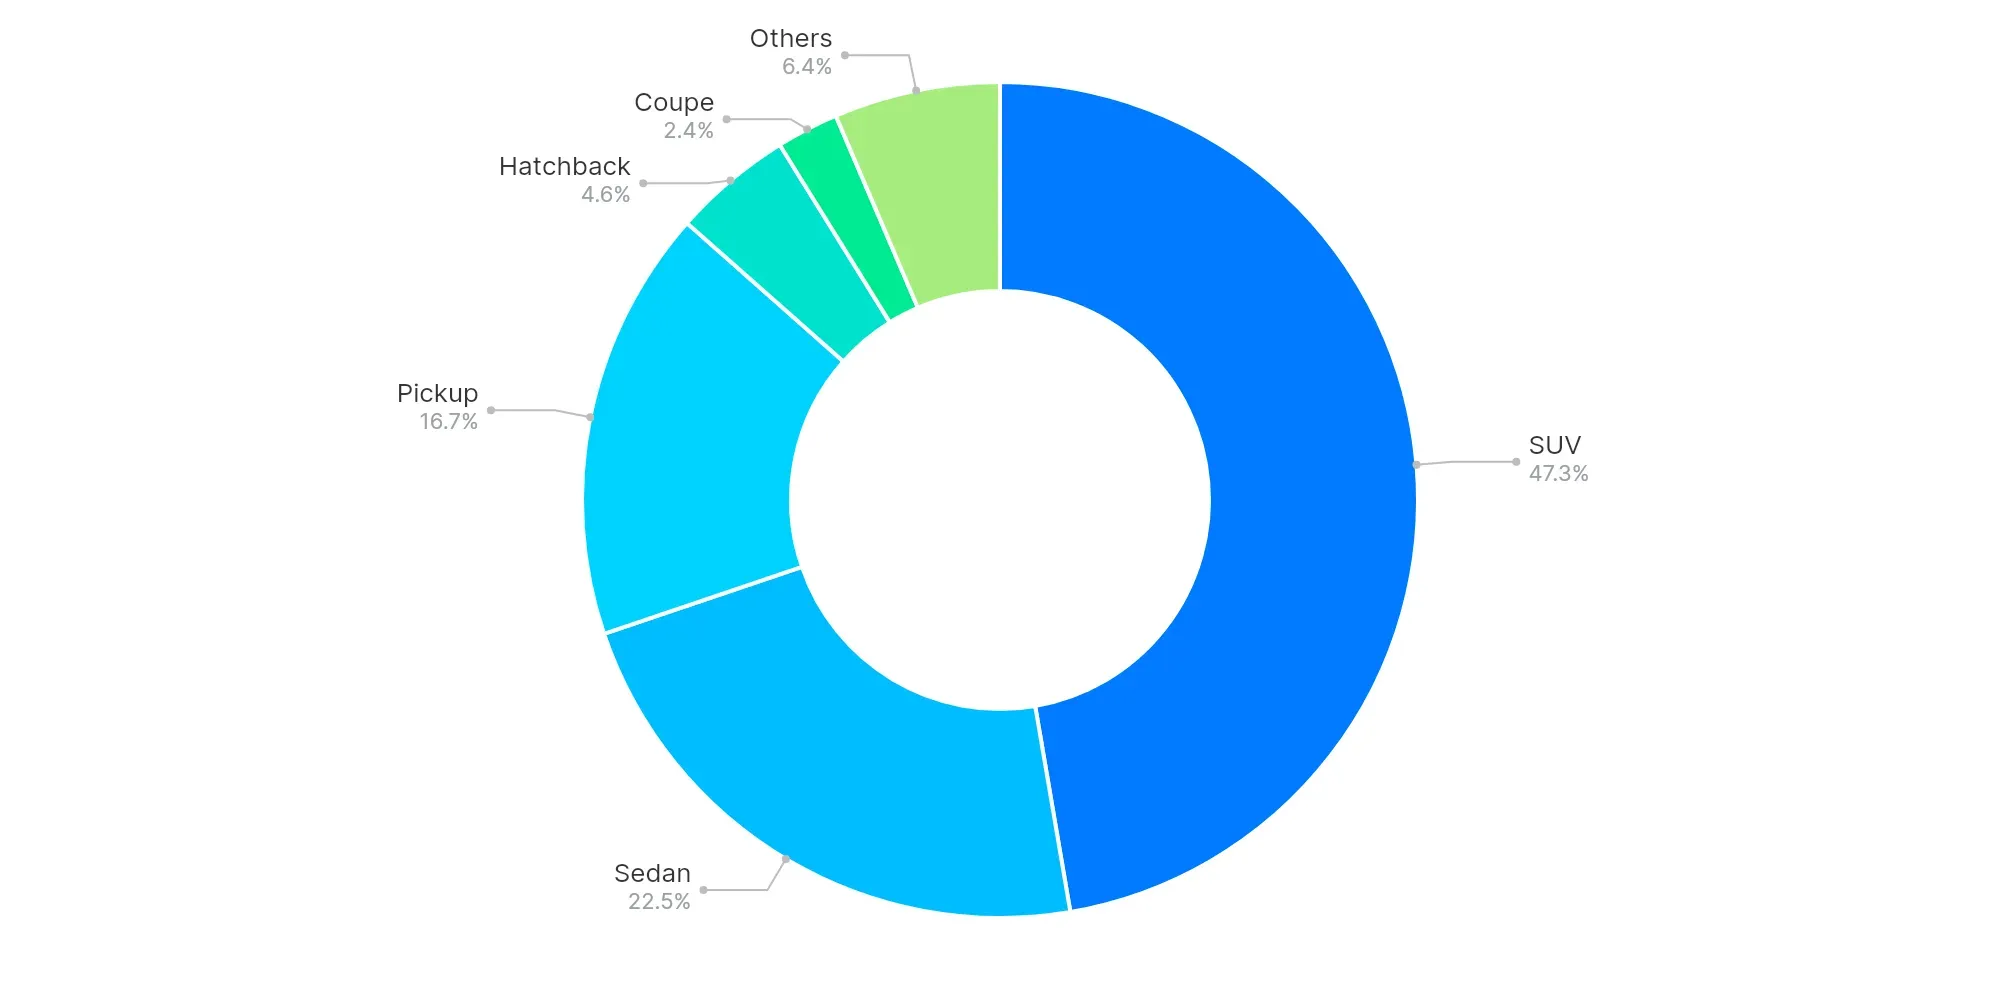
SUVs (47.3%), Sedans (22.5%), and Pickups (16.7%) dominate the body type shares. The strong presence of SUVs and Pickups showcases a consumer preference for larger vehicles, likely driven by versatility and perceived value. As preferences shift, there is potential for market penetration in growing body type segments.
High-Volume vs Low-Volume States (Executive Insights)
- Top-performing states: Texas, California, Florida
- Underpenetrated regions: American Samoa, Virgin Islands, Northern Mariana Islands
- Key price bands in top states: $20K–$30K, $10K–$20K, $30K–$40K
- Steady EV trend amidst premium listings
- Consumer preference for SUVs and Pickups for their practicality and value proposition
In summary, the US used car market continues its expansion with robust activity in key regional markets amidst dynamic pricing strategies tailored to a range of consumer demands. Dealers are urged to leverage regional insights and strategically align inventories with prevalent consumer preferences to maximize impact.