

US Monthly Used Car Market Data – July 2025
This report delves into key metrics of the US used vehicle market for July 2025, including dealer activity, sales volume, pricing trends, fuel types, body types, and regional performance. The insights aim to guide strategic decision-making for stakeholders in the automotive sector.
Number of Dealerships by State
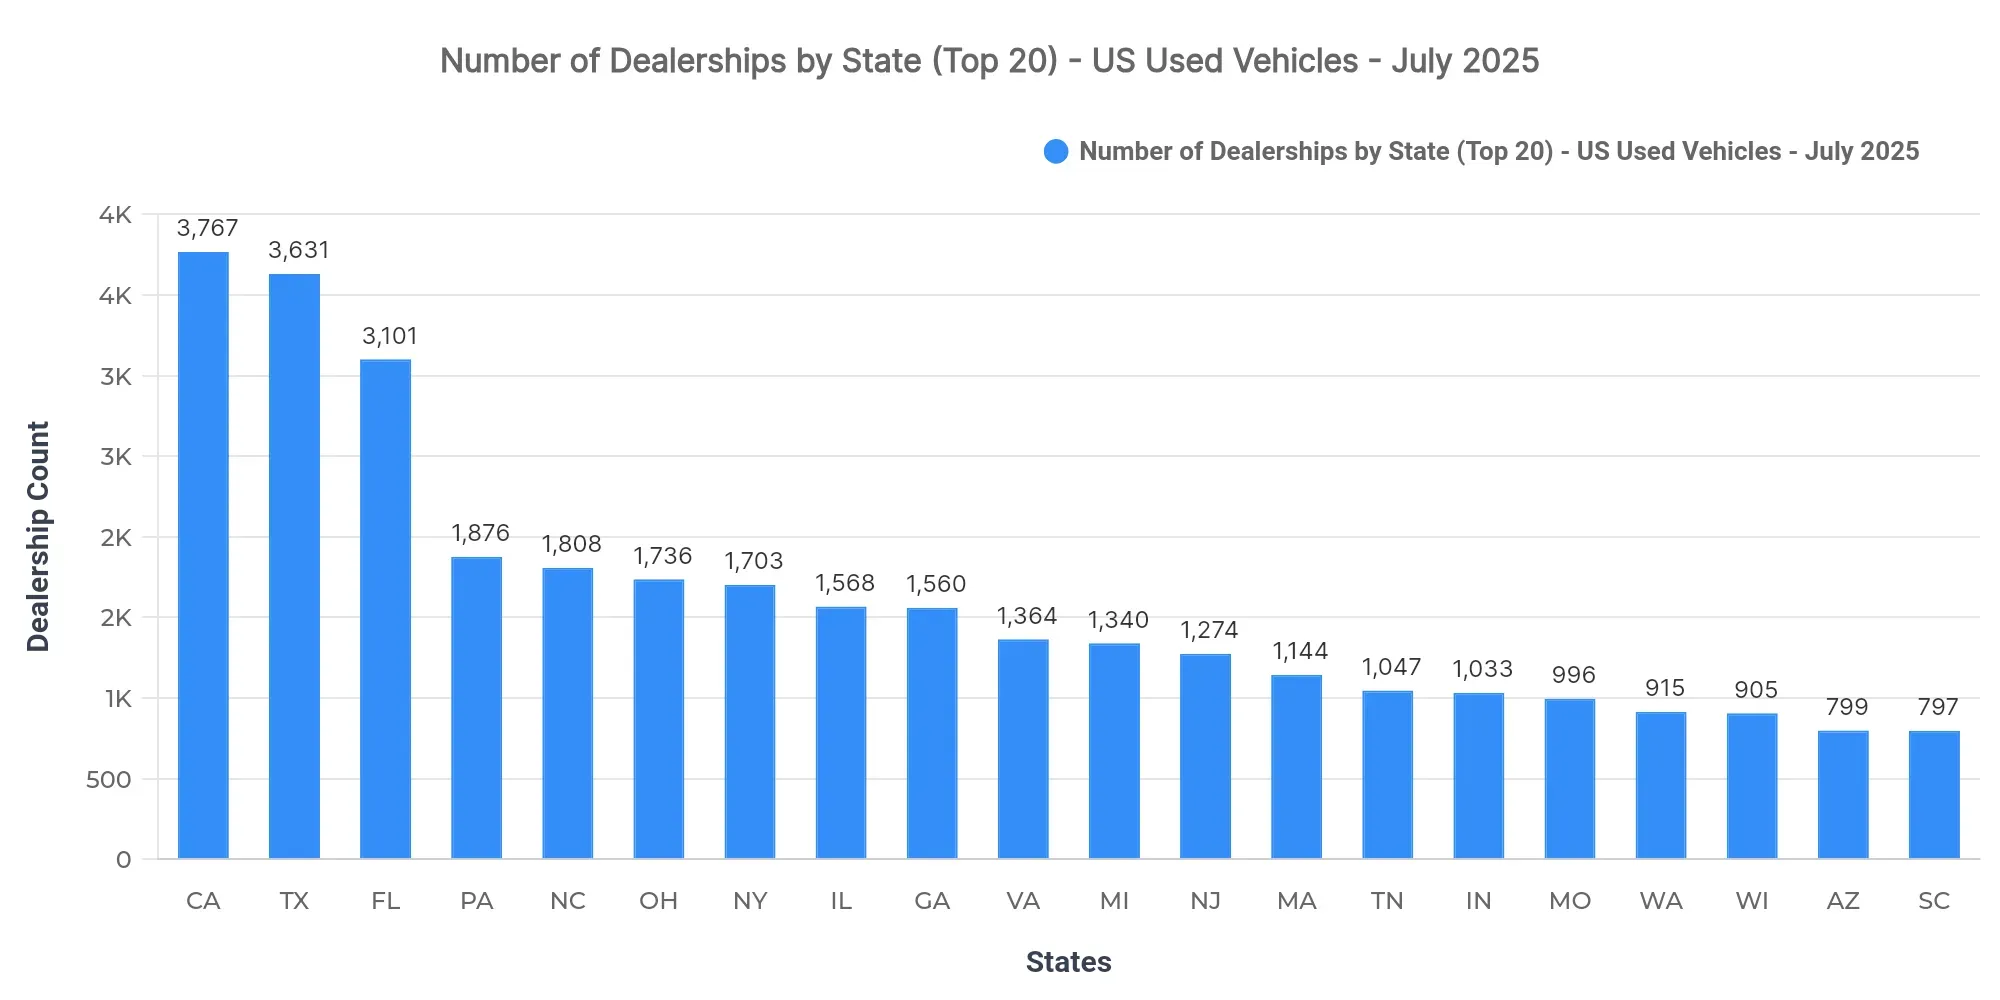
California (3,767), Texas (3,631), and Florida (3,101) lead in dealership counts. This concentration of dealerships indicates potential market saturation in these states, which could lead to competitive pricing strategies among dealers. The dominance of these states suggests a robust network of both supply and demand for used vehicles.
Top 10 States by Sold Volume
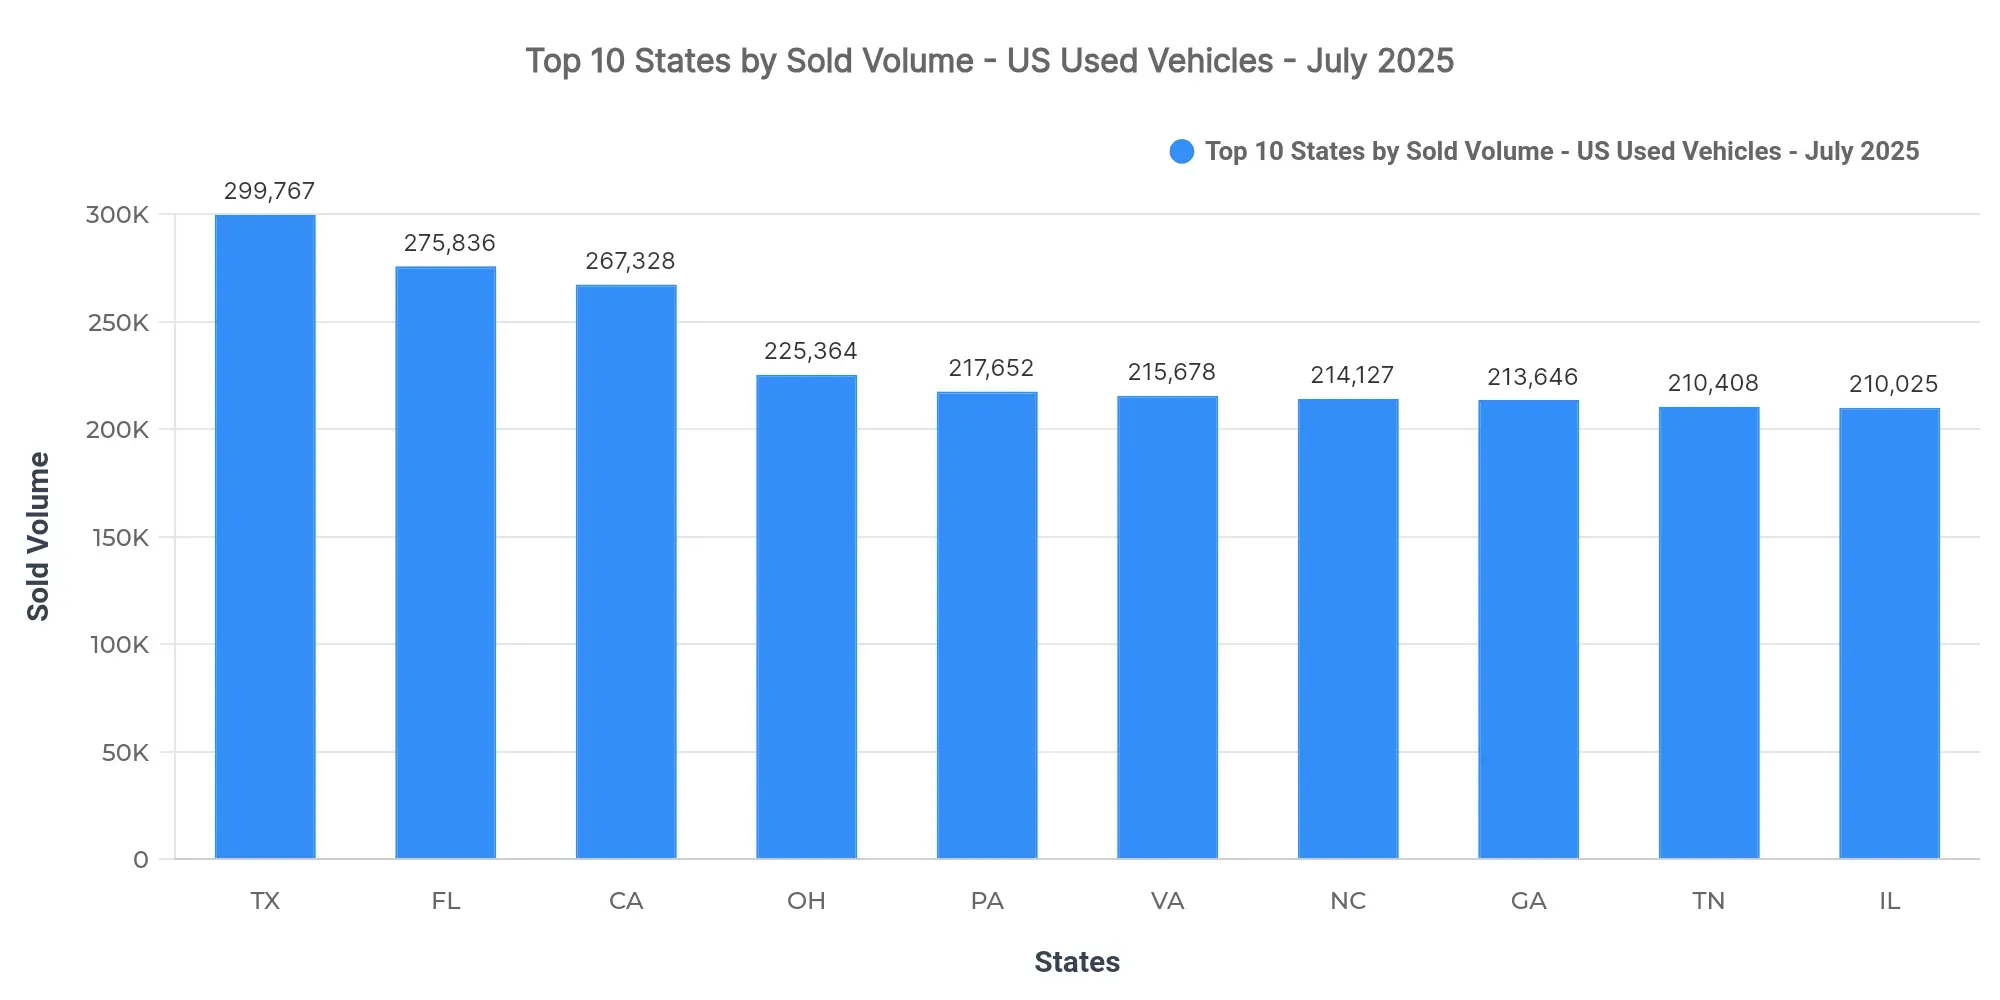
Texas (299,767), Florida (275,836), and California (267,328) lead in sales volume, contributing to a combined share of 11% of the national sold volume. The remaining top 10 states include Ohio, Pennsylvania, Virginia, North Carolina, Georgia, Tennessee, and Illinois. While Texas, Florida, and California dominate sales, indicating strong market dynamics, it also highlights the regional disparity in sales activity. The other states in the top 10 show significant volumes but lack the market dominance of the top three.
The market remains concentrated in states with substantial urban populations and economic activity. Demand patterns indicate a preference for regions with larger metropolitan areas, which typically have more diverse vehicle inventories and buyer options.
Price Breakdown: Top 10 States by Sold Volume
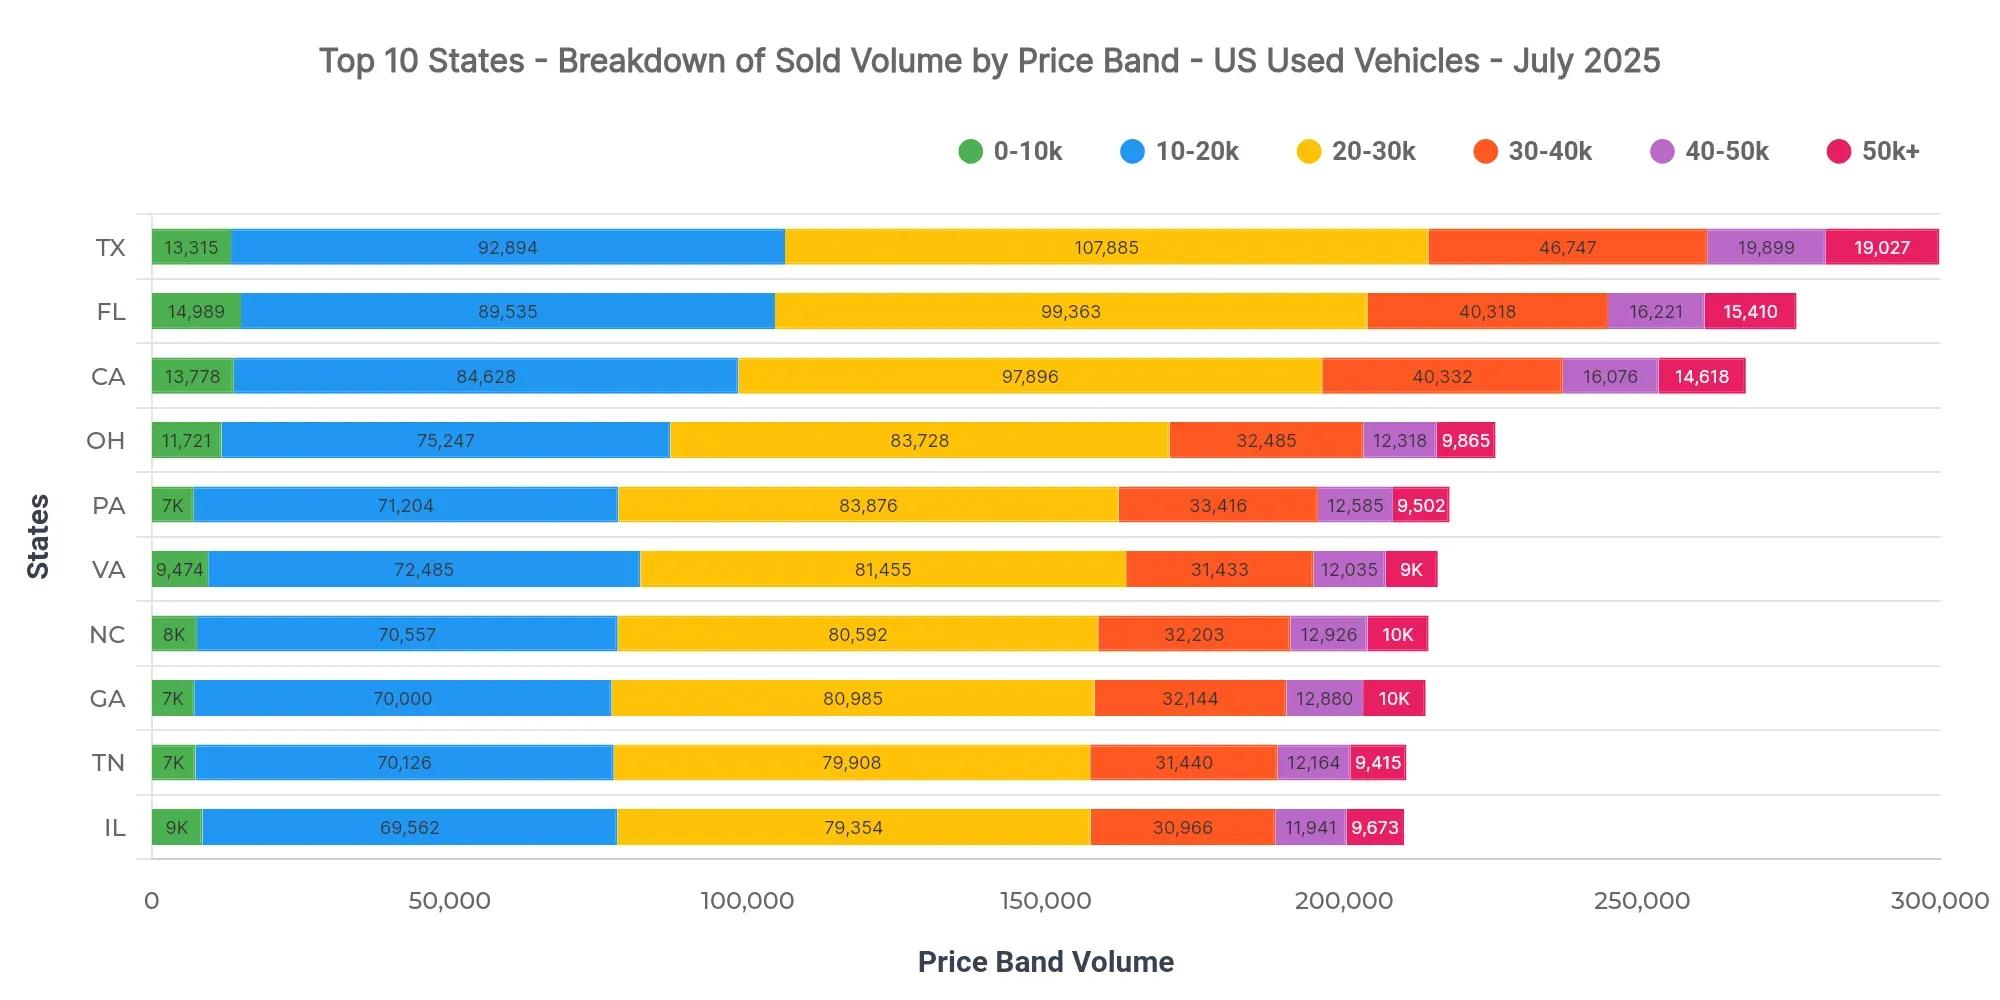
In Texas, dominant price bands are $20K–$30K (36%), $10K–$20K (31%), and $30K–$40K (15.6%). The $40K–$50K band holds a notable share of 6.6%. Florida at $25,769 and California at $26,277 show slightly higher average sold prices compared to Texas. Dealers should focus on the lower to mid-tier price bands catering to the largest buyer segment. Ensuring inventory aligns with these bands could optimize sales performance and market entry strategies.
Market Breakdown by Fuel Types
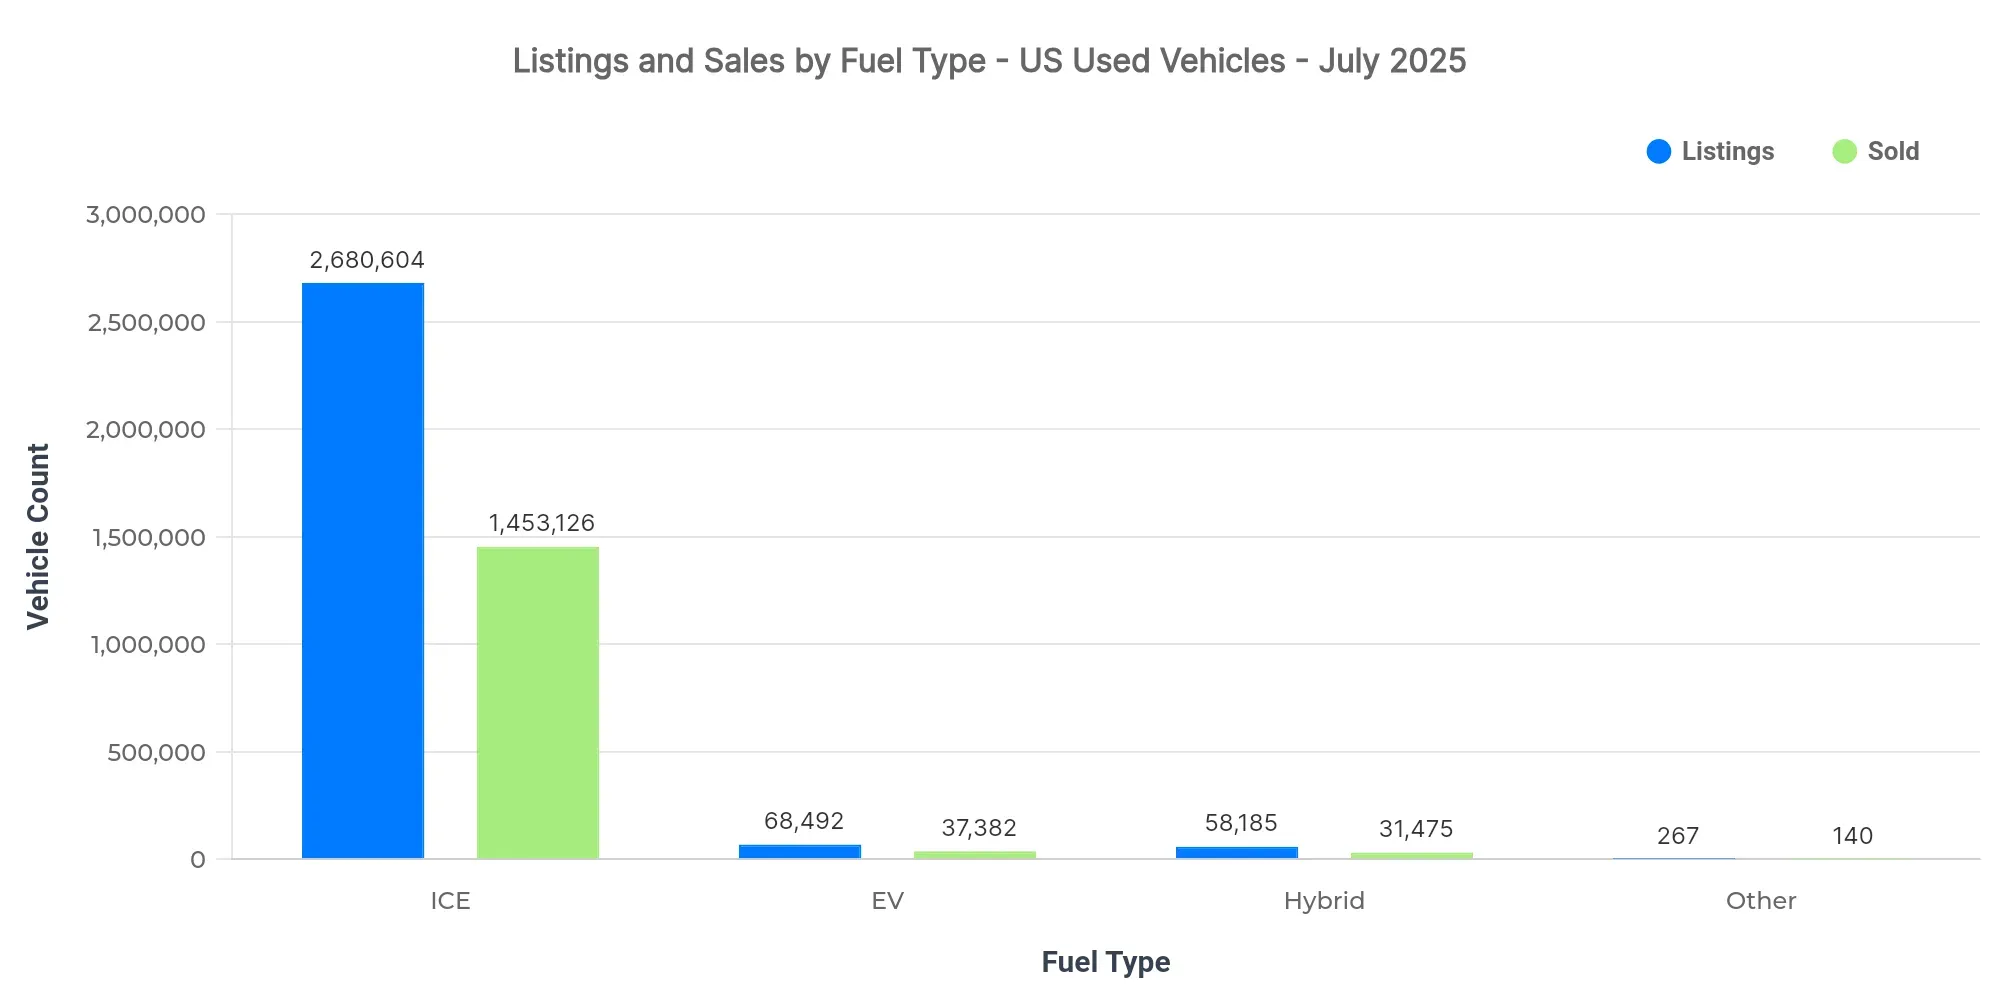
| Fuel Type | Listings Count | Sold Count | Avg Listing Price | Avg Sold Price |
|---|---|---|---|---|
| ICE | 2.68M | 1.45M | $26,199 | $25,724 |
| EV | 68.49K | 37.38K | $33,565 | $30,563 |
| Hybrid | 58.19K | 31.48K | $29,946 | $26,576 |
| Other | 267 | 140 | $13,522 | $13,236 |
- Electric vehicle (EV) adoption is gaining traction, though still outpaced by internal combustion engines (ICE).
- Price positioning shows EVs with higher listing and sold prices, indicating a premium market segment.
- Market dynamics suggest a shift towards embracing more sustainable fuel types.
Market Share by Body Types
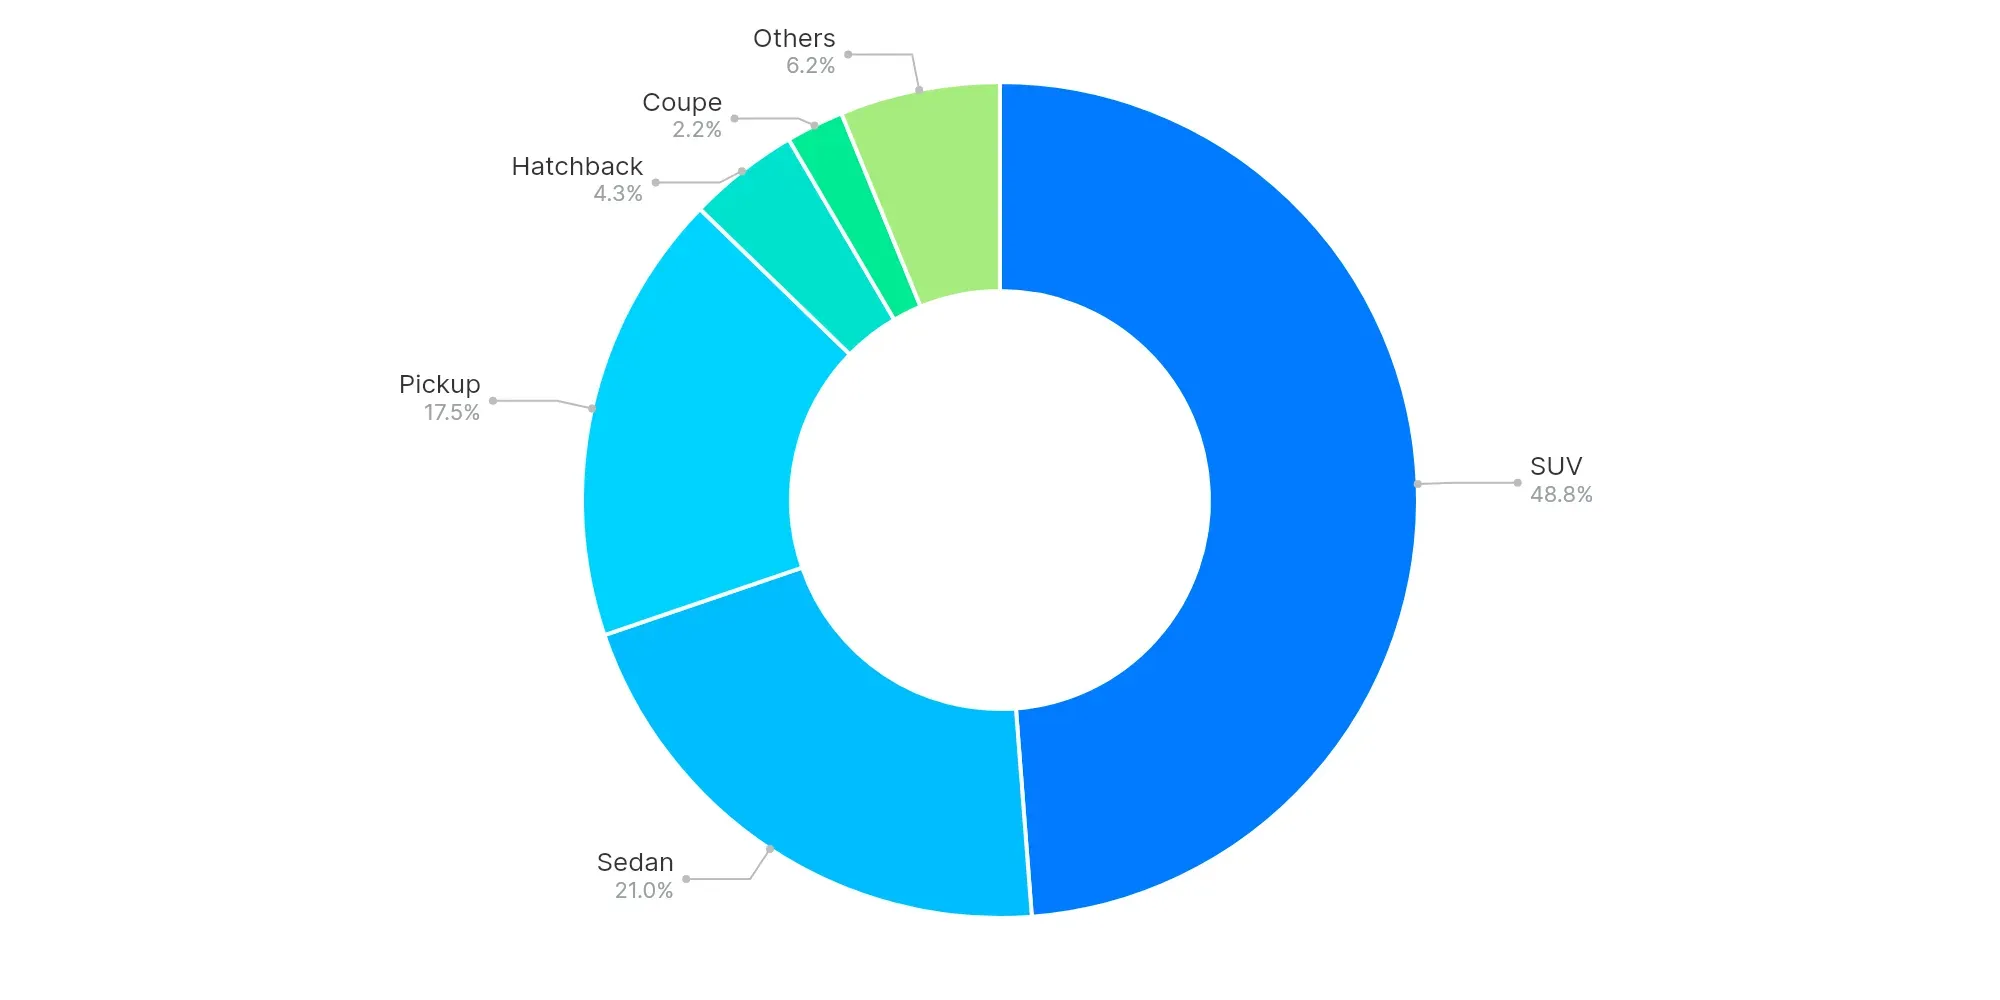
SUV (48.8%), Sedan (21%), and Pickup (17.5%) lead the market. The dominance of SUVs and Pickups reflects a consumer preference for larger vehicle segments, likely driven by versatility and perceived safety benefits. There is a continued consumer trend favoring these body types over others such as Hatchbacks and Sedans.
High-Volume vs Low-Volume States (Executive Insights)
- Top-performing states: Texas, Florida, California
- Underpenetrated regions: Virgin Islands, American Samoa, Northern Mariana Islands
- Key price bands: $20K–$30K, $10K–$20K, $30K–$40K
- EV trend: Growing interest, high premium
- Buyer preferences: Leaning towards larger body types with diverse fuel options
The US used car market in July 2025 shows stable performance with regional variations presenting opportunities. Dealers and analysts should leverage these insights to refine inventory strategies and better align with consumer demand patterns, focusing on key segments and emerging trends to capture market share effectively.