

US Monthly Used Car Market Data – July 2024
This report provides an analysis of the US used vehicle market in July 2024, focusing on dealer activity, sales volume, pricing, fuel types, body types, and regional performance.
Number of Dealerships by State
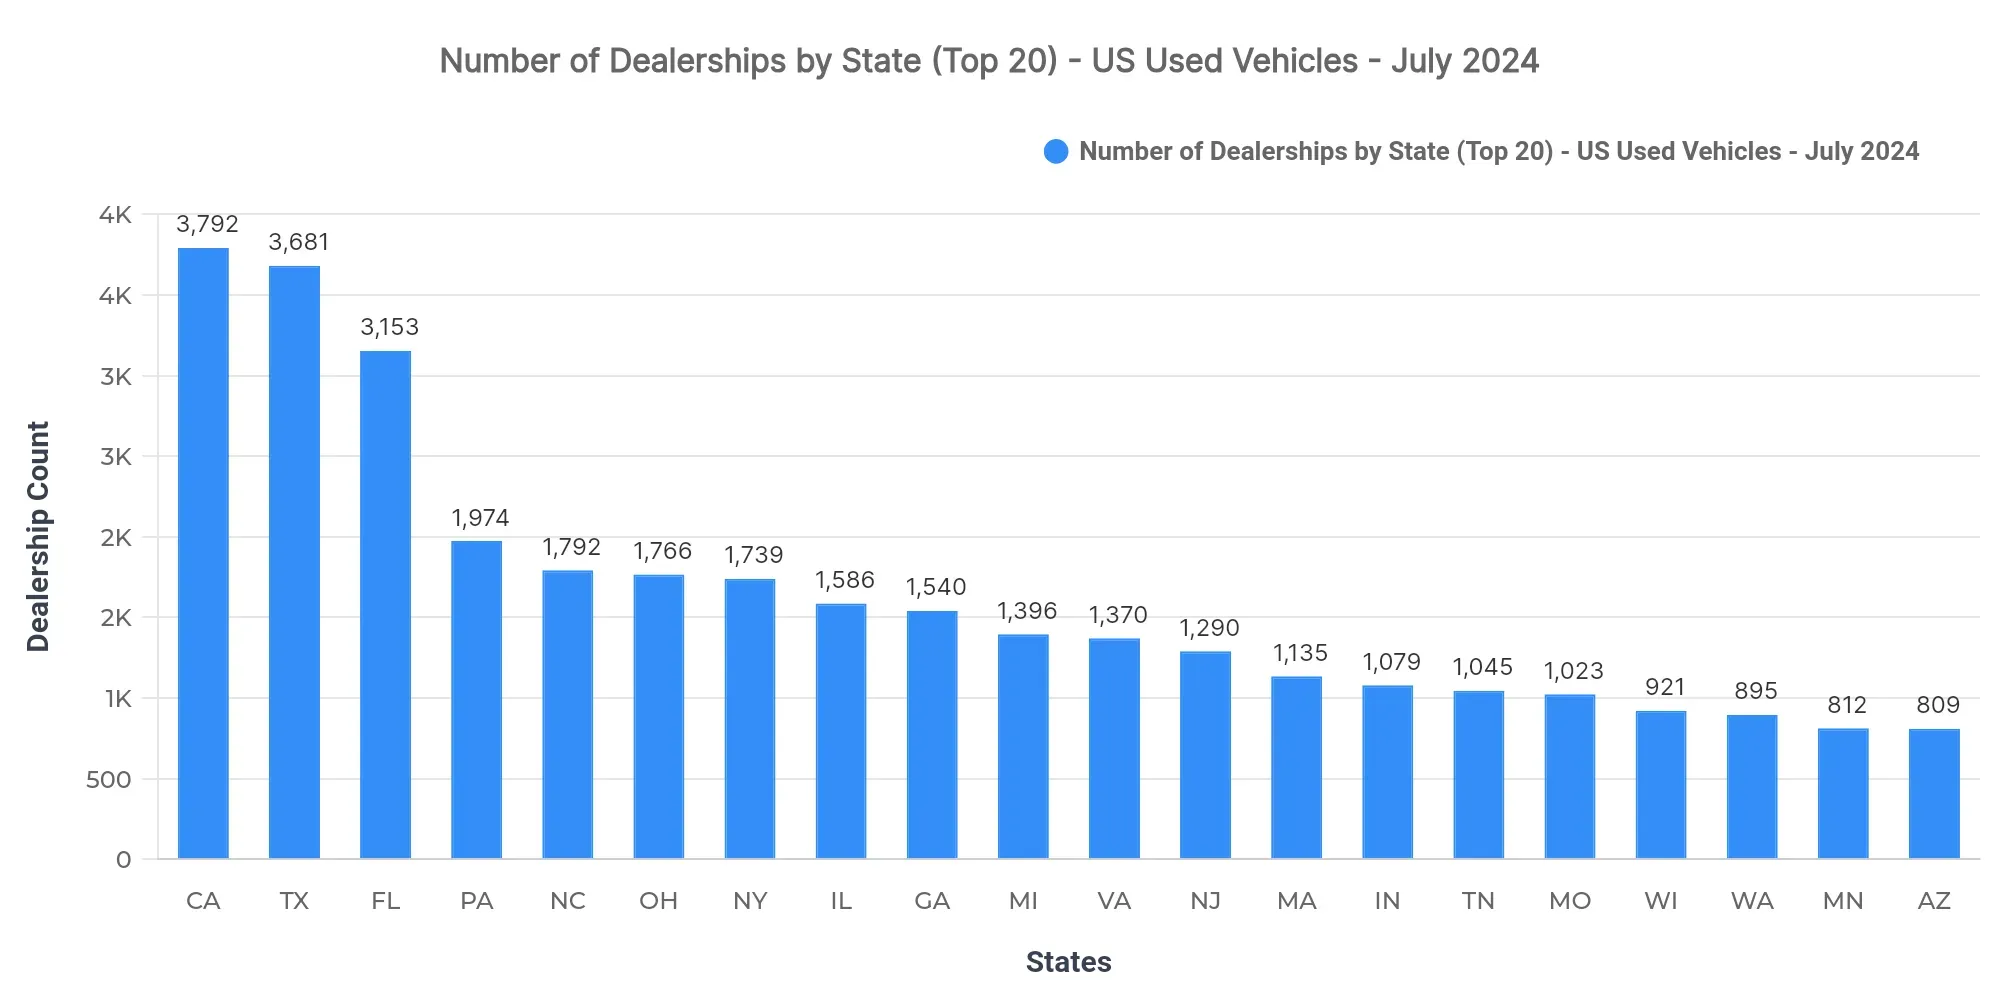
California (3,792), Texas (3,681), and Florida (3,153) lead in the number of dealerships. This concentration suggests a significant market influence by the states with the highest dealership counts, creating competitive environments that can suppress pricing margins.
Top 10 States by Sold Volume
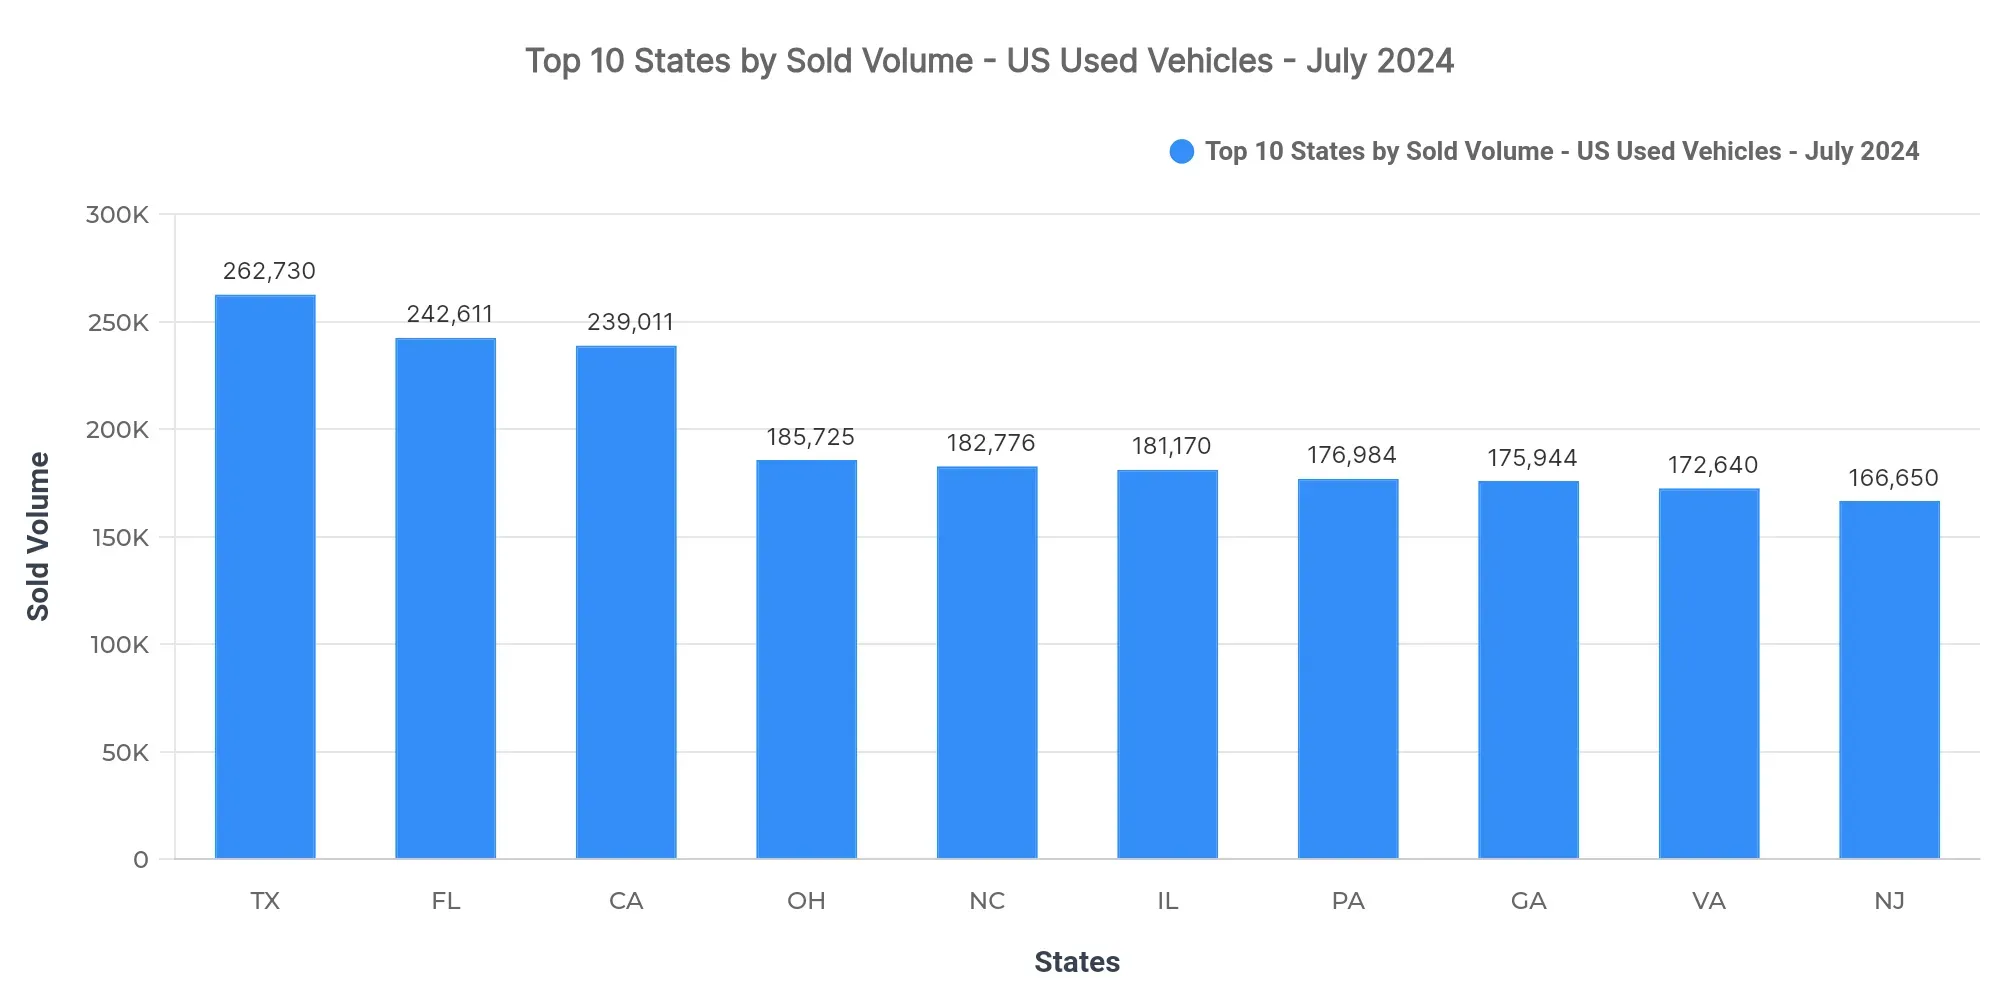
Texas (262,730), Florida (242,611), and California (239,011) lead. The top 3 states together represent 11.6% of the national sold volume. The remaining top-10 states are Ohio, North Carolina, Illinois, Pennsylvania, Georgia, Virginia, and New Jersey.
These states are pivotal in market concentration, indicating regional demand and dealership strategies heavily influence national statistics. The data reflect strong vehicle turnover rates in the southern and coastal regions, suggesting a steady consumer demand and preference for used cars in these locales.
Price Breakdown: Top 10 States by Sold Volume
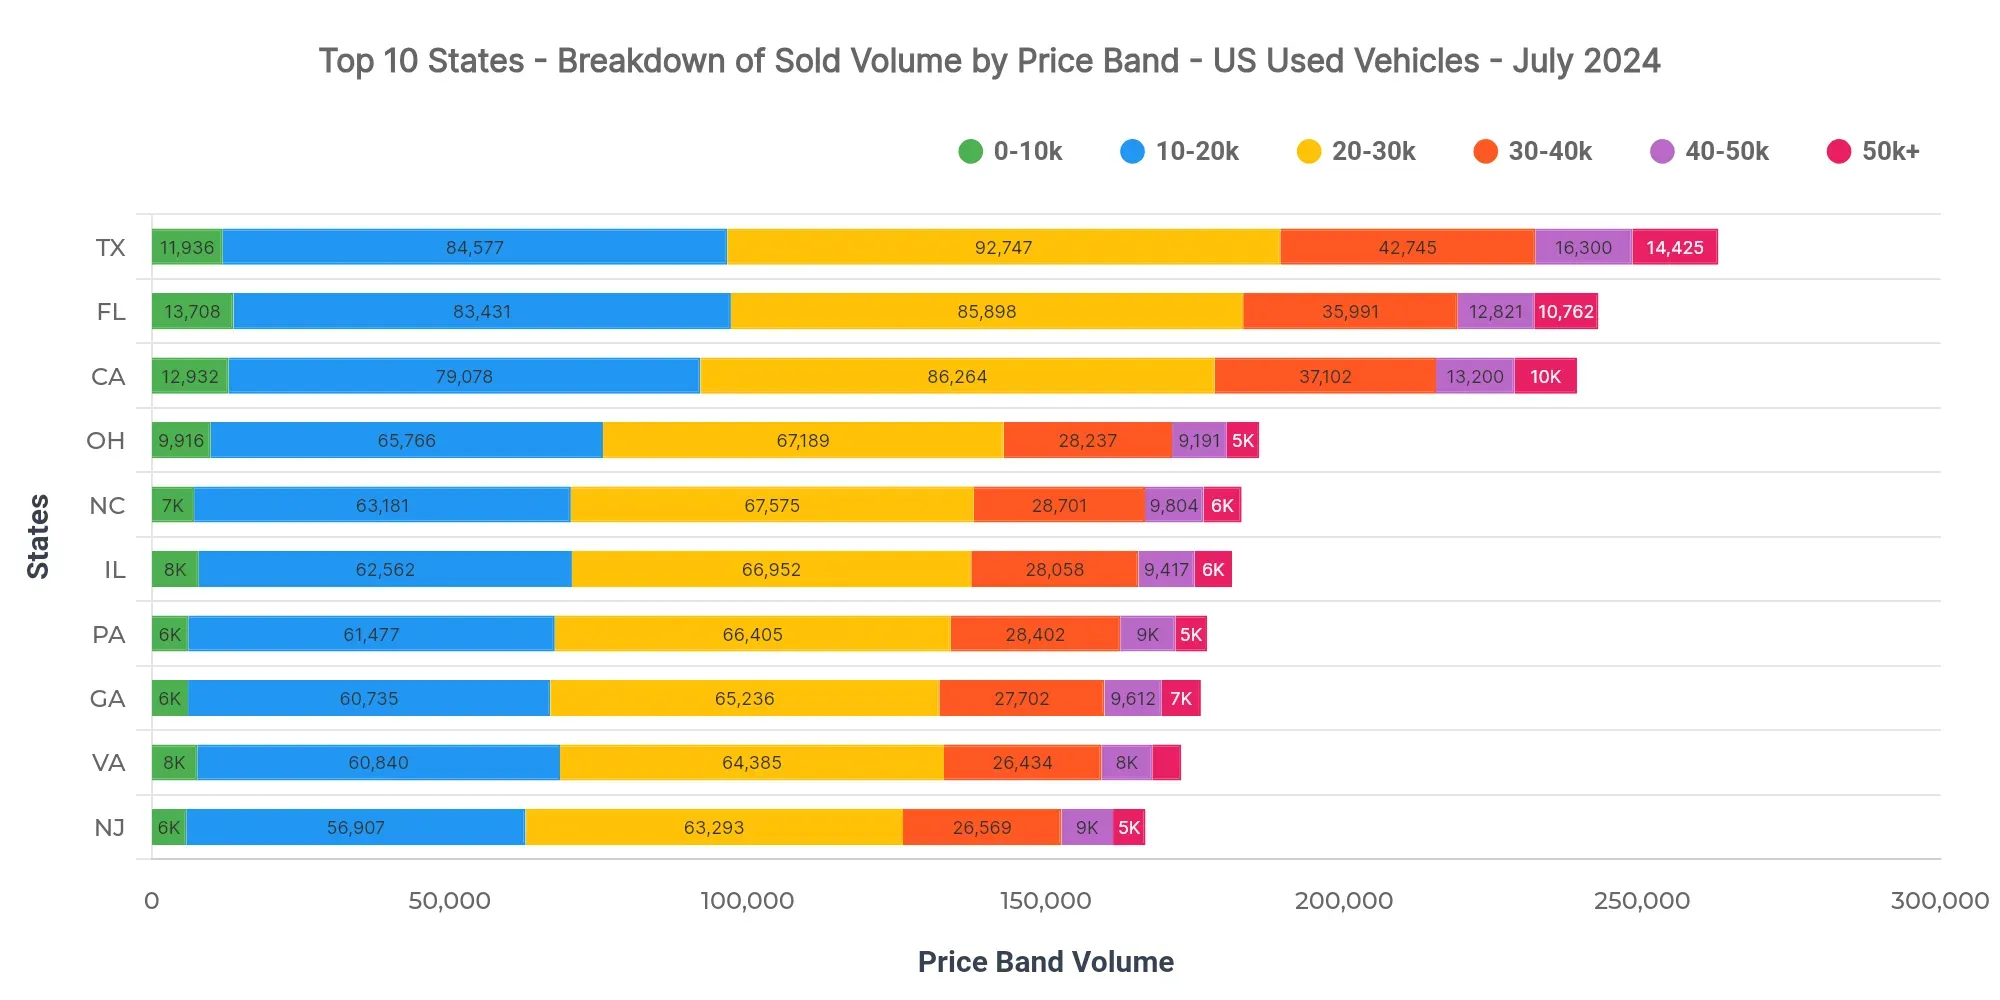
In Texas, the top-selling state, the $20K–$30K (35.3%), $10K–$20K (32.2%), and $30K–$40K (16.3%) bands dominate. The $40K–$50K band holds 6.2%, indicating its importance in higher-end sales strategies. Comparatively, Florida averages $25,411 and California $26,018 in sold prices.
For dealers, targeting the dominant mid-price bands could maximize inventory turnover. Pricing strategies should account for higher lending rates in upper bands, catering to premium buyers.
Market Breakdown by Fuel Types
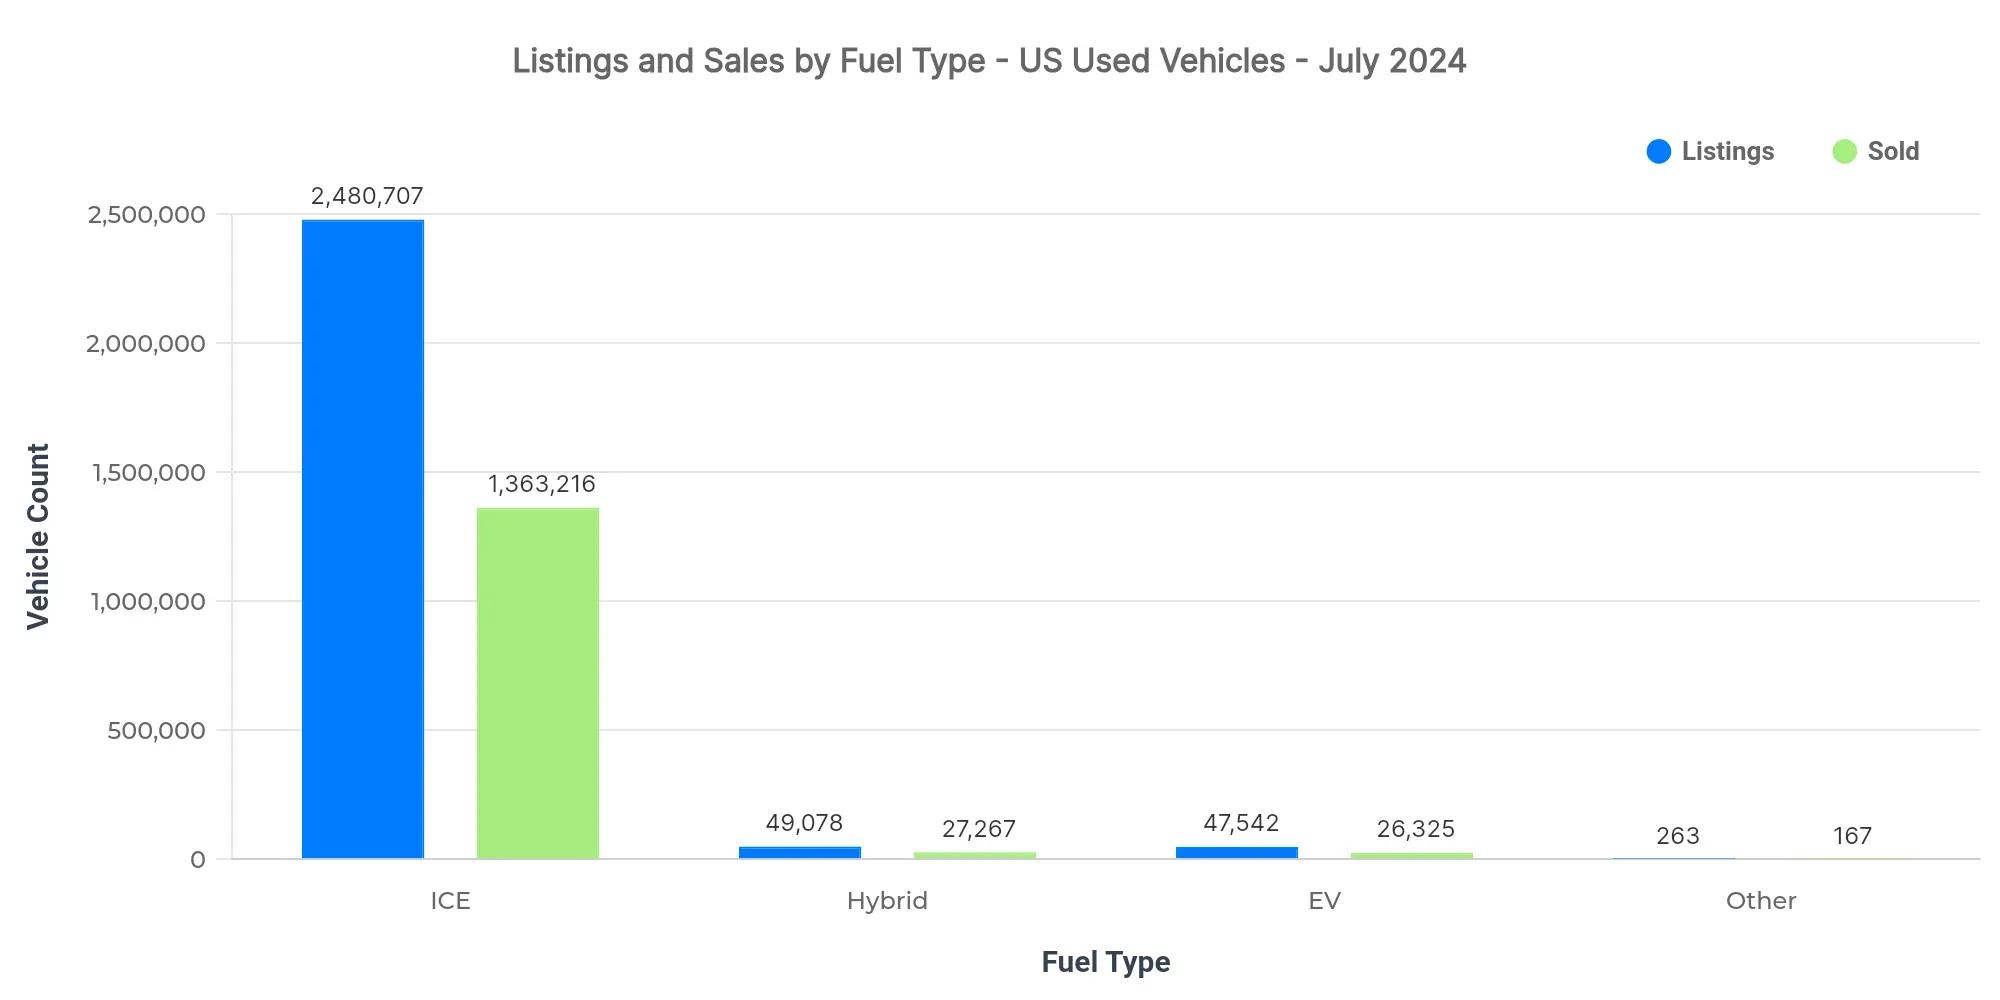
The market data by fuel type shows ICE vehicles remain the cornerstone, dominating both listings and sales. EVs and hybrids, however, maintain higher average prices, indicating a premium positioning in the market.
| Fuel Type | Listings Count | Sold Count | Avg Listing Price | Avg Sold Price |
|---|---|---|---|---|
| ICE | 2.48M | 1.36M | $25,897 | $25,355 |
| Hybrid | 49.1K | 27.3K | $27,862 | $26,289 |
| EV | 47.5K | 26.3K | $34,674 | $31,832 |
| Other | 0.3K | 0.2K | $16,133 | $15,635 |
- EVs report steady adoption, yet ICE vehicles remain dominant.
- Premium pricing for hybrids and EVs reflects growing interest but slower turnover compared to ICE.
- Supply chain dynamics for new vehicle production continue to nudge used vehicle inventory and pricing.
Market Share by Body Types
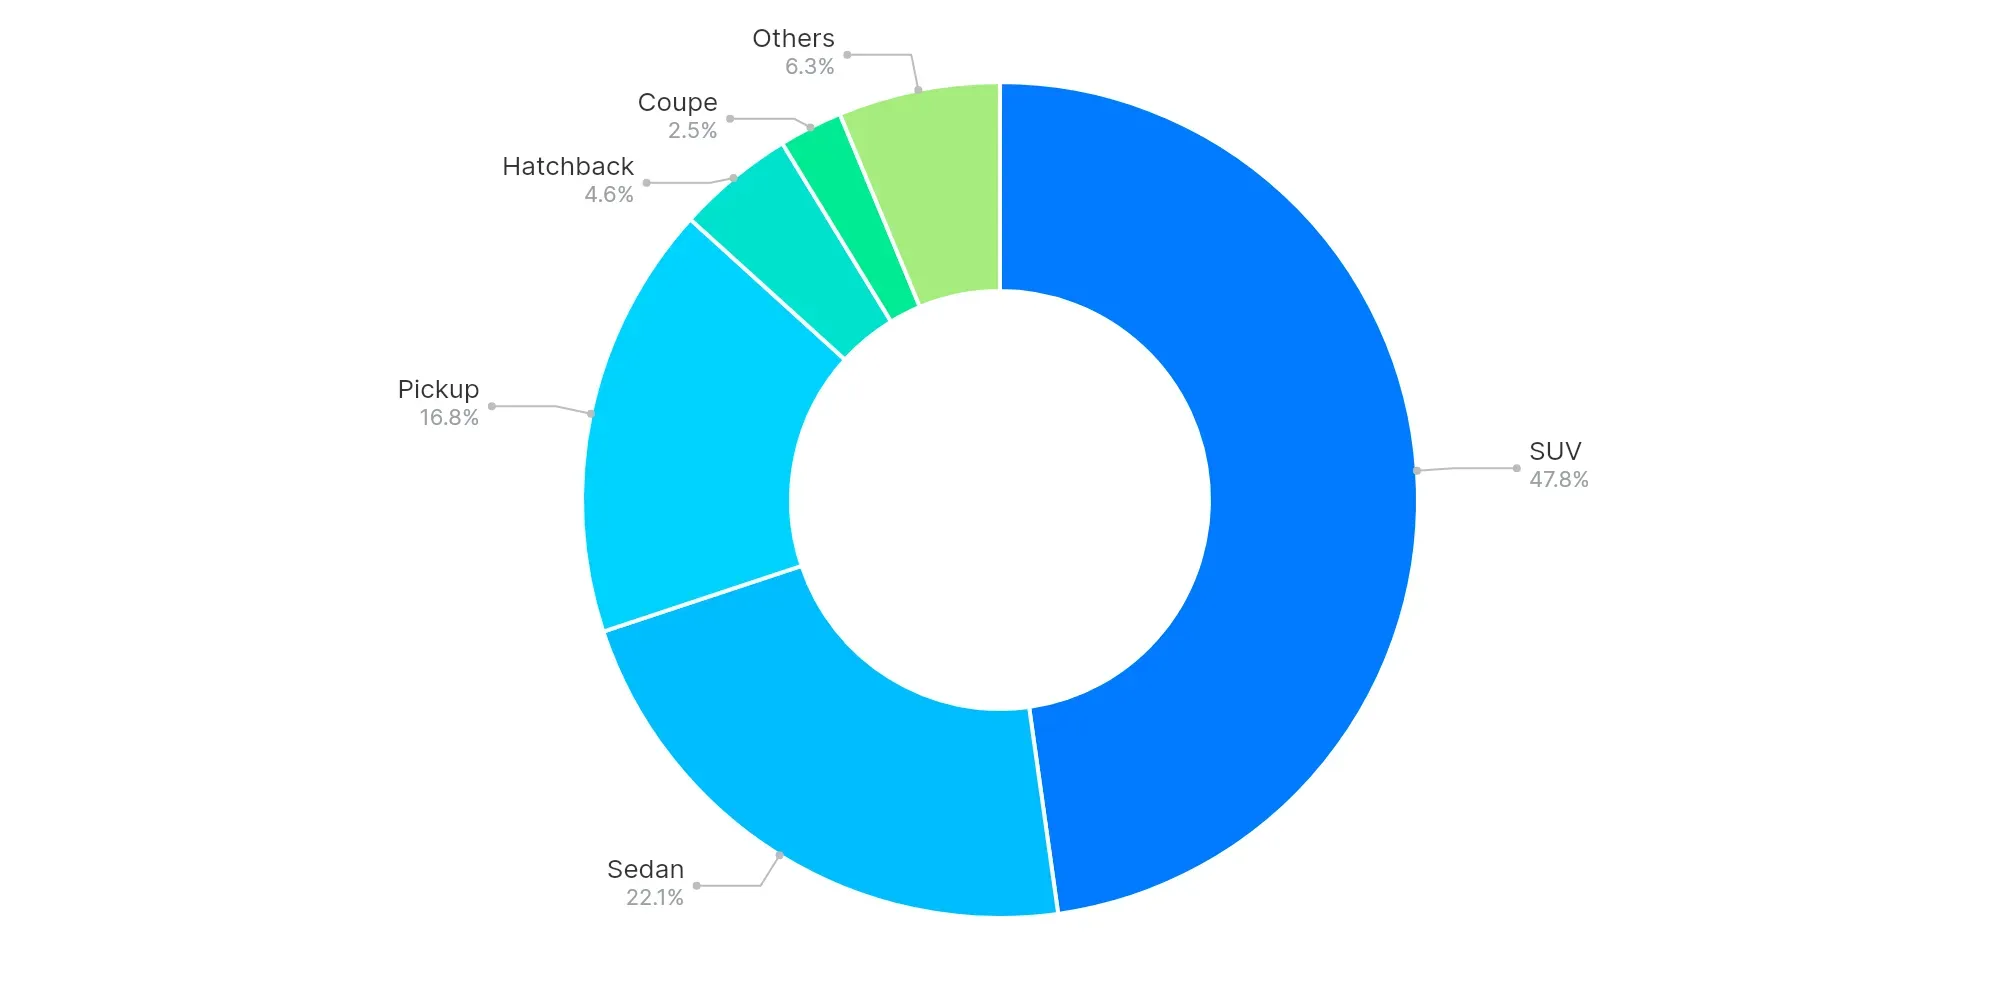
SUVs (47.8%), Sedans (22.1%), and Pickups (16.8%) dominate the market. SUVs and Pickups highlight consumer preference toward larger vehicles.
Consumer trends indicate a persistent shift towards SUVs, possibly driven by utility and perceived value, while pickups cater to both personal and commercial needs.
High-Volume vs Low-Volume States (Executive Insights)
- Texas, Florida, and California excel in sales volume.
- Underpenetrated regions include American Samoa, U.S. Virgin Islands, and Northern Mariana Islands.
- Key price bands in influential states hover around $10K–$40K.
- EV trend indicates increased premium interest.
- Buyers show a clear preference for SUVs and mid-range cars.
The market momentum indicates a solid performance with distinct regional preferences. For dealers, aligning inventory with regional consumer demand and maintaining flexible price strategies are critical. Embracing emerging trends, particularly in EV and hybrid segments, could offer growth potential in an evolving market landscape.