

US Monthly Used Car Market Data – January 2026
The January 2026 report provides insights into the US used vehicle market, focusing on dealer activity, sales volume, and pricing. It also examines the influence of fuel and body types on market trends and evaluates regional performance across states.
Number of Dealerships by State
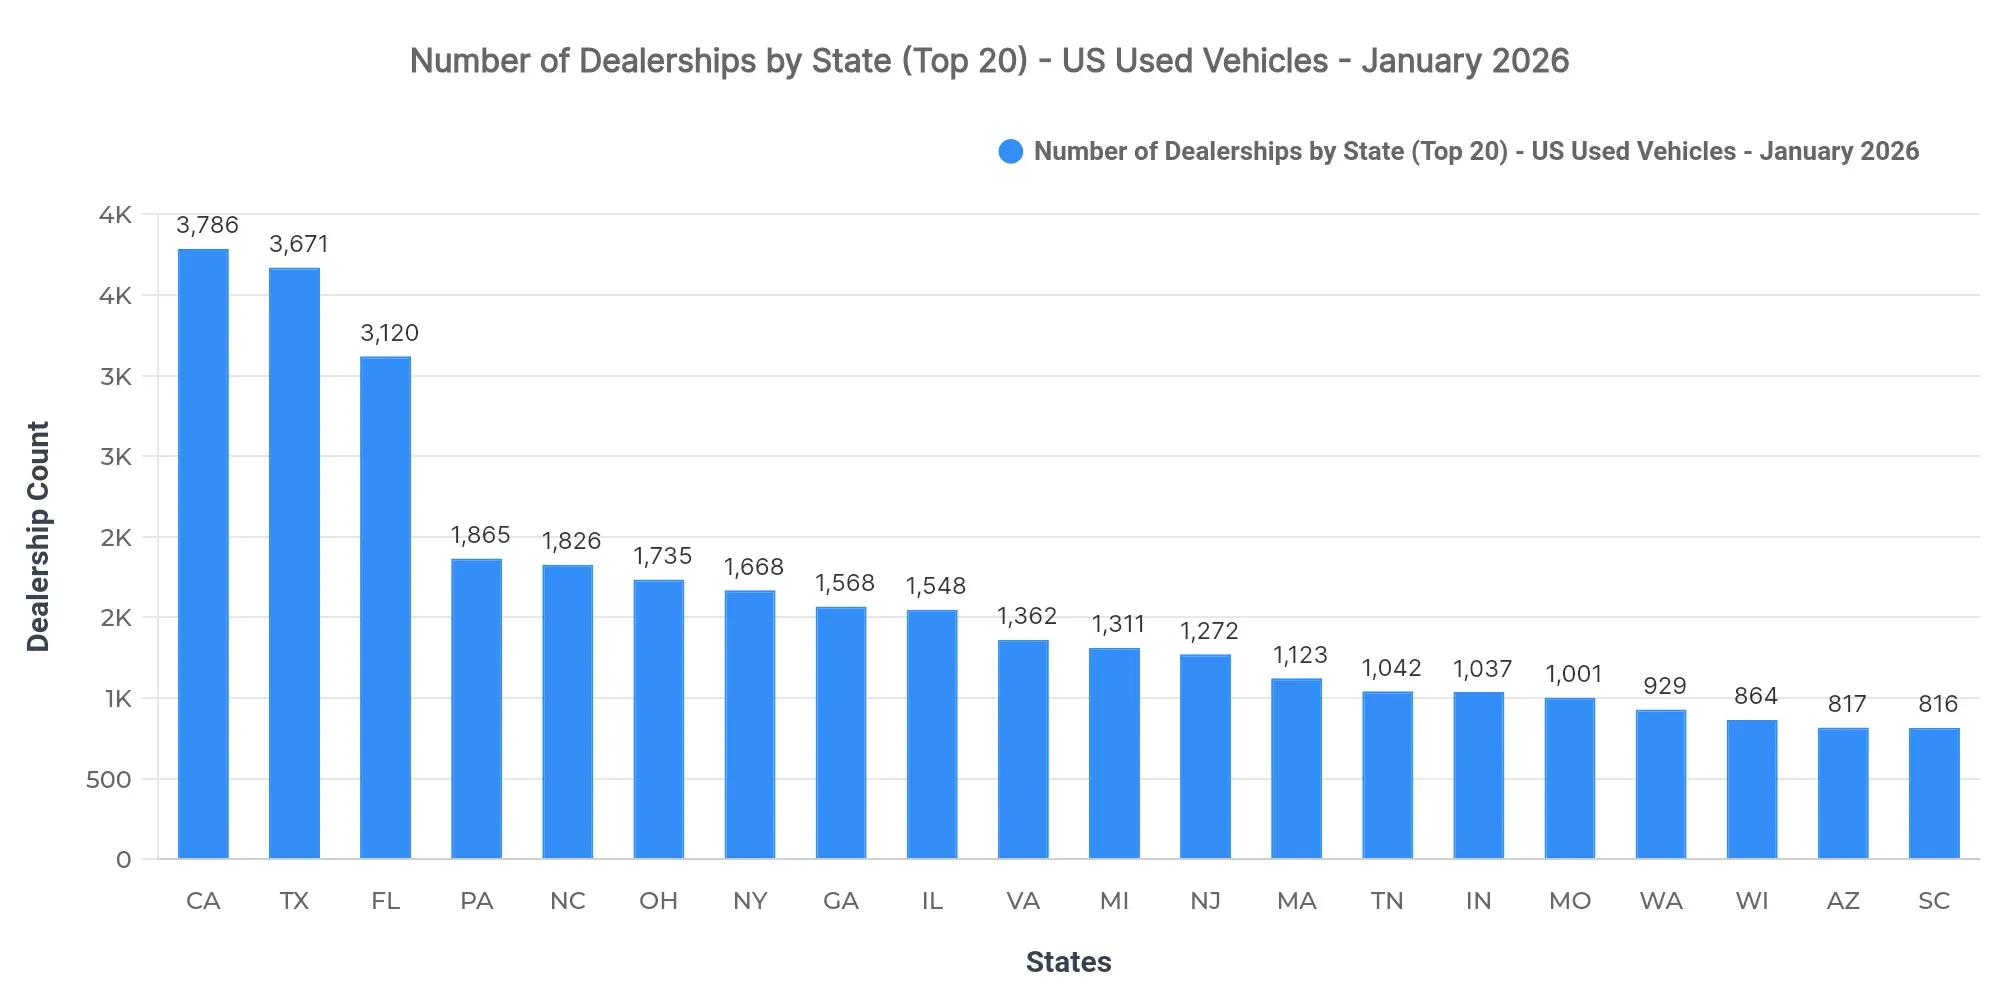
California (3,786), Texas (3,671), and Florida (3,120) lead the US with the highest dealership counts. This concentration suggests that these states are pivotal hubs for used car sales activity. It is crucial for dealers to recognize the saturation in these markets, which may lead to stiff competition.
Top 10 States by Sold Volume
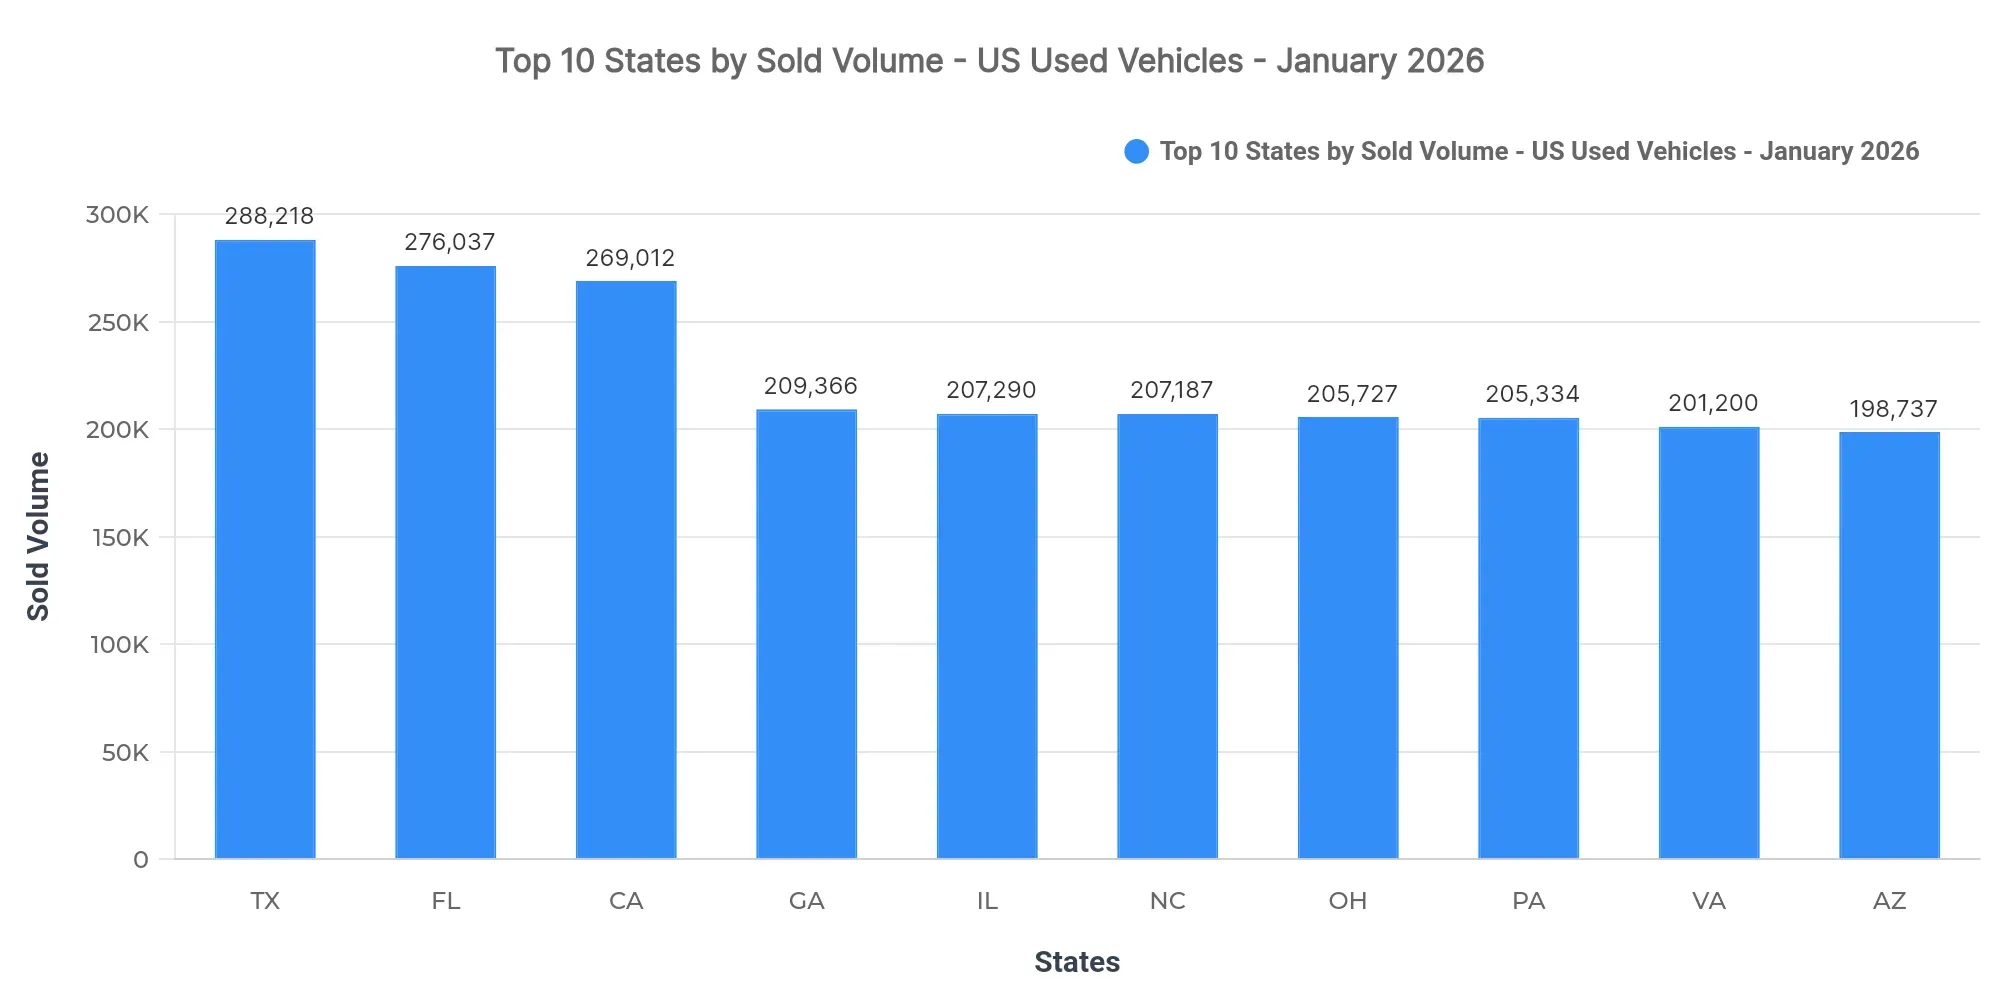
Texas (288,218), Florida (276,037), and California (269,012) lead in sold volumes, collectively accounting for 11.2% of the national sold volume. The remaining top 10 states include Georgia, Illinois, North Carolina, Ohio, Pennsylvania, Virginia, and Arizona. The high concentration of sales in these states signals significant consumer demand, with these markets typically driving used vehicle sales trends more than other regions.
Market concentration in these top states underscores the sustained demand and opportunity for dealers to maximize their sales strategies. Regional demand patterns reveal a notable East Coast influence, particularly among southeastern states, suggesting a regional affinity for used car purchases.
Price Breakdown: Top 10 States by Sold Volume
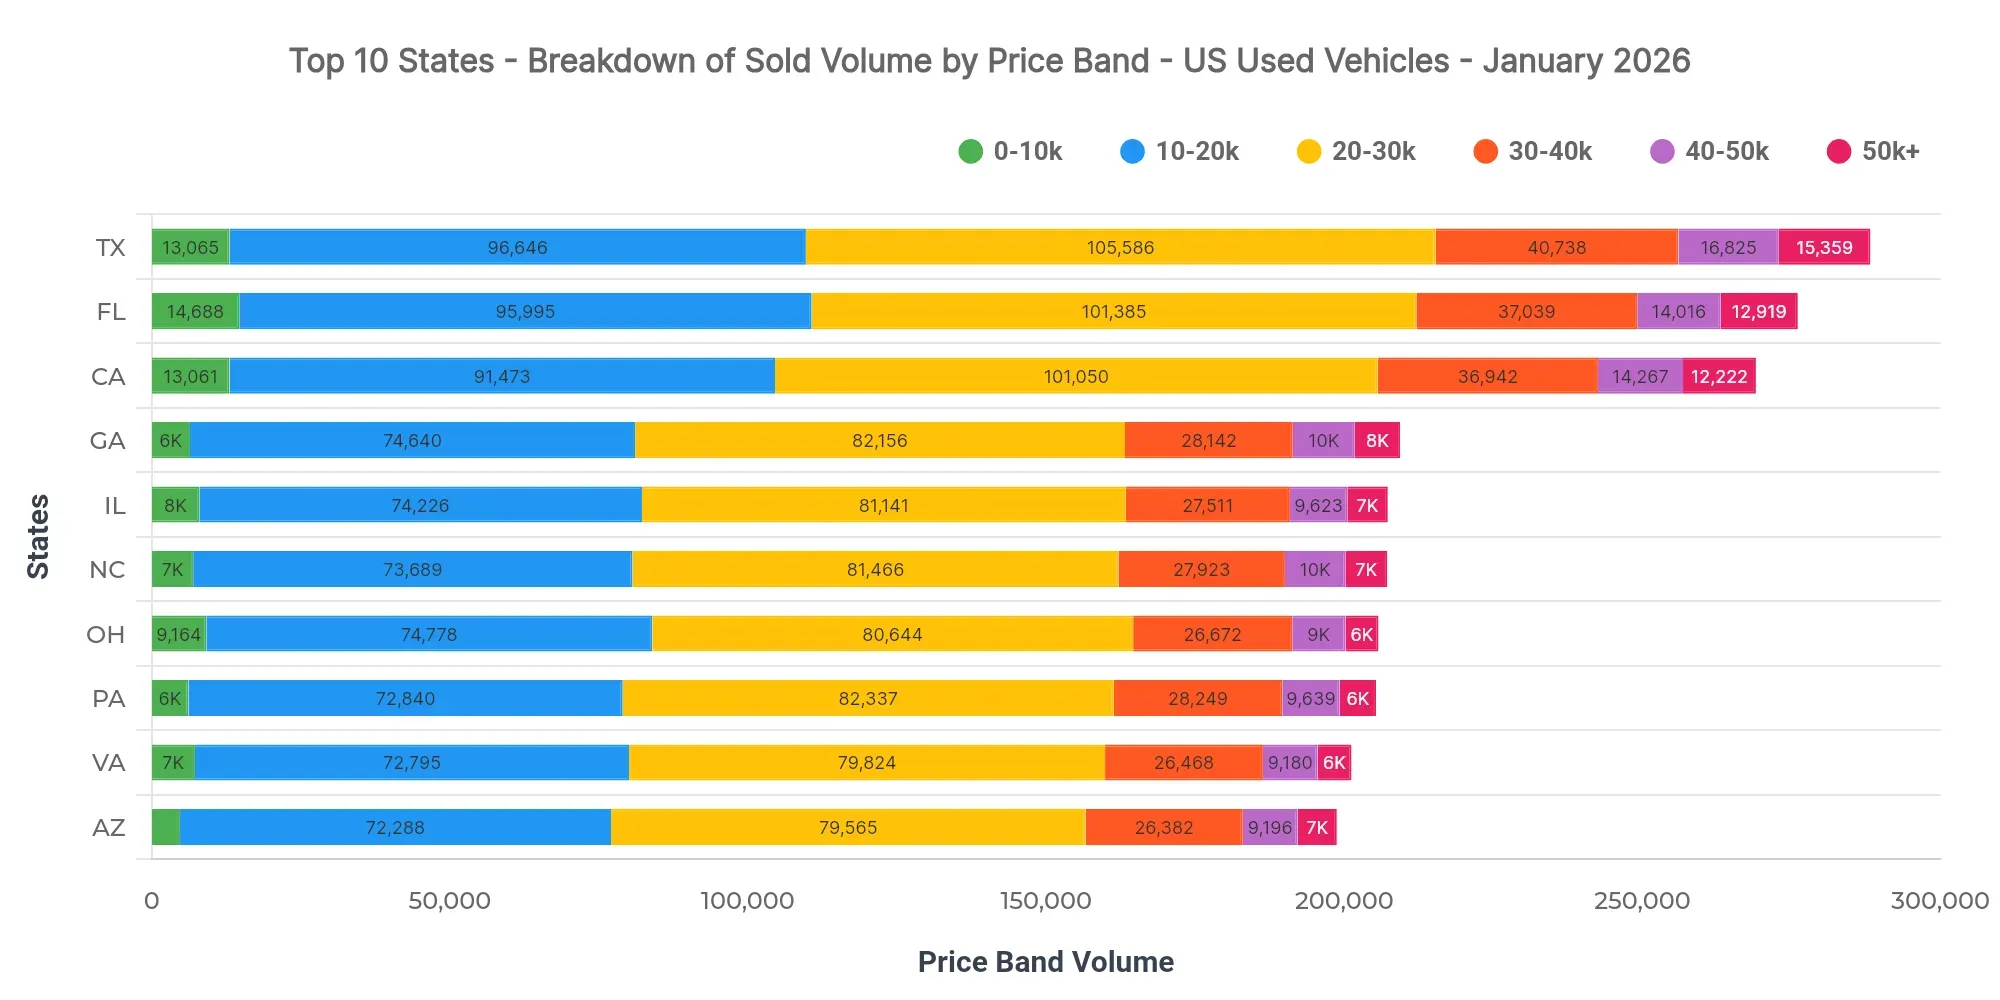
In Texas, the dominant price bands are $20K–$30K (36.6%), $10K–$20K (33.5%), and $30K–$40K (14.1%). An additional band of interest is the $40K–$50K range with a 5.8% share, indicating a competitive upper-price segment. Florida at $24,929 and California at $25,302 showcase marginally lower average sold prices compared to Texas.
Dealers should prioritize inventory in the mid-range price bands to align with consumer preferences in high-volume markets. Pricing and lending strategies should accommodate competitive financing options for the $20K–$40K range to boost sales.
Market Breakdown by Fuel Types
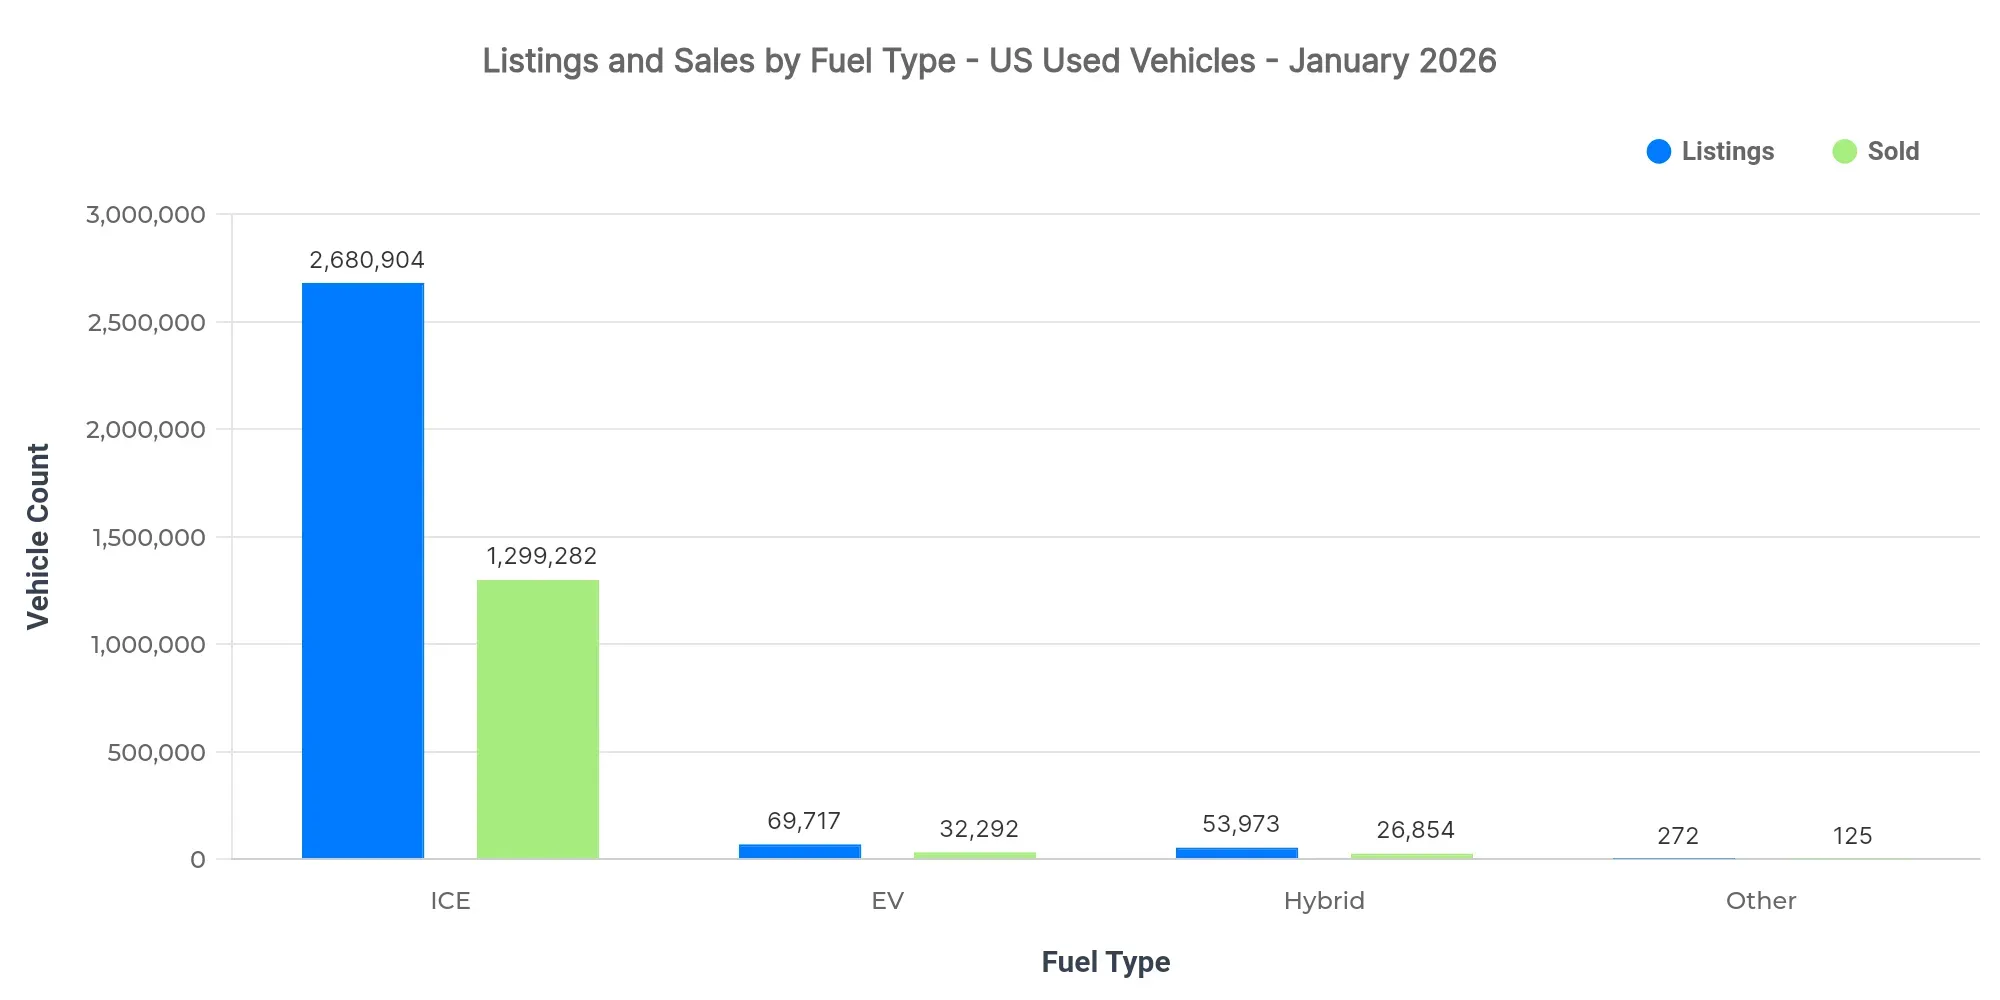
ICE vehicles dominate both sales (1.299M) and listings (2.681M), maintaining a lead in the market. EVs, though accounting for fewer units, remain a lucrative segment with a notable premium pricing strategy over ICE vehicles. Hybrids present a balanced approach between cost and environmental considerations.
| Fuel Type | Listings Count | Sold Count | Avg Listing Price | Avg Sold Price |
|---|---|---|---|---|
| ICE | 2.68M | 1.30M | $23,412 | $24,816 |
| EV | 69.7K | 32.3K | $31,348 | $30,690 |
| Hybrid | 53.9K | 26.9K | $27,111 | $26,067 |
| Other | 272 | 125 | $10,360 | $12,411 |
- EV adoption is gradually increasing but remains constrained by higher pricing.
- Pricing strategies should reflect the premium nature of EVs and their growing attraction.
- ICE vehicles remain the backbone of the market, offering consistency in volume and pricing.
Market Share by Body Types
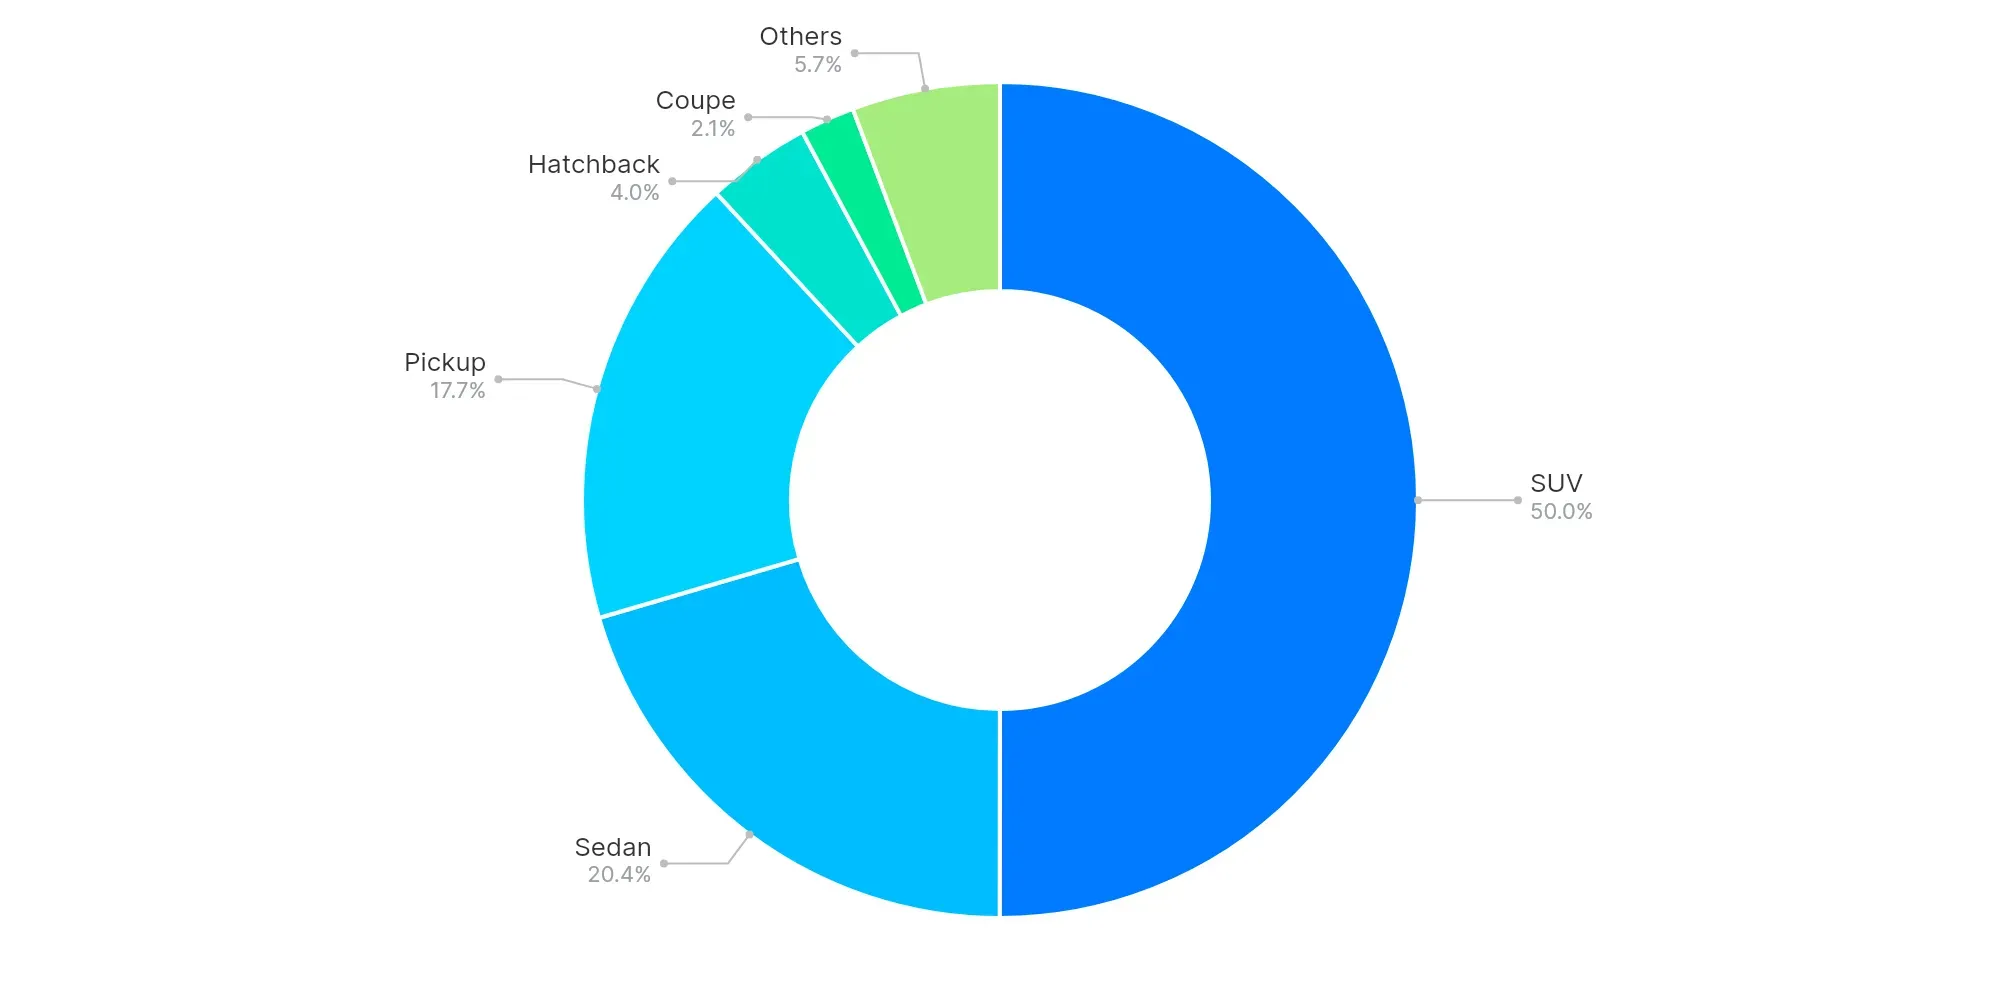
SUVs (50%), Sedans (20.4%), and Pickups (17.7%) top the market share by body type. The dominance of SUVs and Pickups emphasizes the consumer preference for larger vehicles suitable for varied lifestyles and utility.
Consumer preferences are shifting slightly towards versatile and spacious vehicles, aligning with changing lifestyle demands across generations.
High-Volume vs Low-Volume States (Executive Insights)
- Texas, Florida, California lead in sold volume.
- Underpenetrated regions: Virgin Islands, American Samoa, and Northern Mariana Islands.
- Key price bands: $20K–$30K, $10K–$20K, and $30K–$40K.
- EV trends show growth opportunities.
- Buyer preferences lean towards larger vehicle types, specifically SUVs.
The US used car market remains robust with significant regional variations. Actionable strategies for dealers include leveraging competitive pricing within key bands and aligning inventories with regional consumer trends. Recognizing the growing EV market could provide a competitive edge in future market landscapes.