

US Monthly Used Car Market Data – January 2025
This report examines dealer activity, sales volume, pricing, fuel types, body types, and regional performance within the US used vehicle market for January 2025. The analysis highlights variations across different segments of the market, providing key insights into current trends and future implications.
Number of Dealerships by State
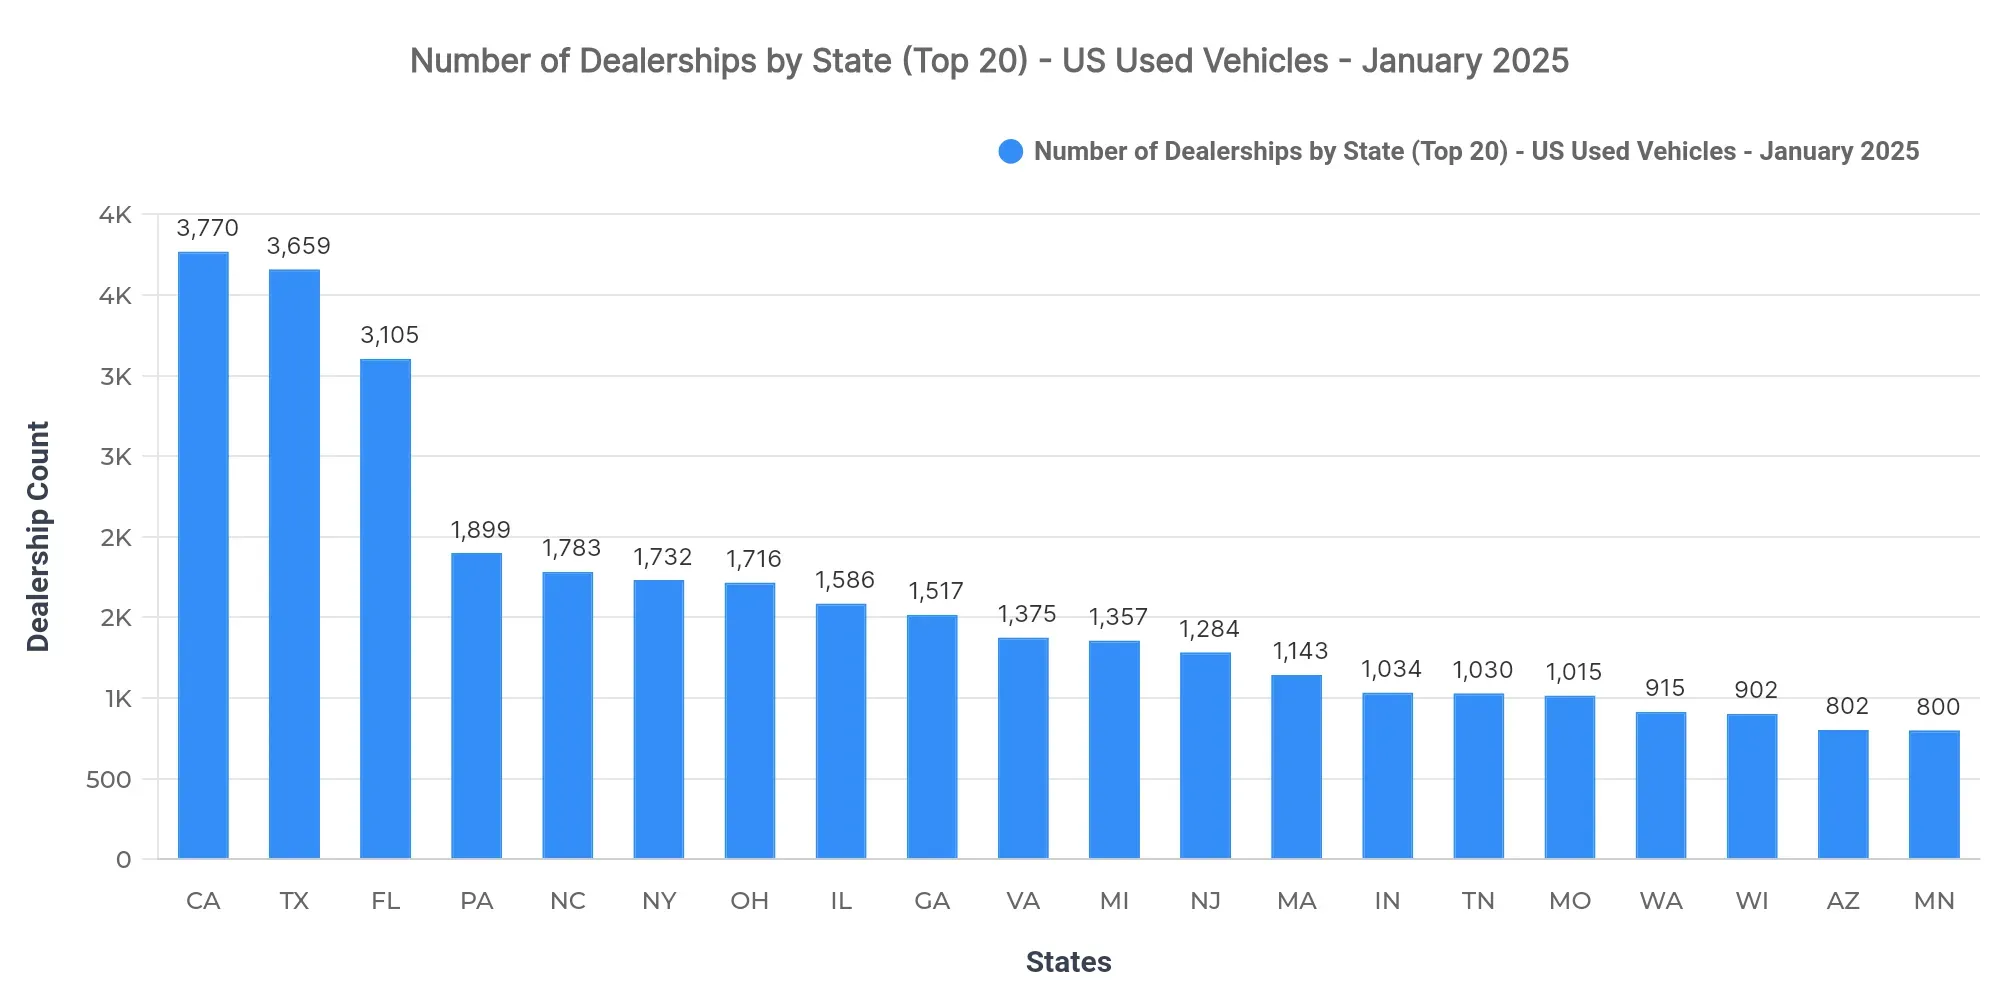
California (3,770), Texas (3,659), and Florida (3,105) lead in dealership counts. This concentration of dealerships in populous states suggests a market saturation in those regions, potentially leading to more competitive pricing and varied inventory for consumers. The high dealership density in these states reflects a strong market infrastructure capable of handling large sales volumes.
Top 10 States by Sold Volume
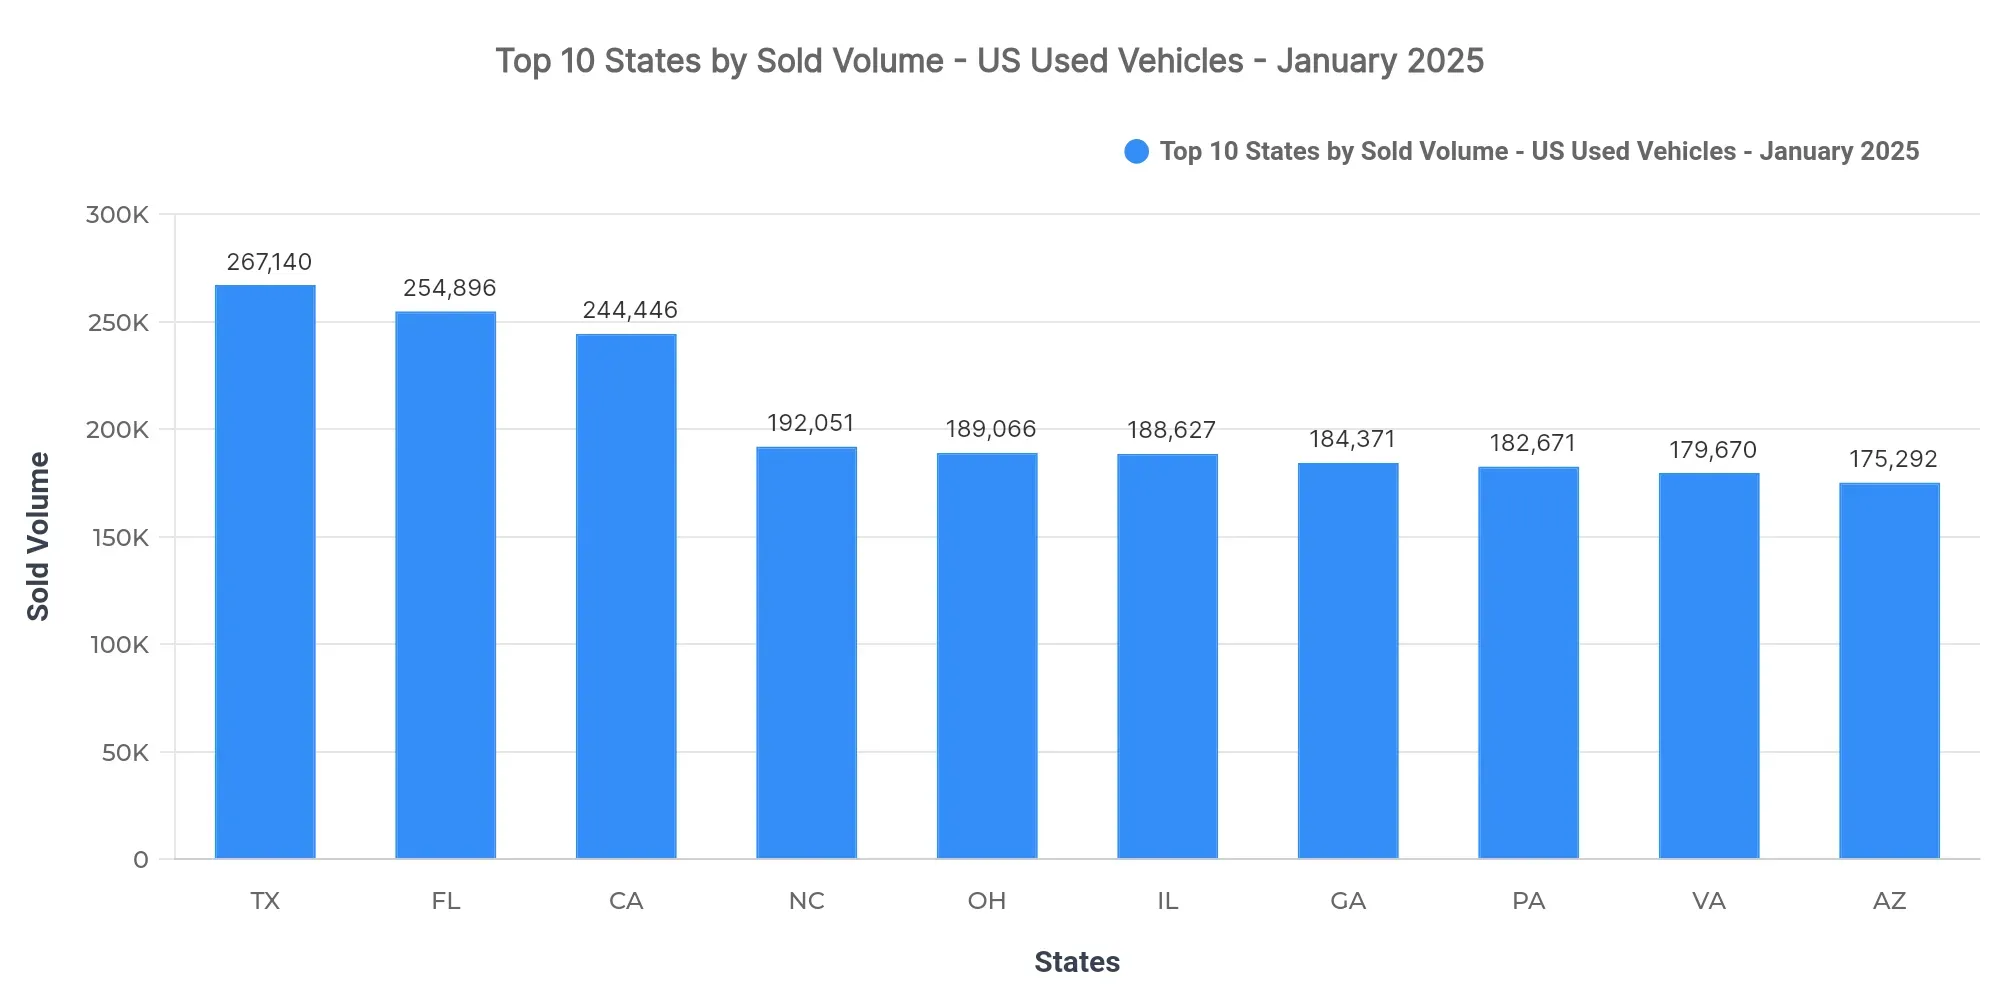
Texas (267,140), Florida (254,896), and California (244,446) lead in sold volume. Combined, these top states account for 11.5% of the national sold volume. The other top-selling states are North Carolina, Ohio, Illinois, Georgia, Pennsylvania, Virginia, and Arizona.
The dominance of these states in sales volume suggests a strong market concentration, with significant demand in these regions likely driven by high population density and economic activity. Regional demand patterns show a clear preference for used vehicles in states with larger urban and suburban populations, reflecting economic resilience in these areas.
Price Breakdown: Top 10 States by Sold Volume
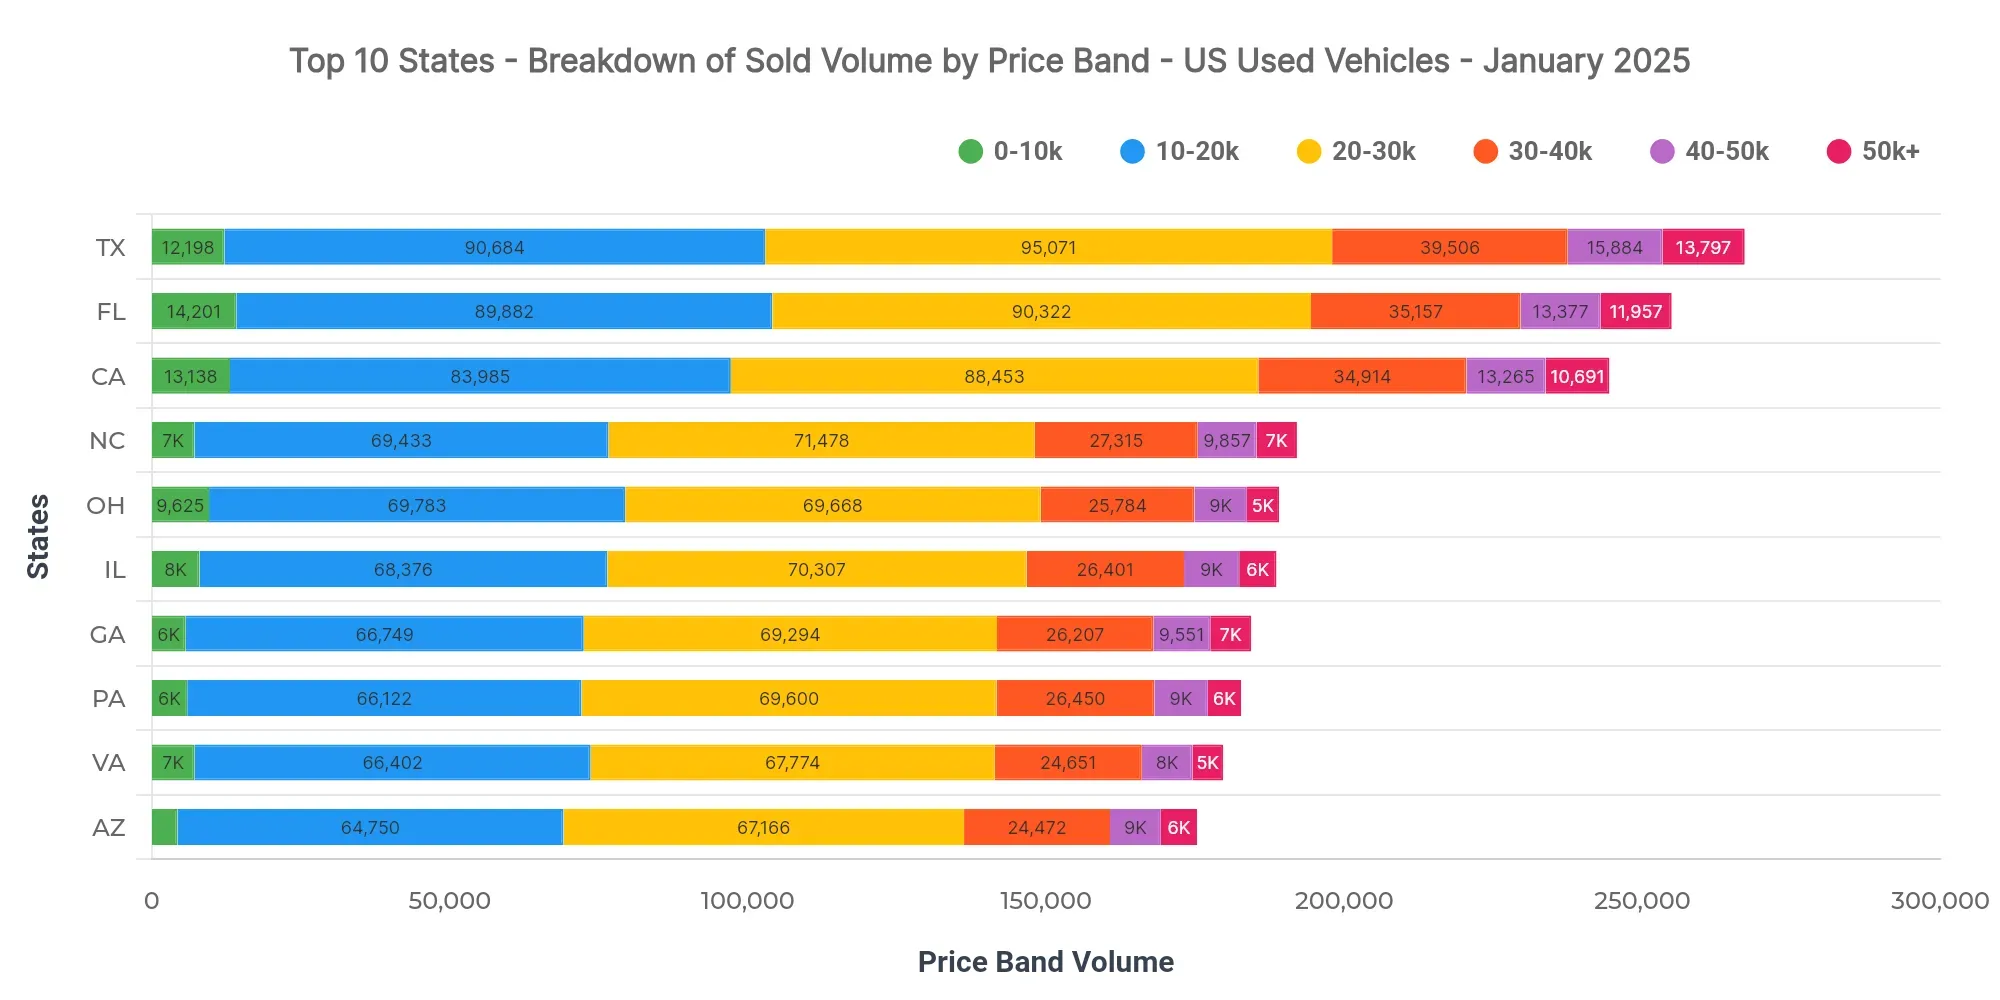
In Texas, the dominant price bands were $20K–$30K (35.6%), $10K–$20K (33.9%), and $30K–$40K (14.8%). Notably, the $40K–$50K band also had a significant presence (5.9%). For comparison, Florida at $25,179 and California at $25,680 show slightly lower average sold prices.
For dealers, this points to an opportunity to focus inventory within these dominant price bands in Texas to match consumer preferences. From a pricing and lending perspective, understanding these price thresholds can aid in tailoring financing solutions to meet buyer needs.
Market Breakdown by Fuel Types
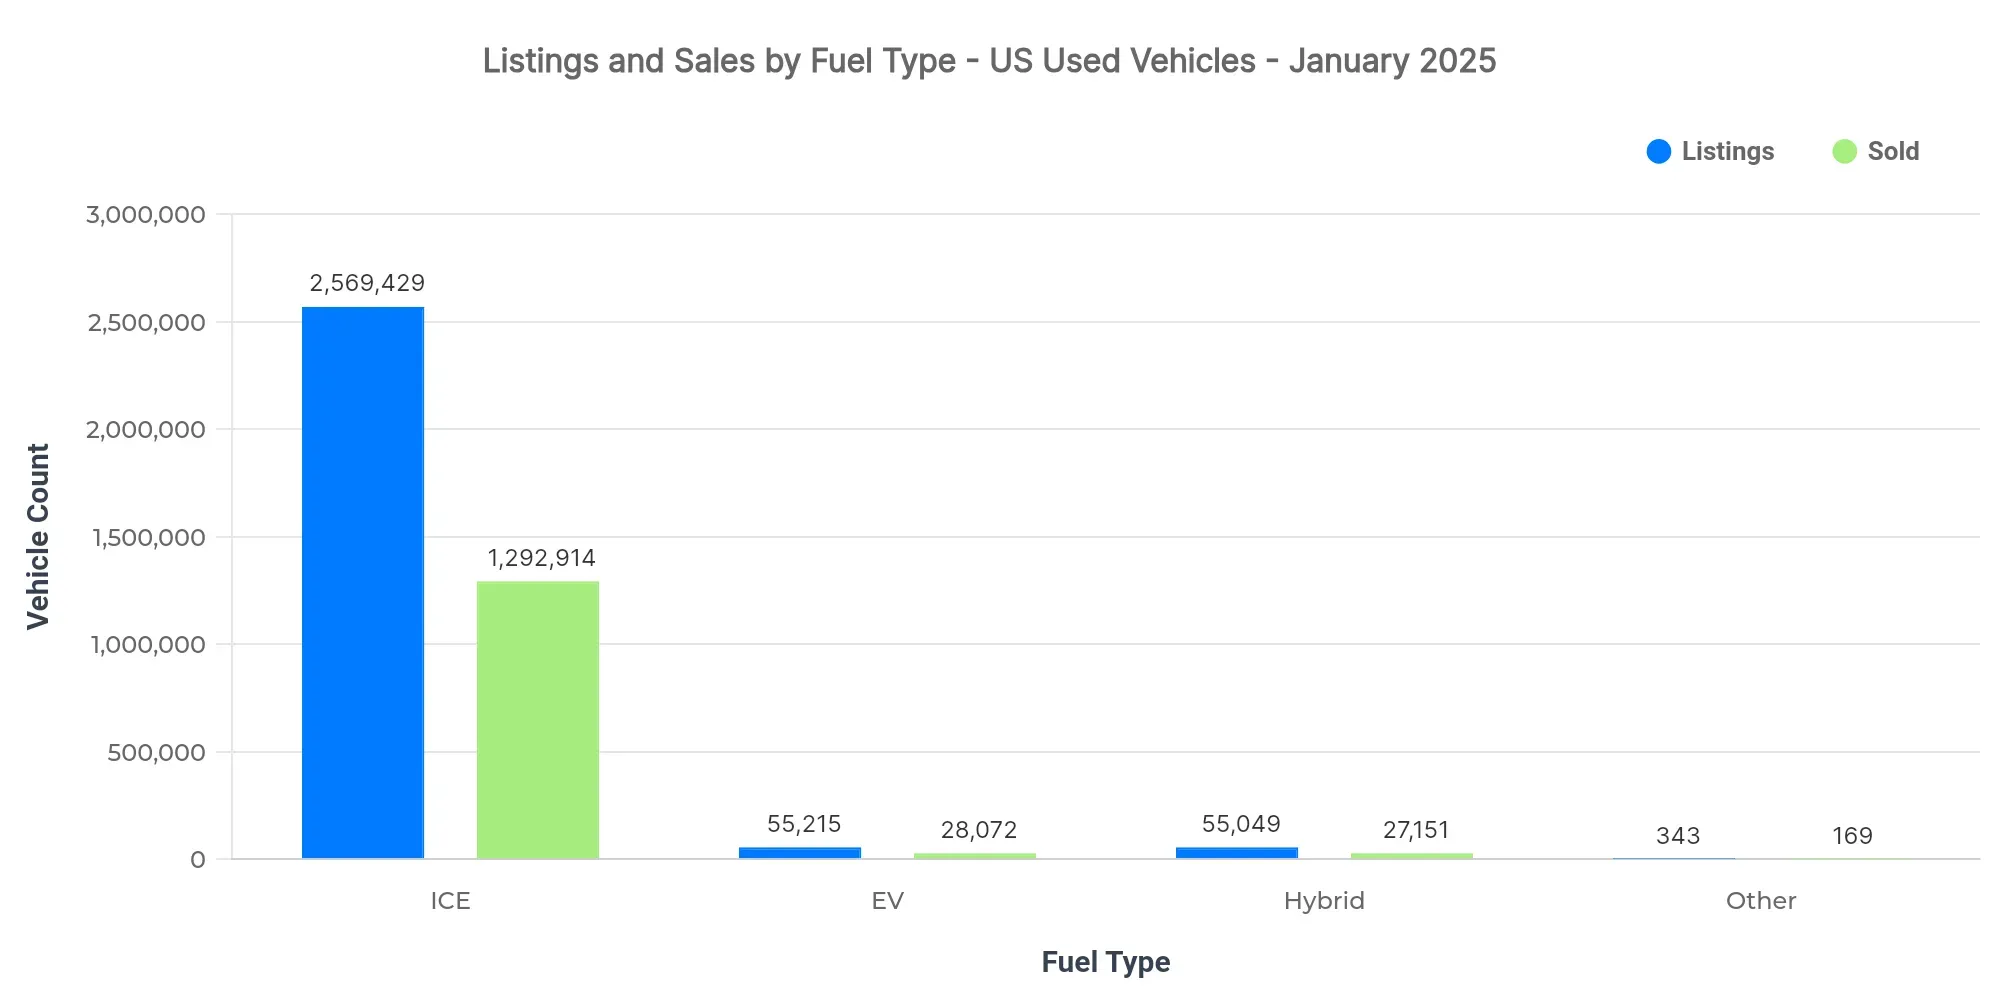
| Fuel Type | Listings Count | Sold Count | Avg Listing Price | Avg Sold Price |
|---|---|---|---|---|
| ICE | 2.57M | 1.29M | $24,677 | $25,017 |
| EV | 55.2K | 28.1K | $35,152 | $32,042 |
| Hybrid | 55K | 27.2K | $27,092 | $26,333 |
| Other | 343 | 169 | $15,010 | $15,707 |
Internal Combustion Engines (ICE) dominated both listings and sales, while Electric Vehicles (EVs) commanded a premium average sold price. Hybrid vehicles also present a strong market presence, offering an alternative with more flexibility than pure EVs.
- EV adoption is on a steady incline, yet remains niche compared to ICE vehicles.
- Price positioning of EVs indicates they remain a premium product, with potential profitability for dealers.
- Market dynamics suggest Hybrid vehicles serve as a middle ground, balancing between traditional and electric powertrains.
Market Share by Body Types
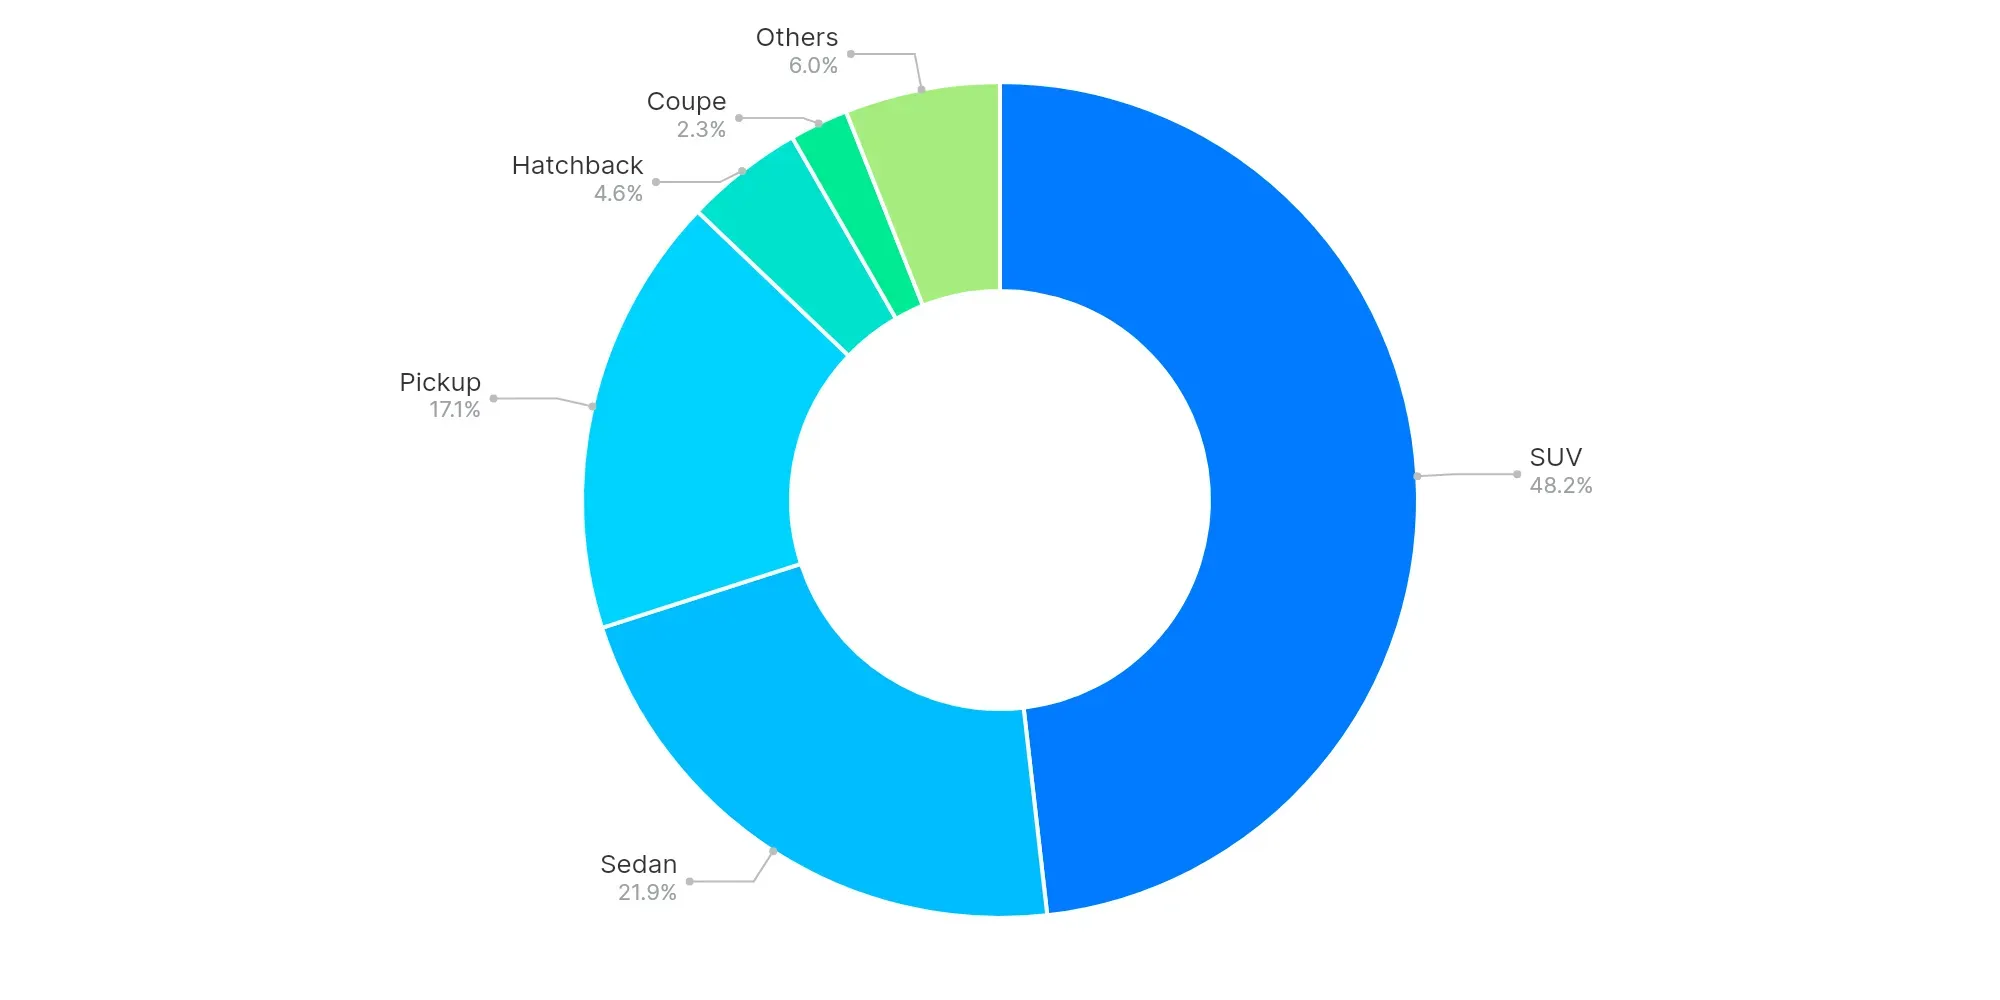
SUVs (48.2%), Sedans (21.9%), and Pickups (17.1%) dominate the market. The strong preference for larger vehicle segments such as SUVs and Pickups highlights consumer demand for versatile, multifunctional vehicles. A trend towards SUVs indicates a shifting preference aligned with lifestyle needs, including family and recreational uses.
High-Volume vs Low-Volume States (Executive Insights)
- Top-performing states: Texas, Florida, California
- Underpenetrated regions: Virgin Islands, American Samoa, Northern Mariana Islands
- Key price bands: $20K–$30K, $10K–$20K
- EV trend: Premium pricing with moderate adoption
- Buyer preferences: Strong lean towards SUVs and larger vehicles
The used car market continues to exhibit growth in high-volume states while opportunities exist in underpenetrated regions. Dealers should focus on strategically stocking vehicles within popular price bands to meet market demand. Expanding EV offerings in alignment with evolving consumer interest will be crucial. Recognizing consumer preferences towards larger vehicle segments can guide marketing and inventory decisions.