

US Monthly Used Car Market Data – January 2024
The January 2024 report on the US used vehicle market provides insights into dealer activity, sales volume, pricing trends, fuel types, body types, and regional performance. Emphasizing key trends, this comprehensive analysis offers a clear perspective for dealers and analysts.
Number of Dealerships by State
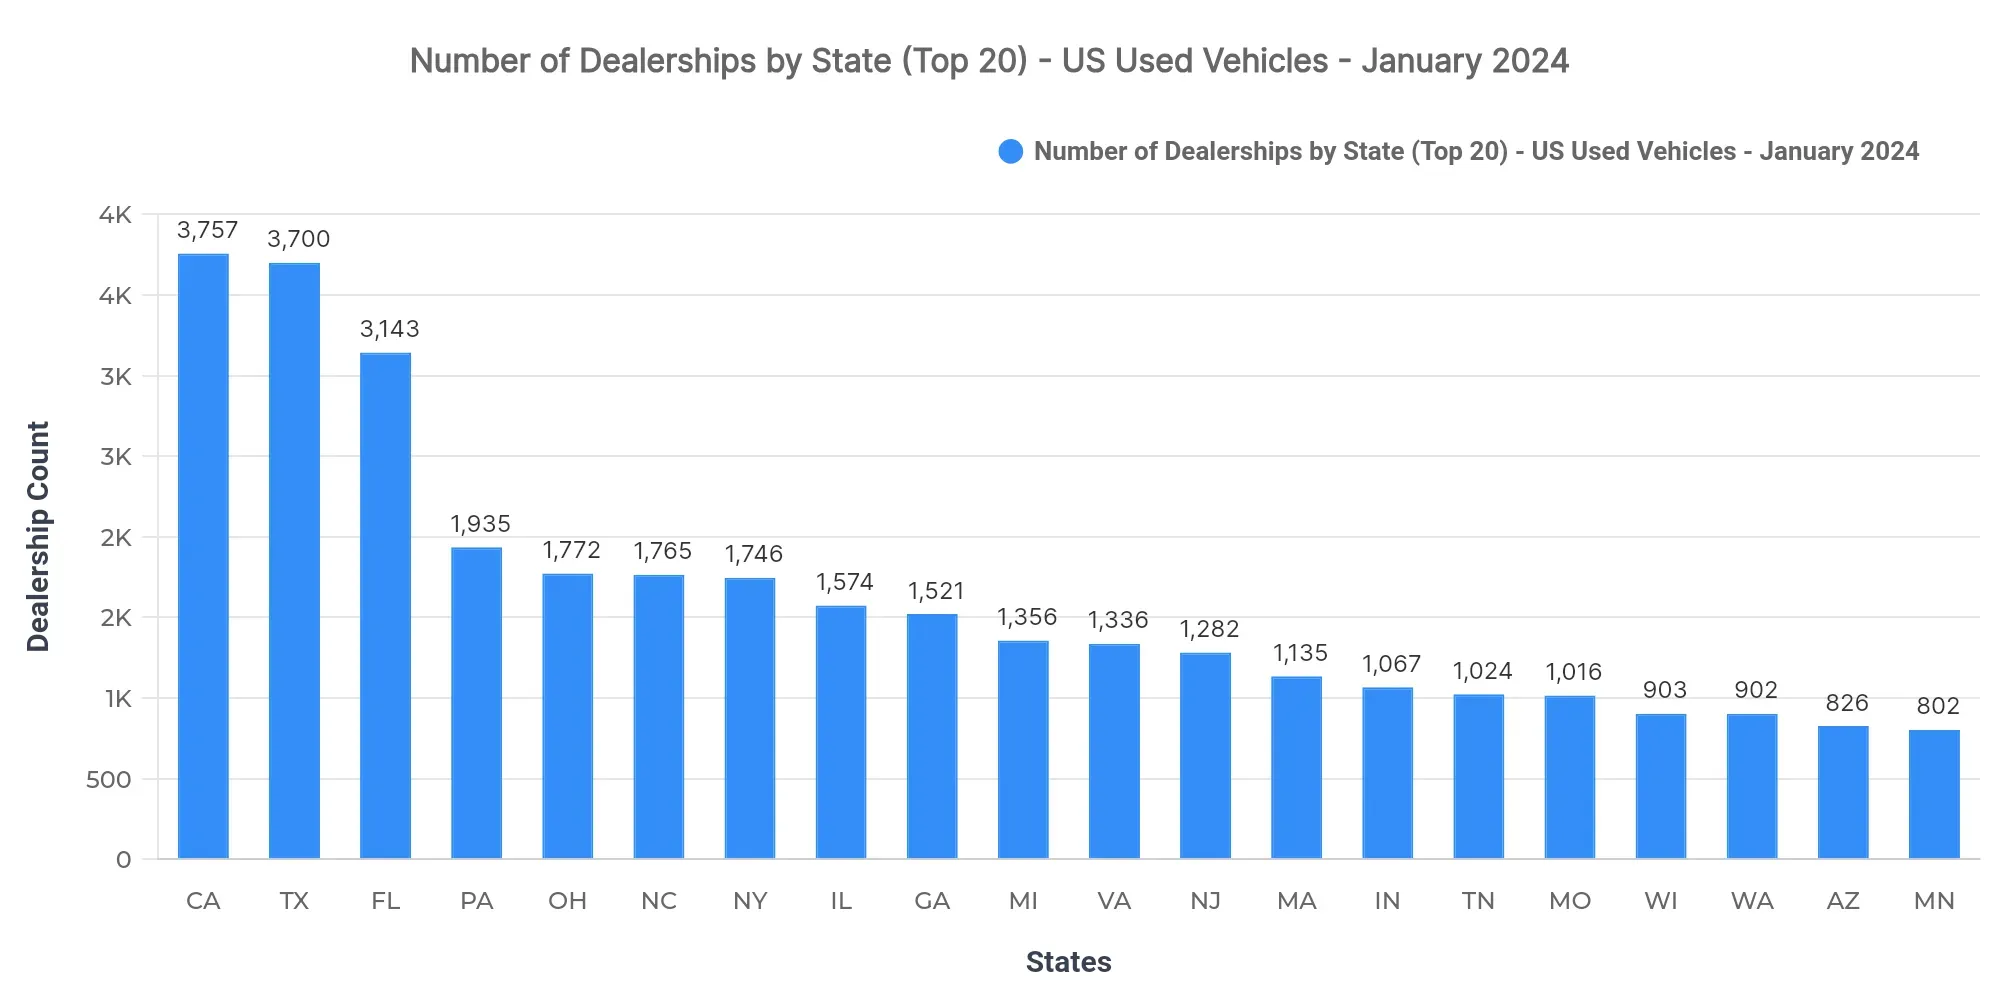
California (3,700), Texas (3,757), and Florida (3,143) lead in dealership counts. There is a notable concentration of dealerships in these states, indicating potential saturation and fierce competition among dealerships. Given this density, market strategies need to focus on client retention and enhanced service offerings.
Top 10 States by Sold Volume
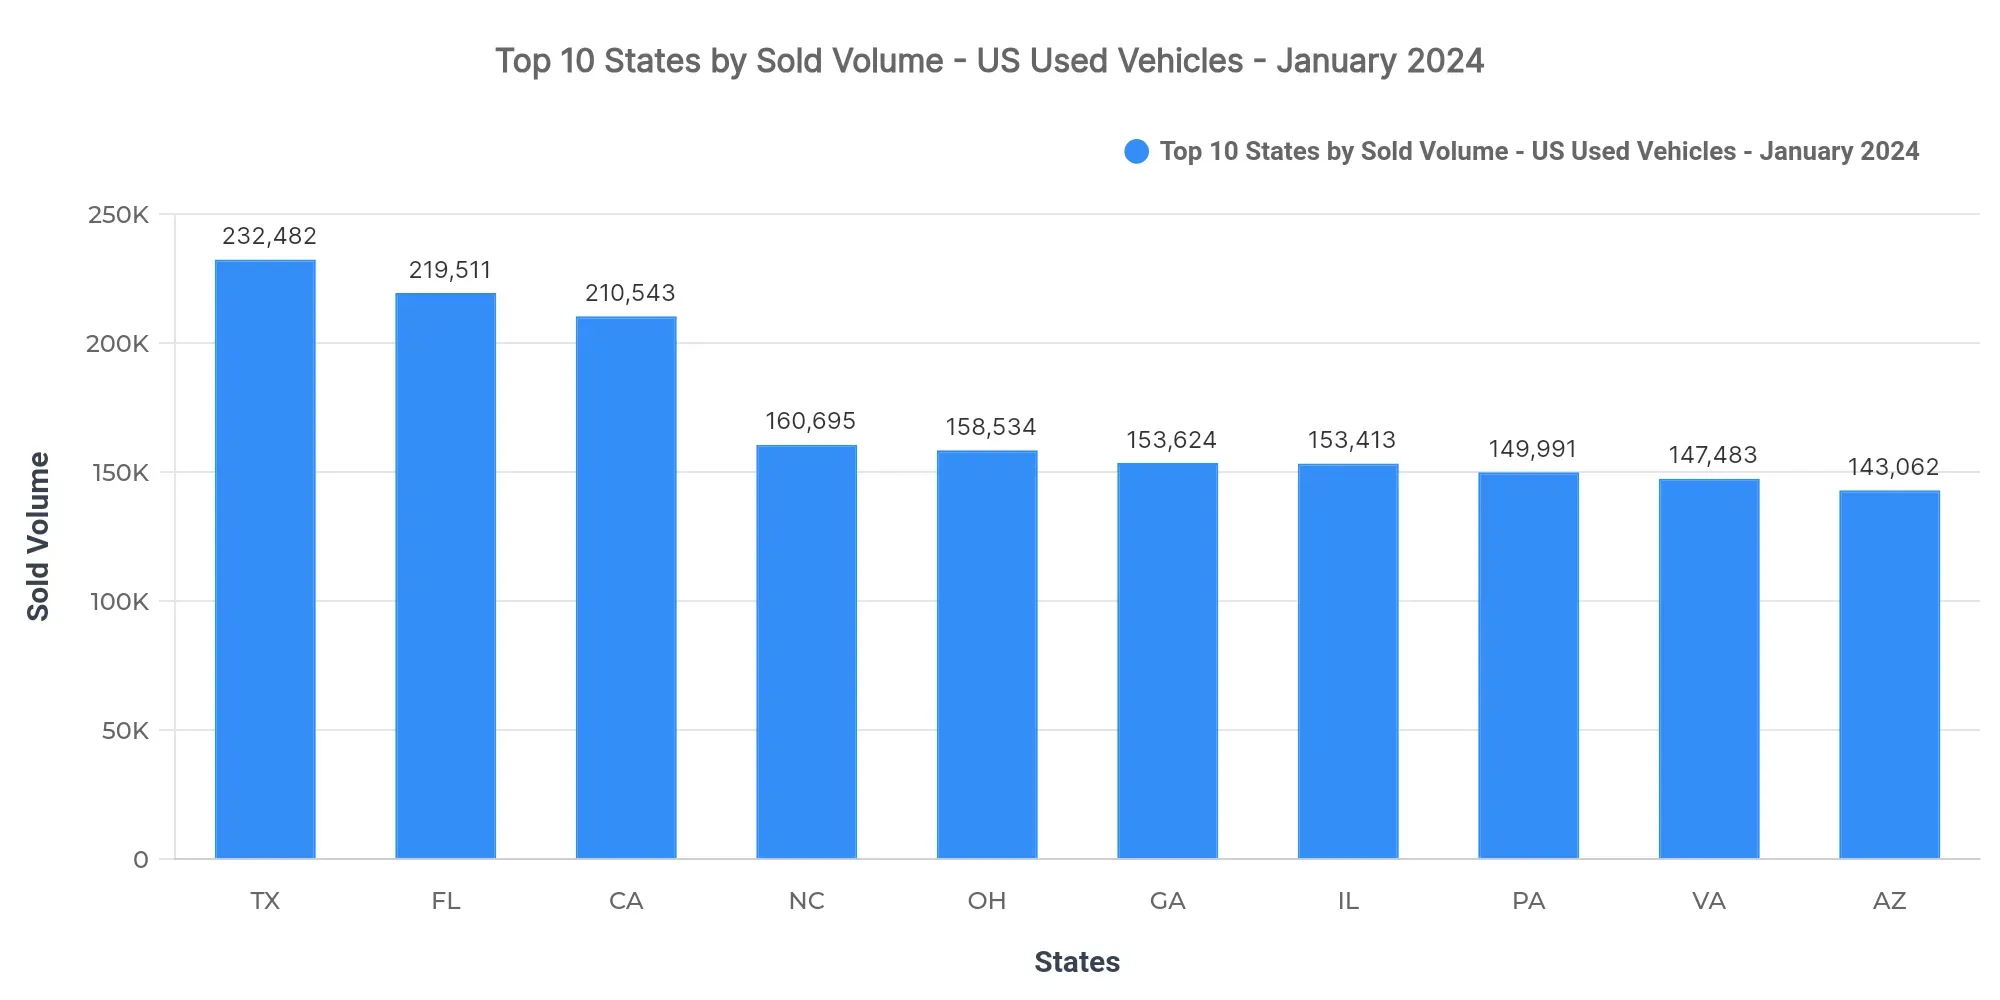
Texas (232,482), Florida (219,511), and California (210,543) lead. The combined share of the top three states constitutes 12.1% of the national sold volume. The remaining top 10 states are North Carolina, Ohio, Georgia, Illinois, Pennsylvania, Virginia, and Arizona.
Top states dominate the market, pointing to established demand routes and entrenched dealer networks. Regional preferences, like the demand in Southern states, highlight the need for market-specific tactics.
Price Breakdown: Top 10 States by Sold Volume
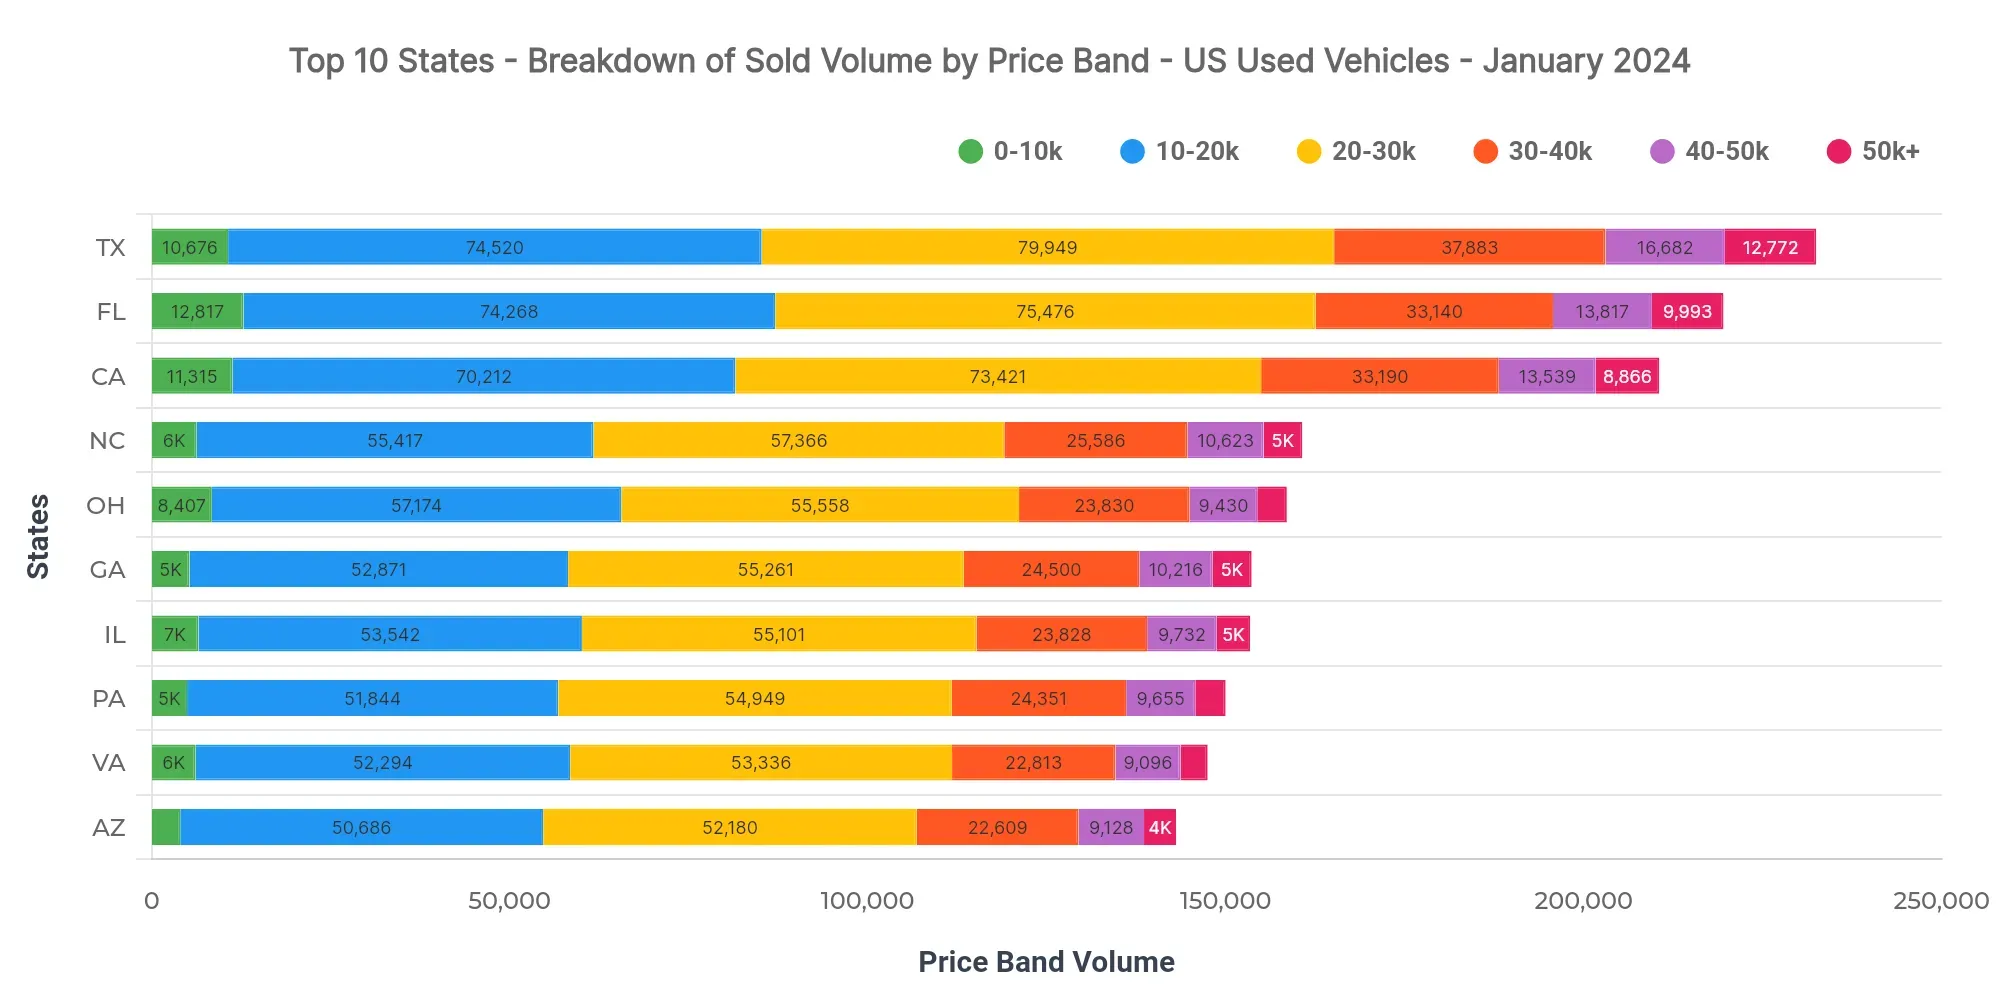
In Texas, dominant price bands include $20K–$30K (34.4%), $10K–$20K (32.1%), and $30K–$40K (16.3%). Additionally, the $40K–$50K band holds a notable 7.2%. Compared with other top states, Florida averages a sold price at $25,619 and California at $26,095.
For dealers, the focus should be on stocking inventory within popular price bands. Pricing strategies should align with consumer affordability, while lenders might target high-demand price segments to optimize loan offerings.
Market Breakdown by Fuel Types
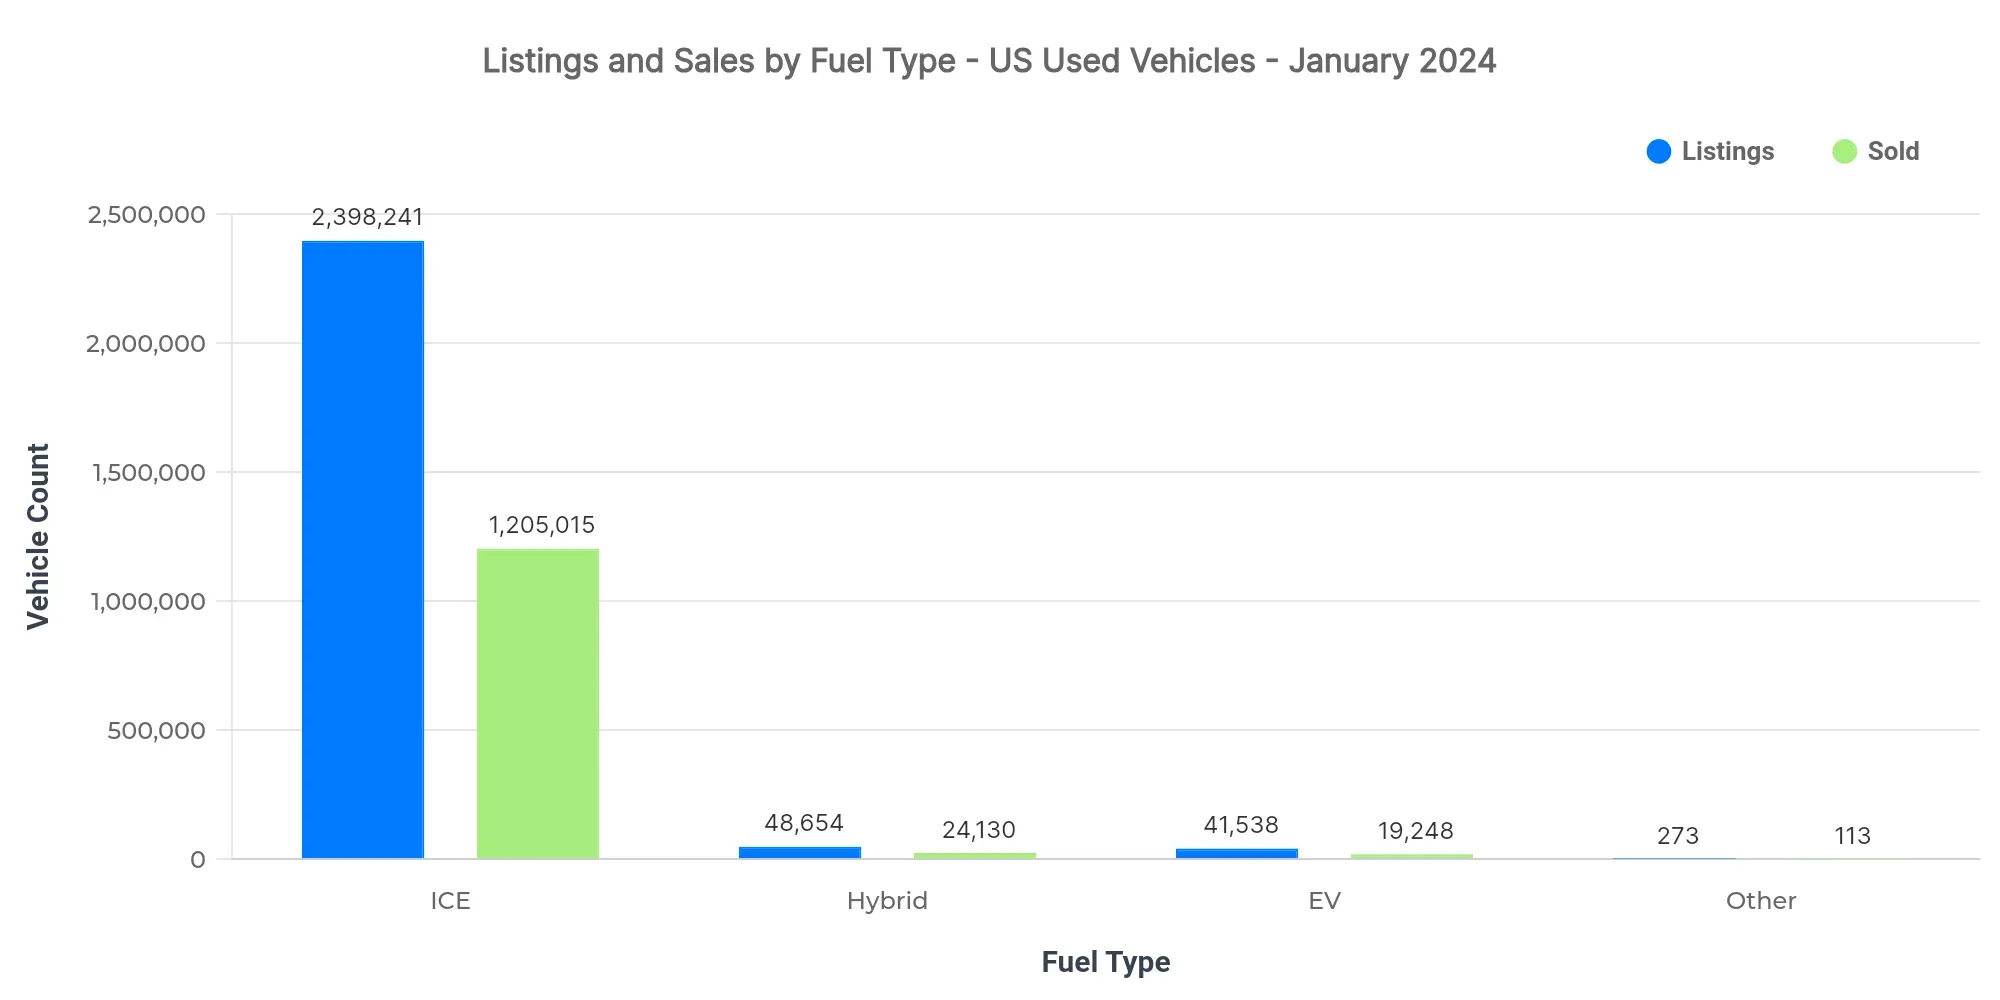
| Fuel Type | Listings Count | Sold Count | Avg Listing Price | Avg Sold Price |
|---|---|---|---|---|
| ICE | 2.40M | 1.21M | $25,040 | $25,065 |
| Hybrid | 48.7K | 24.1K | $27,107 | $26,000 |
| EV | 41.5K | 19.2K | $39,307 | $36,628 |
| Other | 273 | 113 | $15,565 | $15,810 |
- EV adoption remains gradual but is characterized by premium pricing, indicating early-adopter influence.
- Price positioning reveals that while ICE vehicles dominate in volume, EVs command higher average prices.
- Market dynamics highlight that while hybrids and EVs grow, traditional fuel types still lead in sheer numbers.
Market Share by Body Types
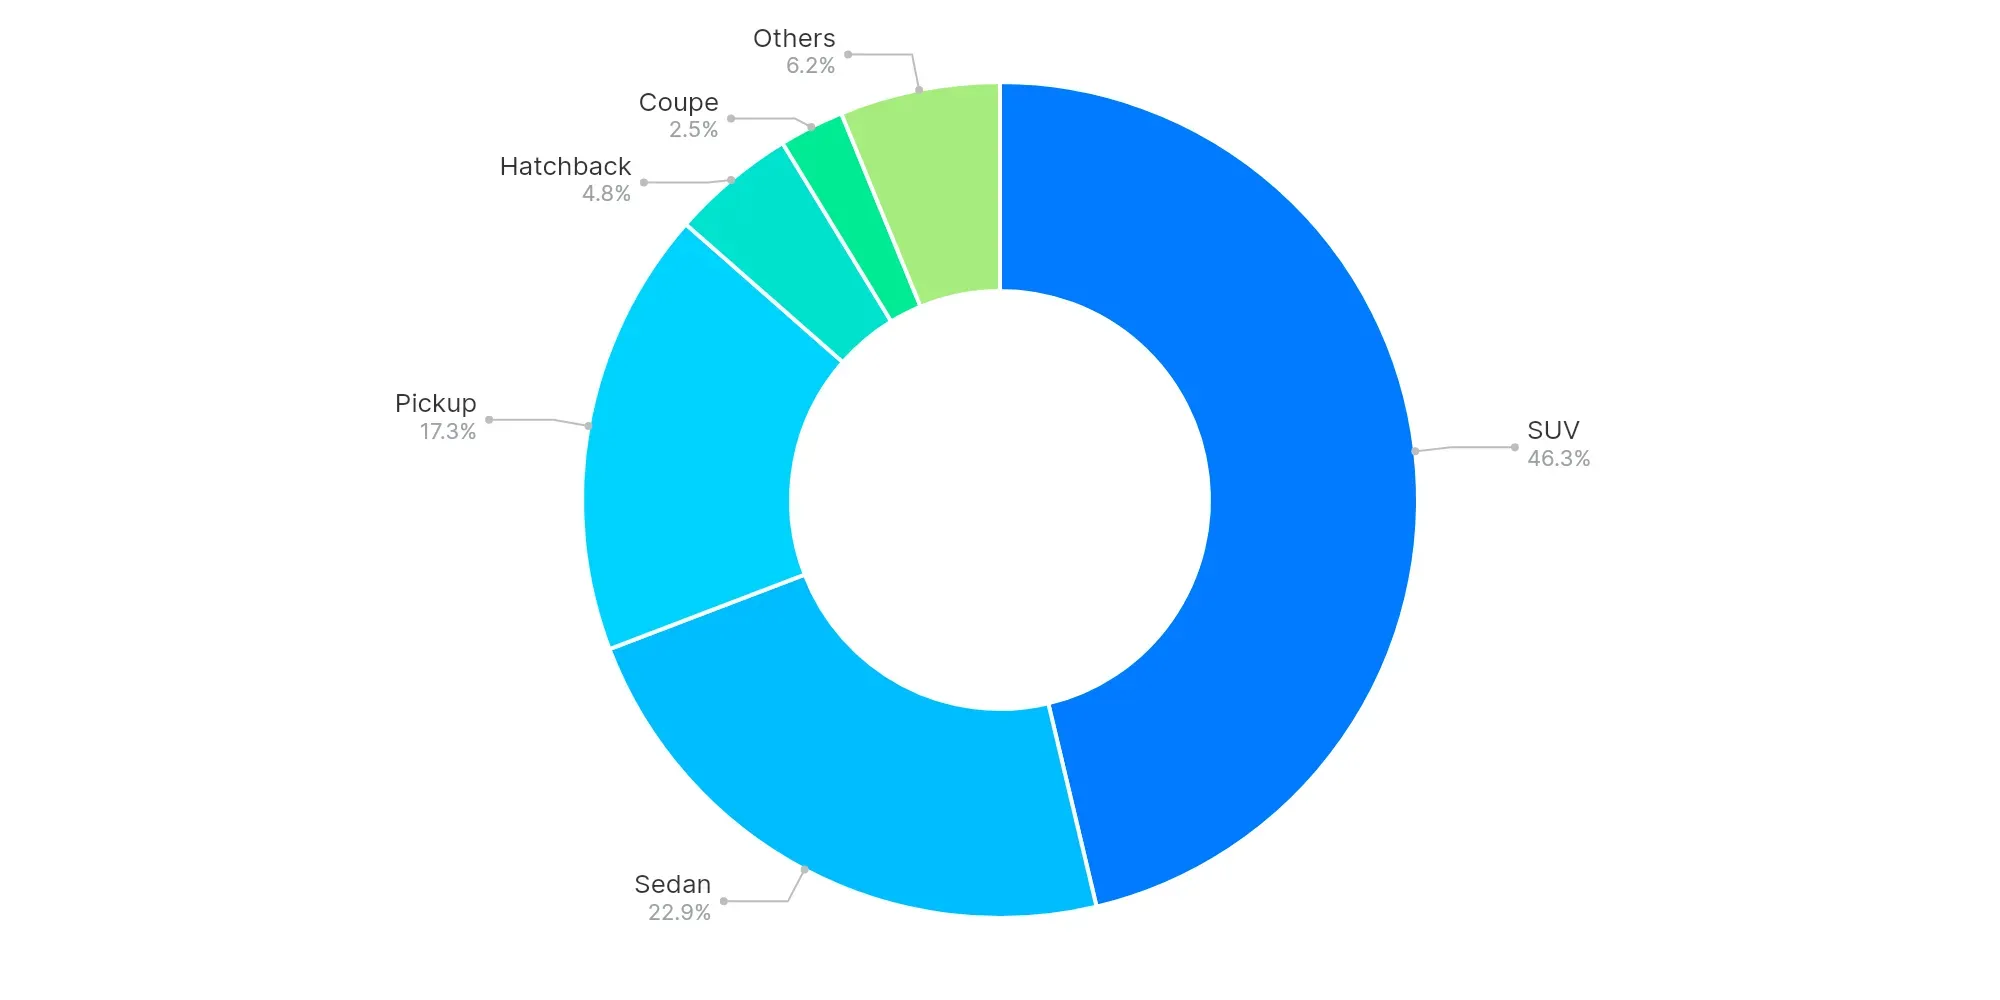
SUVs (46.3%), Sedans (22.9%), and Pickups (17.3%) dominate the market. Notably, SUVs and Pickups emphasize consumers' preference for larger vehicle segments. This trend suggests a steady shift towards versatile and spacious vehicles.
High-Volume vs Low-Volume States (Executive Insights)
- Top-performing states: Texas, Florida, California.
- Underpenetrated regions: Virgin Islands, American Samoa, Northern Mariana Islands.
- Key price bands: $20K–$30K, $10K–$20K, $30K–$40K.
- EV trend: Premium pricing with growing interest.
- Buyer preferences: Strong affinity towards SUVs and Pickups.
The market continues to exhibit strong demand in high-volume regions, emphasizing the importance of strategic inventory management. Dealers should capitalize on dominant price bands and the growing interest in electric vehicles, while analysts focus on consumer trends and changing preferences.