

US Monthly Used Car Market Data – February 2026
February's report on the U.S. used vehicle market provides insights into dealership activity, sales volumes, pricing dynamics, fuel preferences, body type trends, and regional performance. By focusing on current market leaders and emerging trends, we reveal the complexities of the used car industry landscape.
Number of Dealerships by State
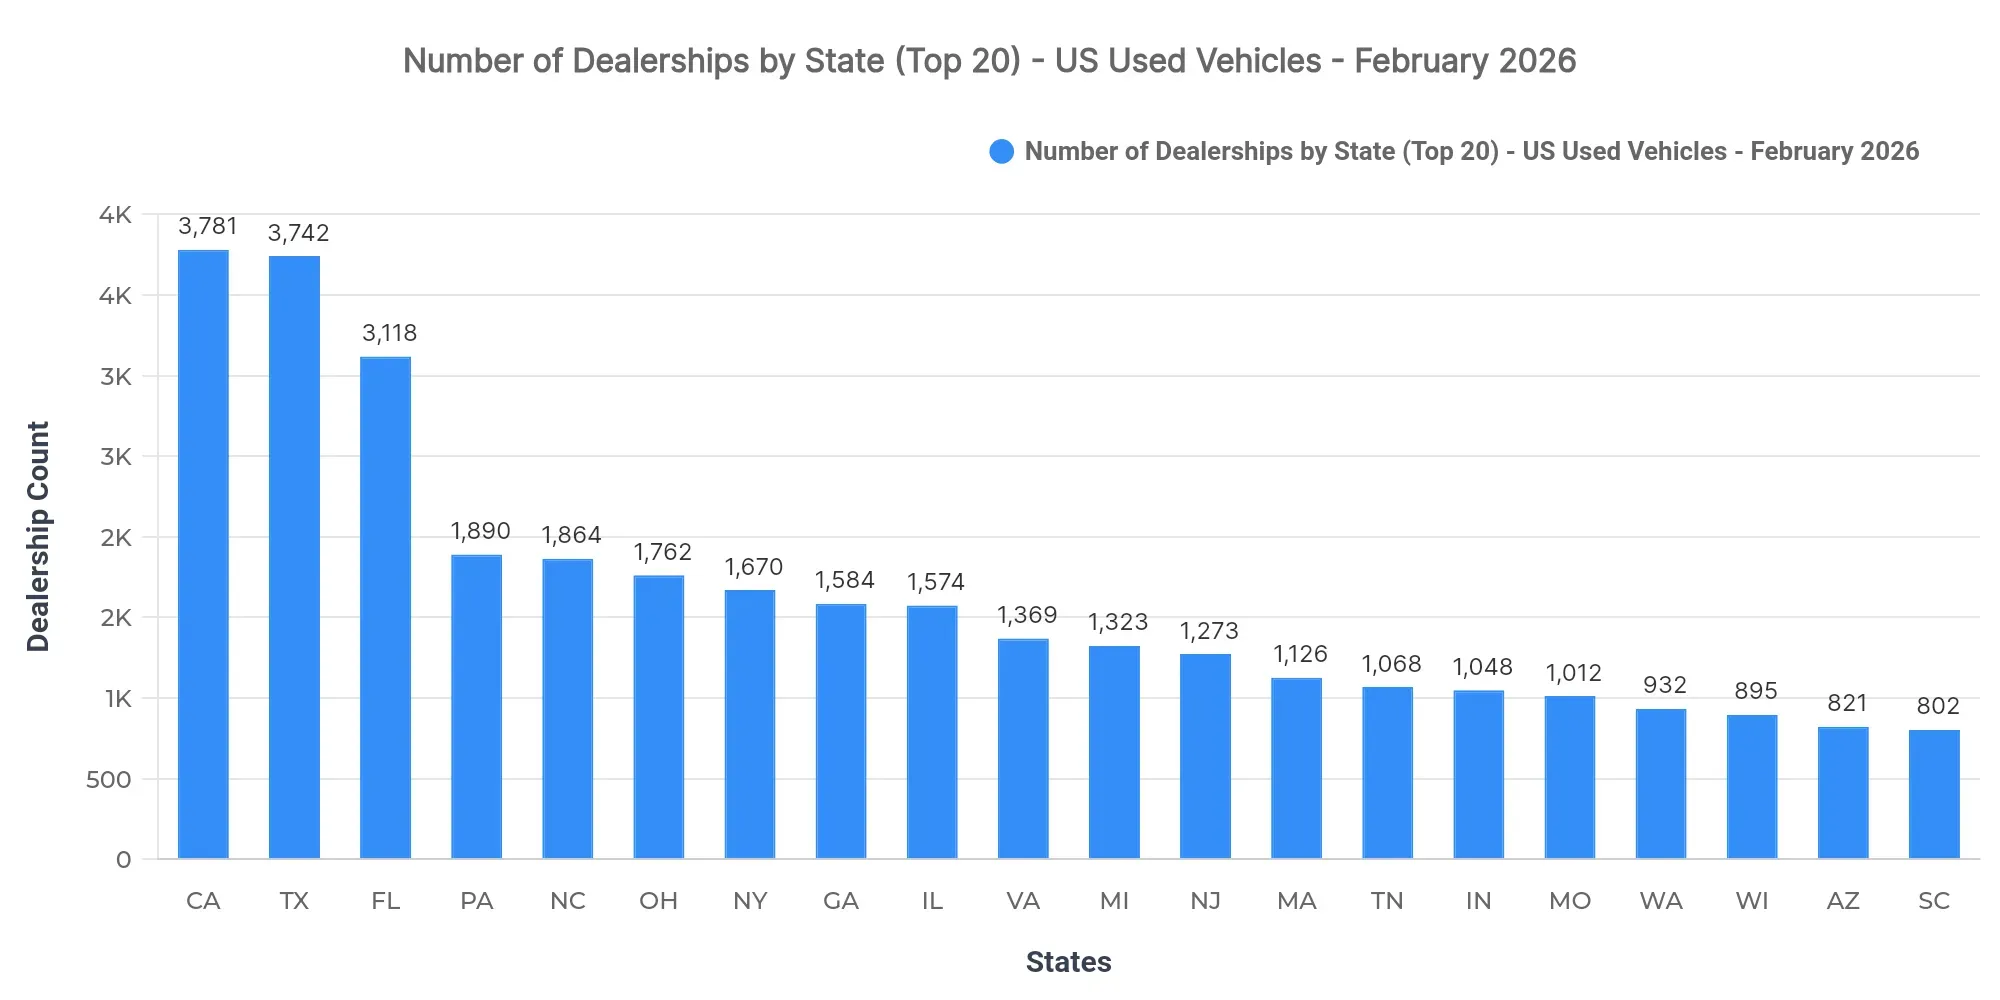
California (3,781), Texas (3,742), and Florida (3,118) lead in dealership counts. These states exhibit high market concentration, indicating competitive environments for dealers aiming to capture more local sales. Notably, other states without the top 3 dealership presence show moderate market saturation, suggesting potential growth opportunities.
Top 10 States by Sold Volume
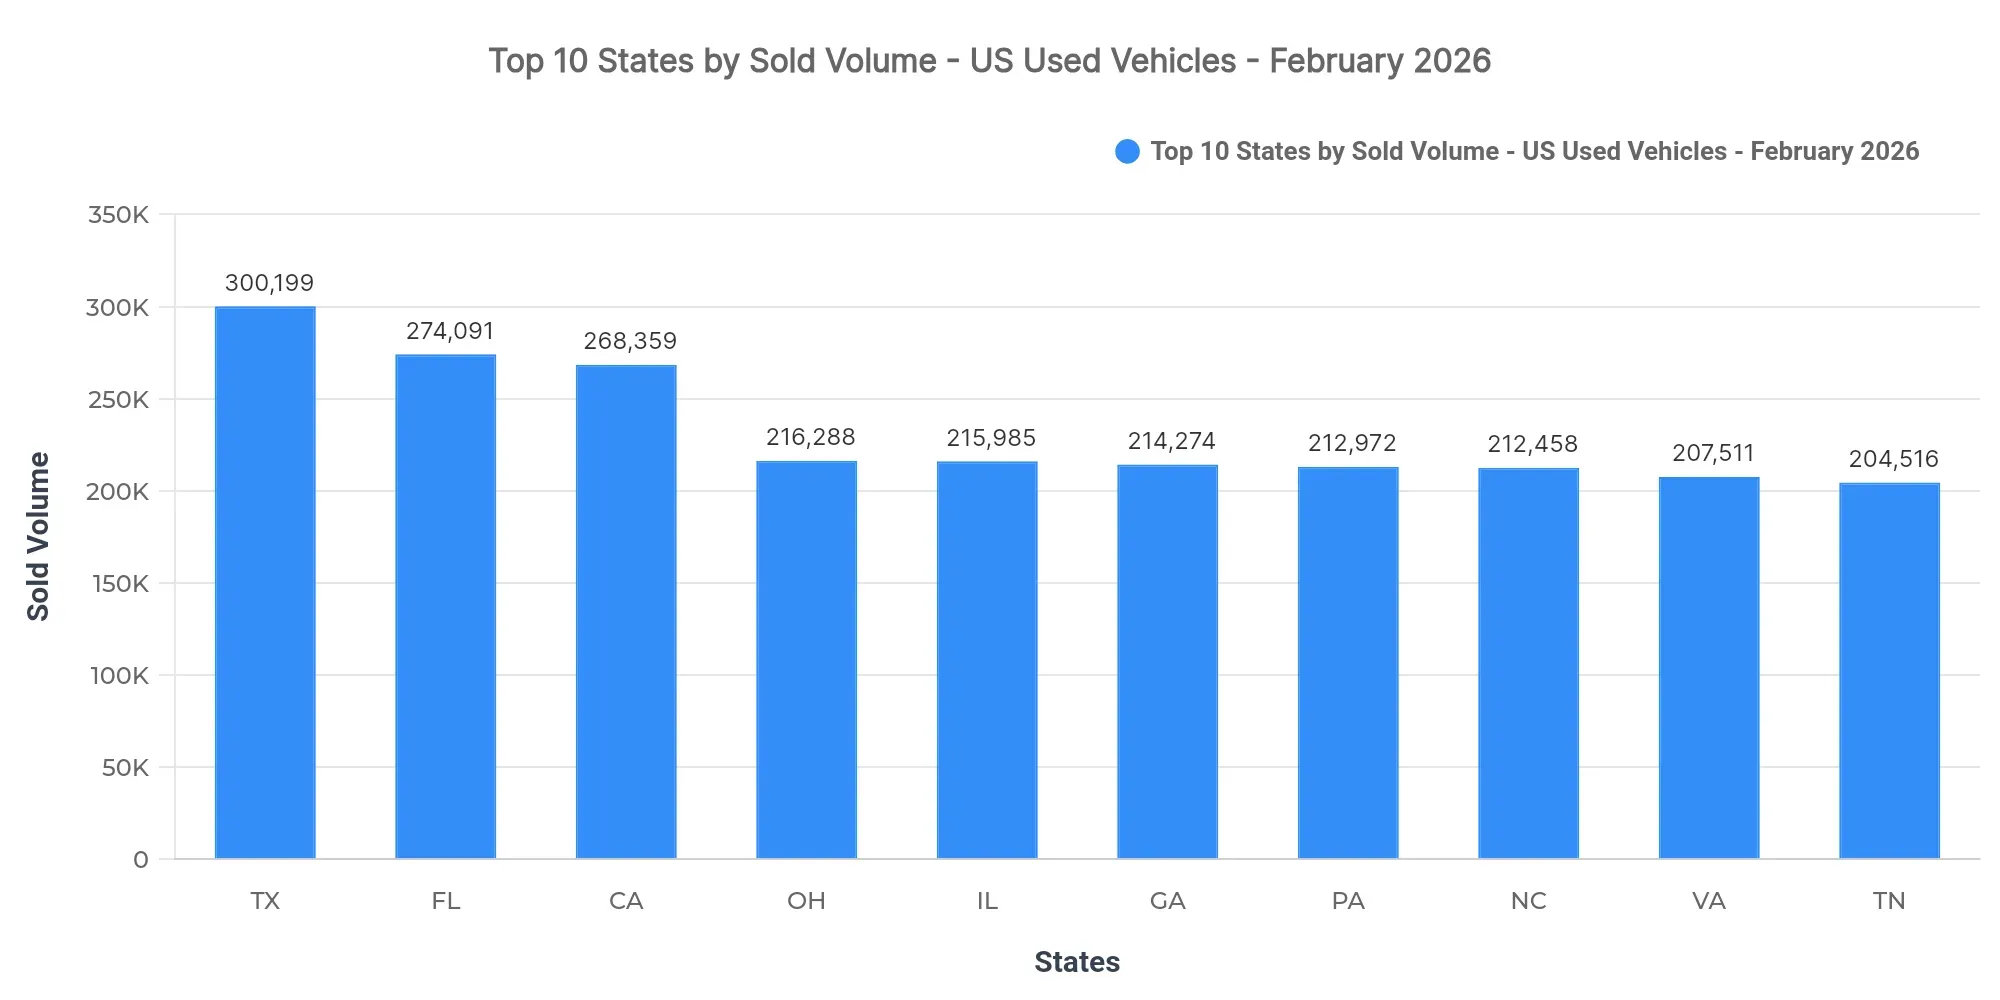
Texas (300,199), Florida (274,091), and California (268,359) lead. The top three states account for 11% of the national sold volume. The remaining top-10 states are Ohio, Illinois, Georgia, Pennsylvania, North Carolina, Virginia, and Tennessee.
Texas, Florida, and California account for the bulk of sales, showcasing market concentration that dealers should target. Regional demand remains strong in the South, while Midwest states offer stable volumes, hinting at steady demand for used vehicles in these areas.
Price Breakdown: Top 10 States by Sold Volume
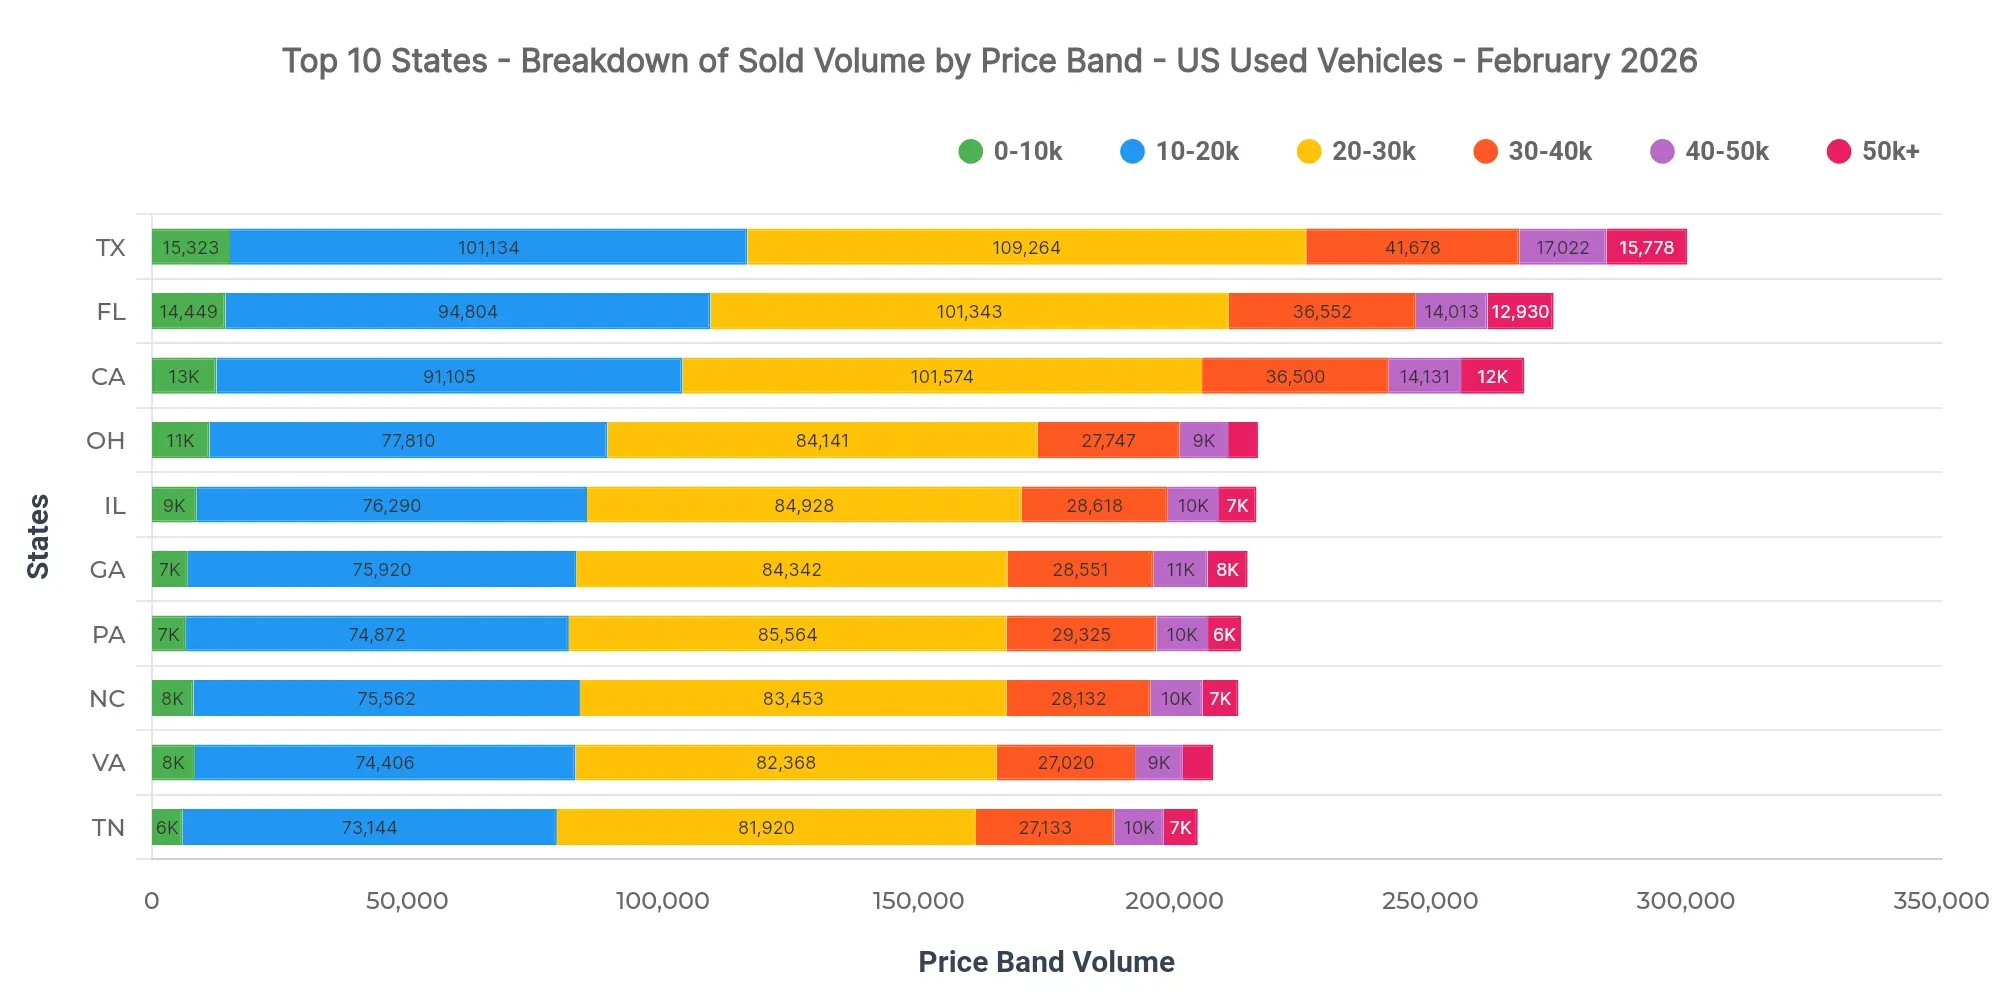
In Texas, the dominant price bands are $20K–$30K (36.4%) and $10K–$20K (33.7%). Price bands between $40K–$50K (5.7%) reflect a smaller but present upper-market segment. Florida at $25,051 and California at $25,458 illustrate average price points indicative of their market dynamics.
For dealers, awareness of the dominant price bands in Texas can aid strategies on inventory and pricing. From a lending standpoint, understanding the distribution of price segments helps tailor financing products to consumer needs.
Market Breakdown by Fuel Types
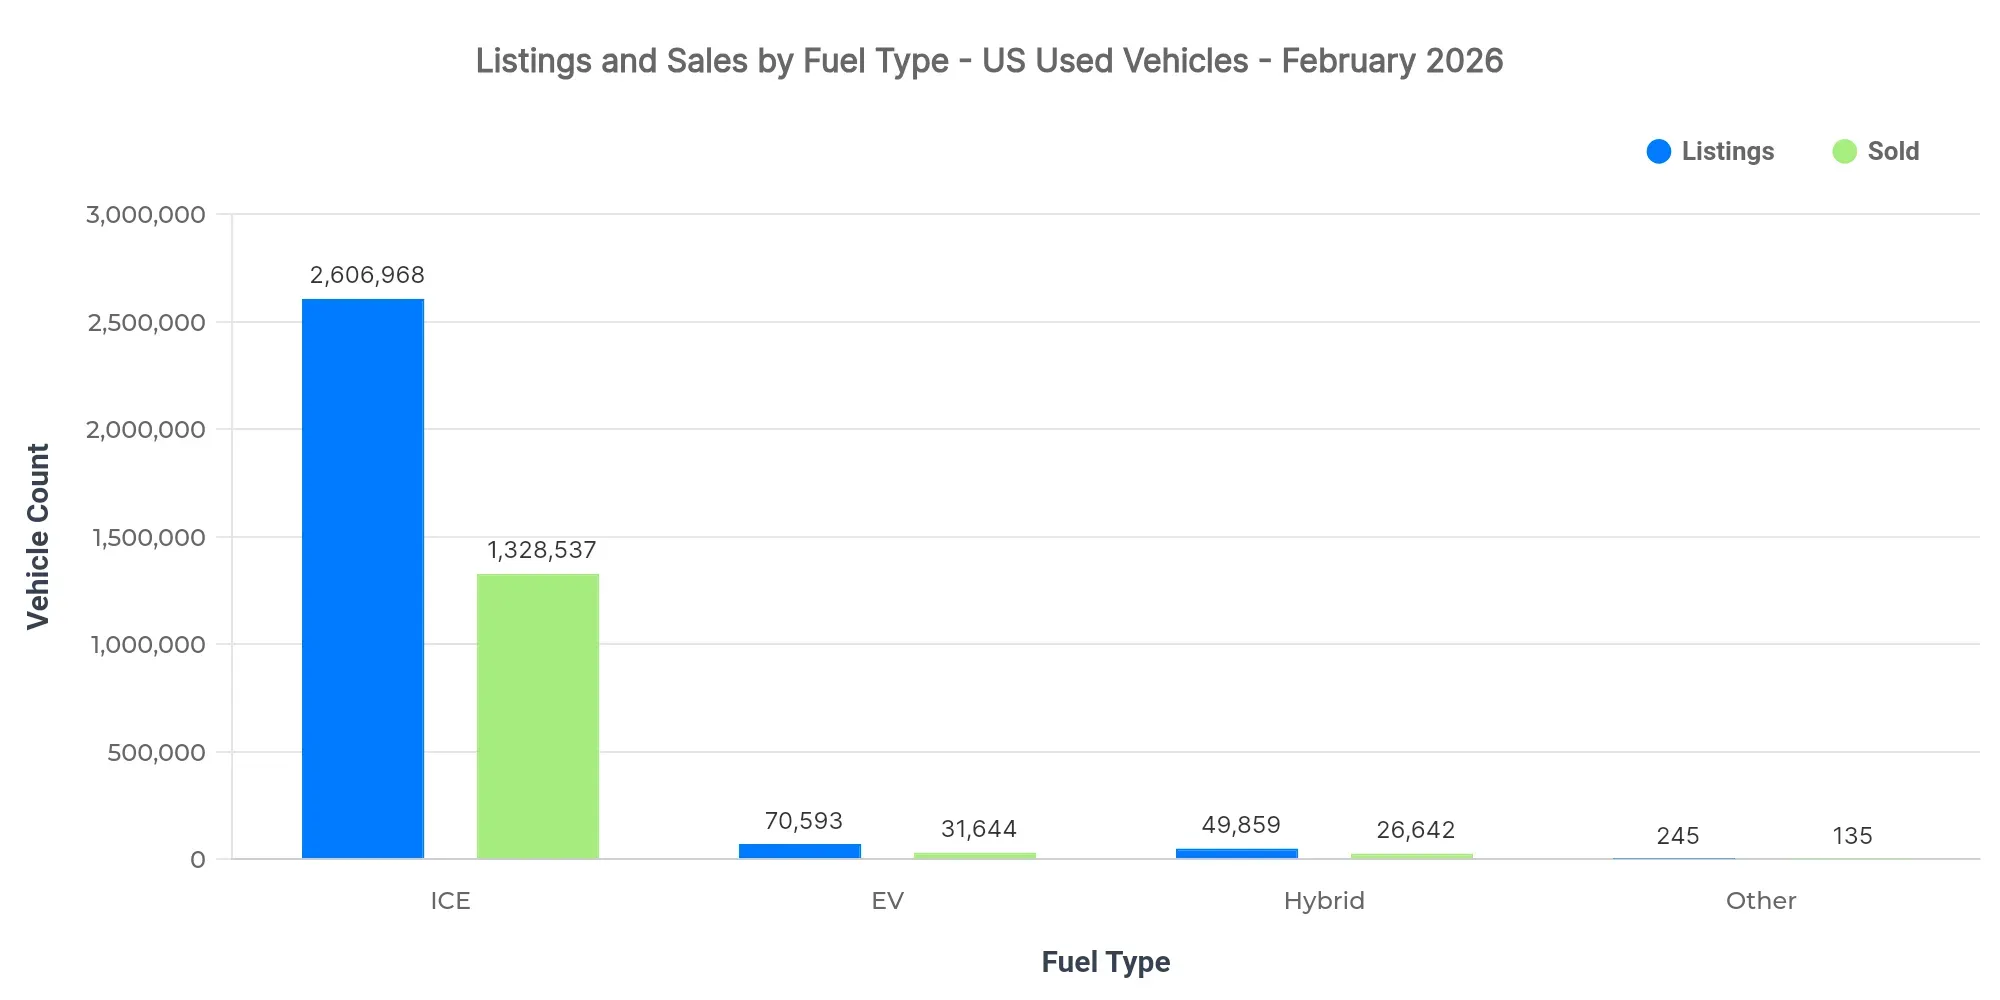
Gasoline-powered vehicles dominate the market, representing significant shares in listings and sales. However, electric vehicles (EVs) are priced higher, suggesting premium positioning. Hybrids join EVs in commanding elevated average prices compared to internal combustion engine (ICE) vehicles.
| Fuel Type | Listings Count | Sold Count | Avg Listing Price | Avg Sold Price |
|---|---|---|---|---|
| ICE | 2.61M | 1.33M | $23,533 | $25,011 |
| EV | 70.6K | 31.6K | $32,612 | $30,713 |
| Hybrid | 49.9K | 26.6K | $27,570 | $26,118 |
| Other | 245 | 135 | $11,449 | $12,156 |
- Emphasis on EV adoption is creating a differentiated market segment with higher price averages.
- Price positioning reflects the perceived value and ongoing transitions in fuel type commodities.
- ICE vehicles still represent primary sales, but dynamic shifts are underway as dealers adapt to changing market dynamics.
Market Share by Body Types
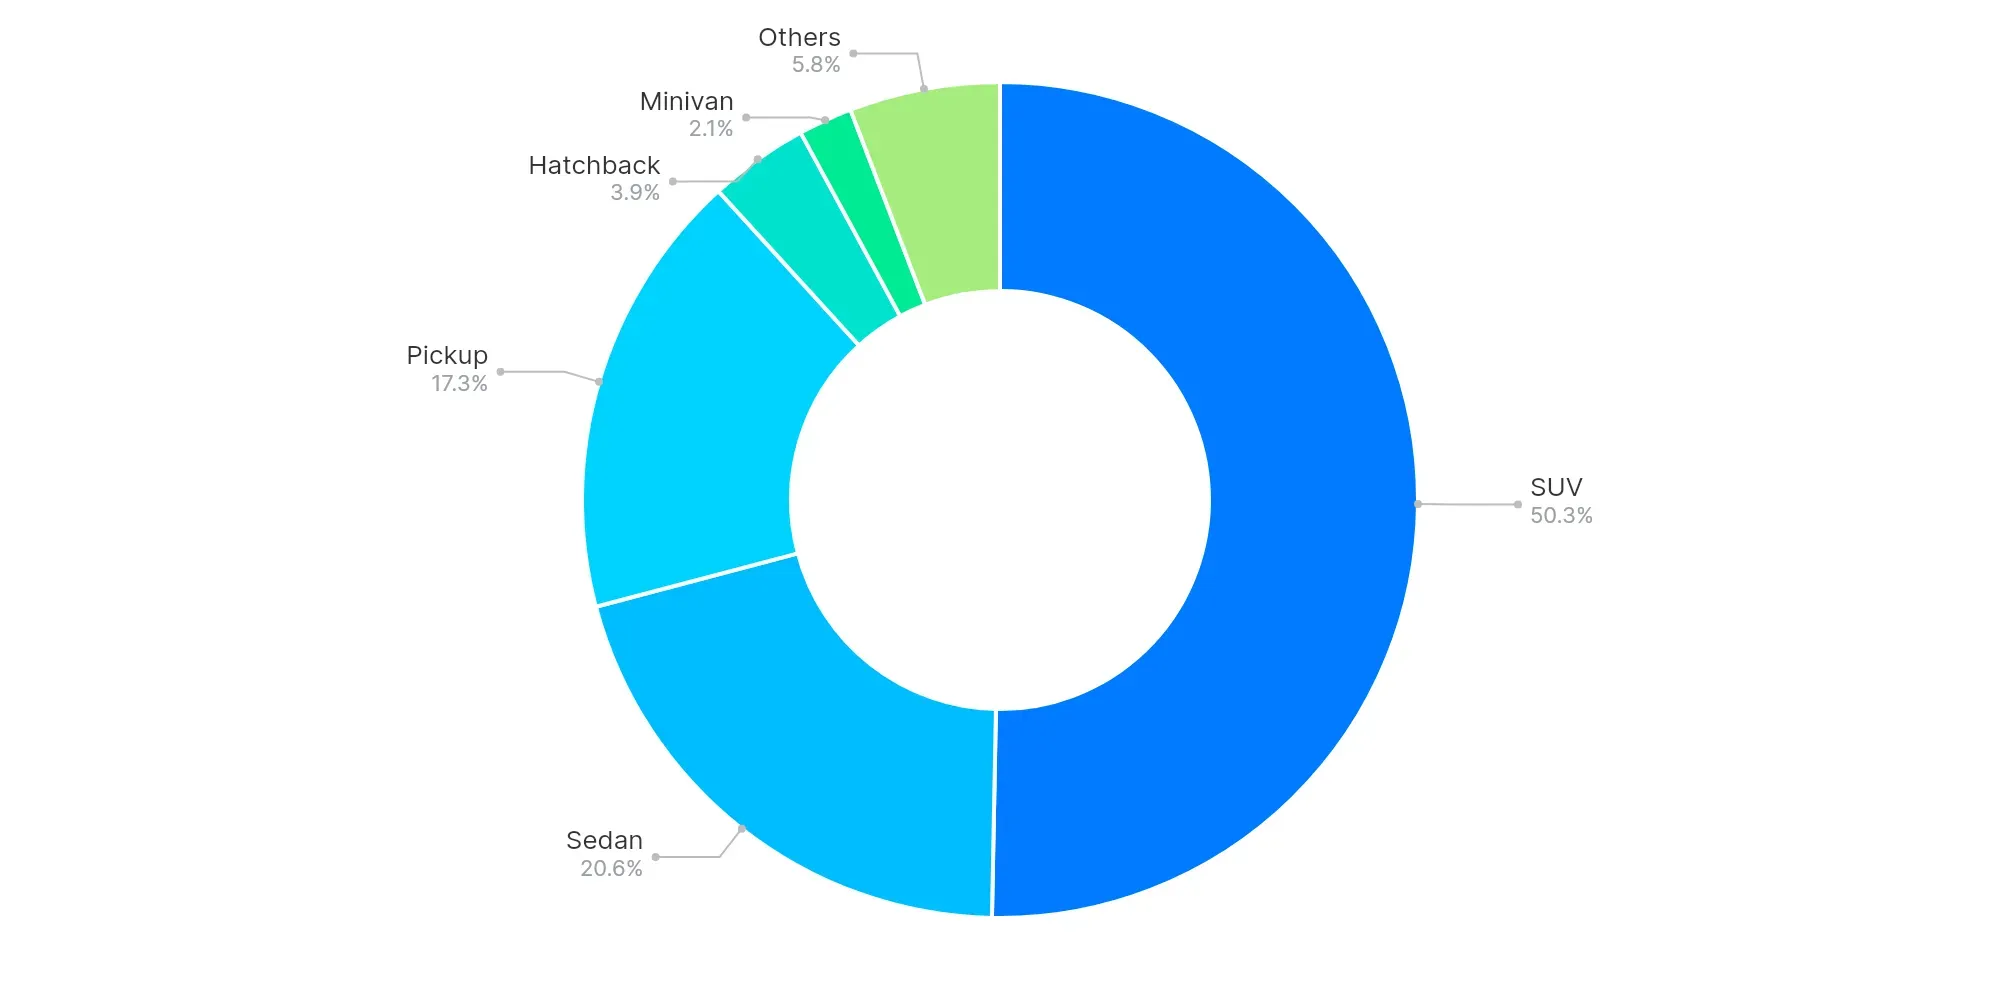
SUVs (50.3%), Sedans (20.6%), and Pickups (17.3%) are the top body types, with SUVs and Pickups highlighting a preference for larger vehicle segments. Consumers continue to favor practicality and space, indicating a shift toward versatile vehicle designs.
High-Volume vs Low-Volume States (Executive Insights)
- Top-performing states include Texas, Florida, and California.
- Underpenetrated regions are MP, AS, and GU.
- Key price bands in top states: $10K–$20K, $20K–$30K.
- Rising EV trends are reshaping market dynamics.
- Consumer preferences show a tilt toward larger body types like SUVs and Pickups.
In closing, the U.S. used car market maintains robust activity with notable regional and vehicle-type trends. For dealers, focusing on high-demand body types and understanding fuel type positioning will be crucial. These insights assist analysts and strategists in navigating the evolving automotive landscape, driving informed decisions.