

US Monthly Used Car Market Data – February 2025
This report analyzes key metrics of the US used car market, focusing on dealer activity, sales volume, and pricing. We provide an overview of fuel types and body types that dominate the market, as well as regional performance insights across various states.
Number of Dealerships by State
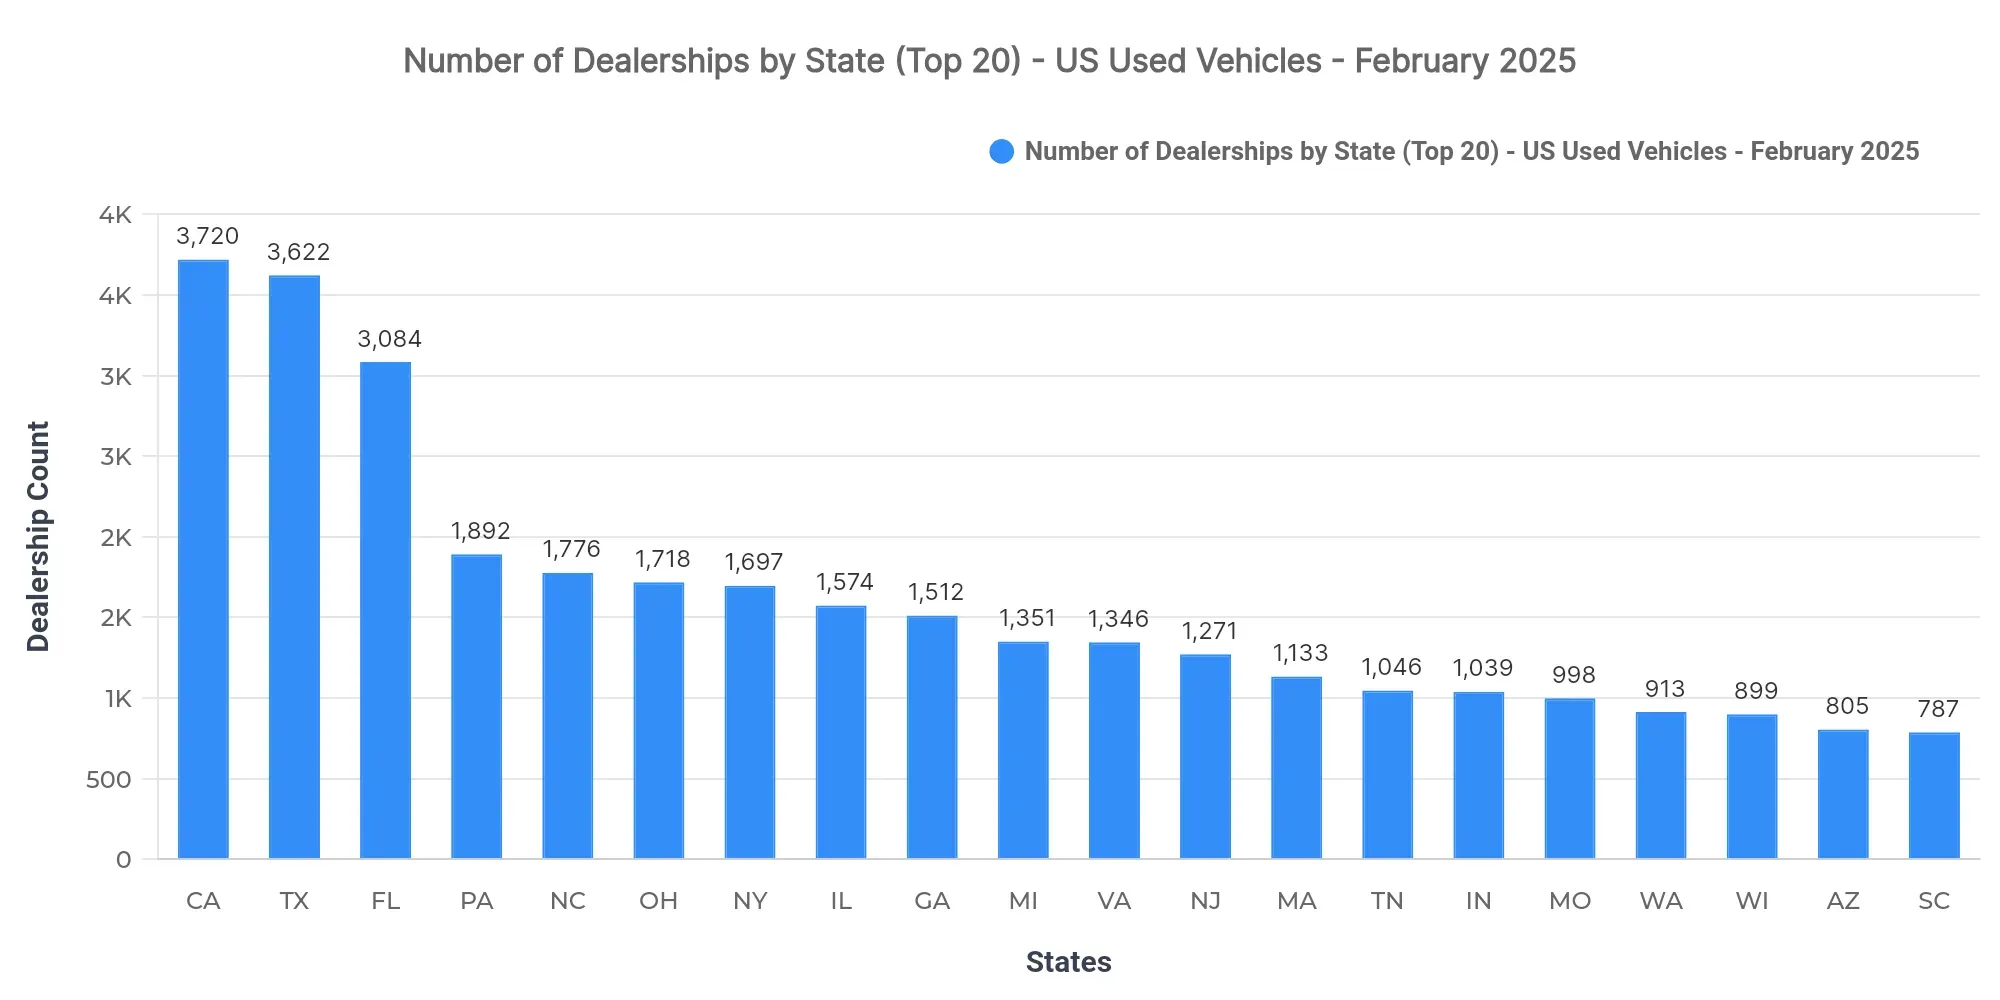
California (3,720), Texas (3,622), and Florida (3,084) lead in dealership counts. The concentration of dealerships in these states reflects a highly competitive market environment, potentially saturating local markets with varied offerings. Limiting the analysis to these top states highlights the regional concentration of dealership networks.
Top 10 States by Sold Volume
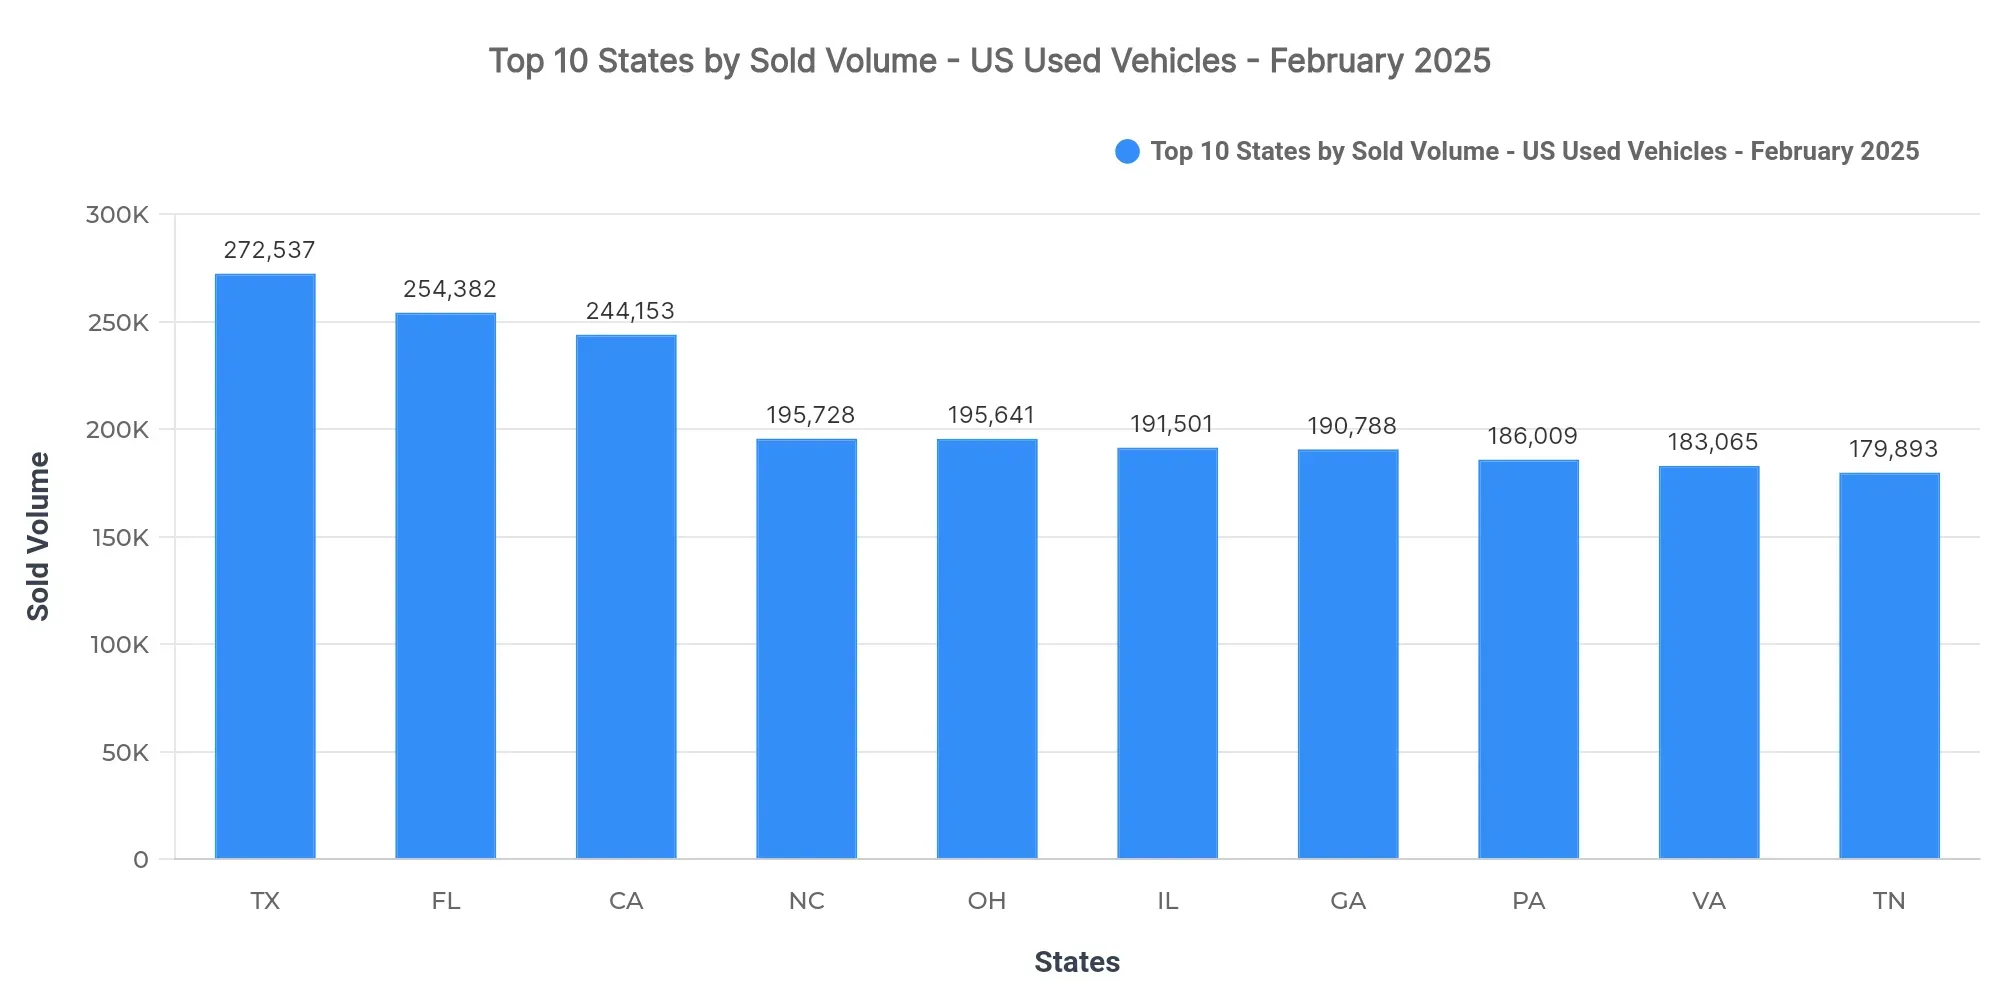
Texas (272,537), Florida (254,382), and California (244,153) lead. Combined, these states account for 11.3% of the national sold volume. The remaining top 10 states include North Carolina, Ohio, Illinois, Georgia, Pennsylvania, Virginia, and Tennessee. The concentration in these states indicates strong demand, driven by populous regions.
Higher market concentration in leading states implies competitive pricing and customer service focus, as dealerships strive to capture market share. Regional demand patterns suggest stable but concentrated demand in states with larger urban populations and economic activities.
Price Breakdown: Top 10 States by Sold Volume
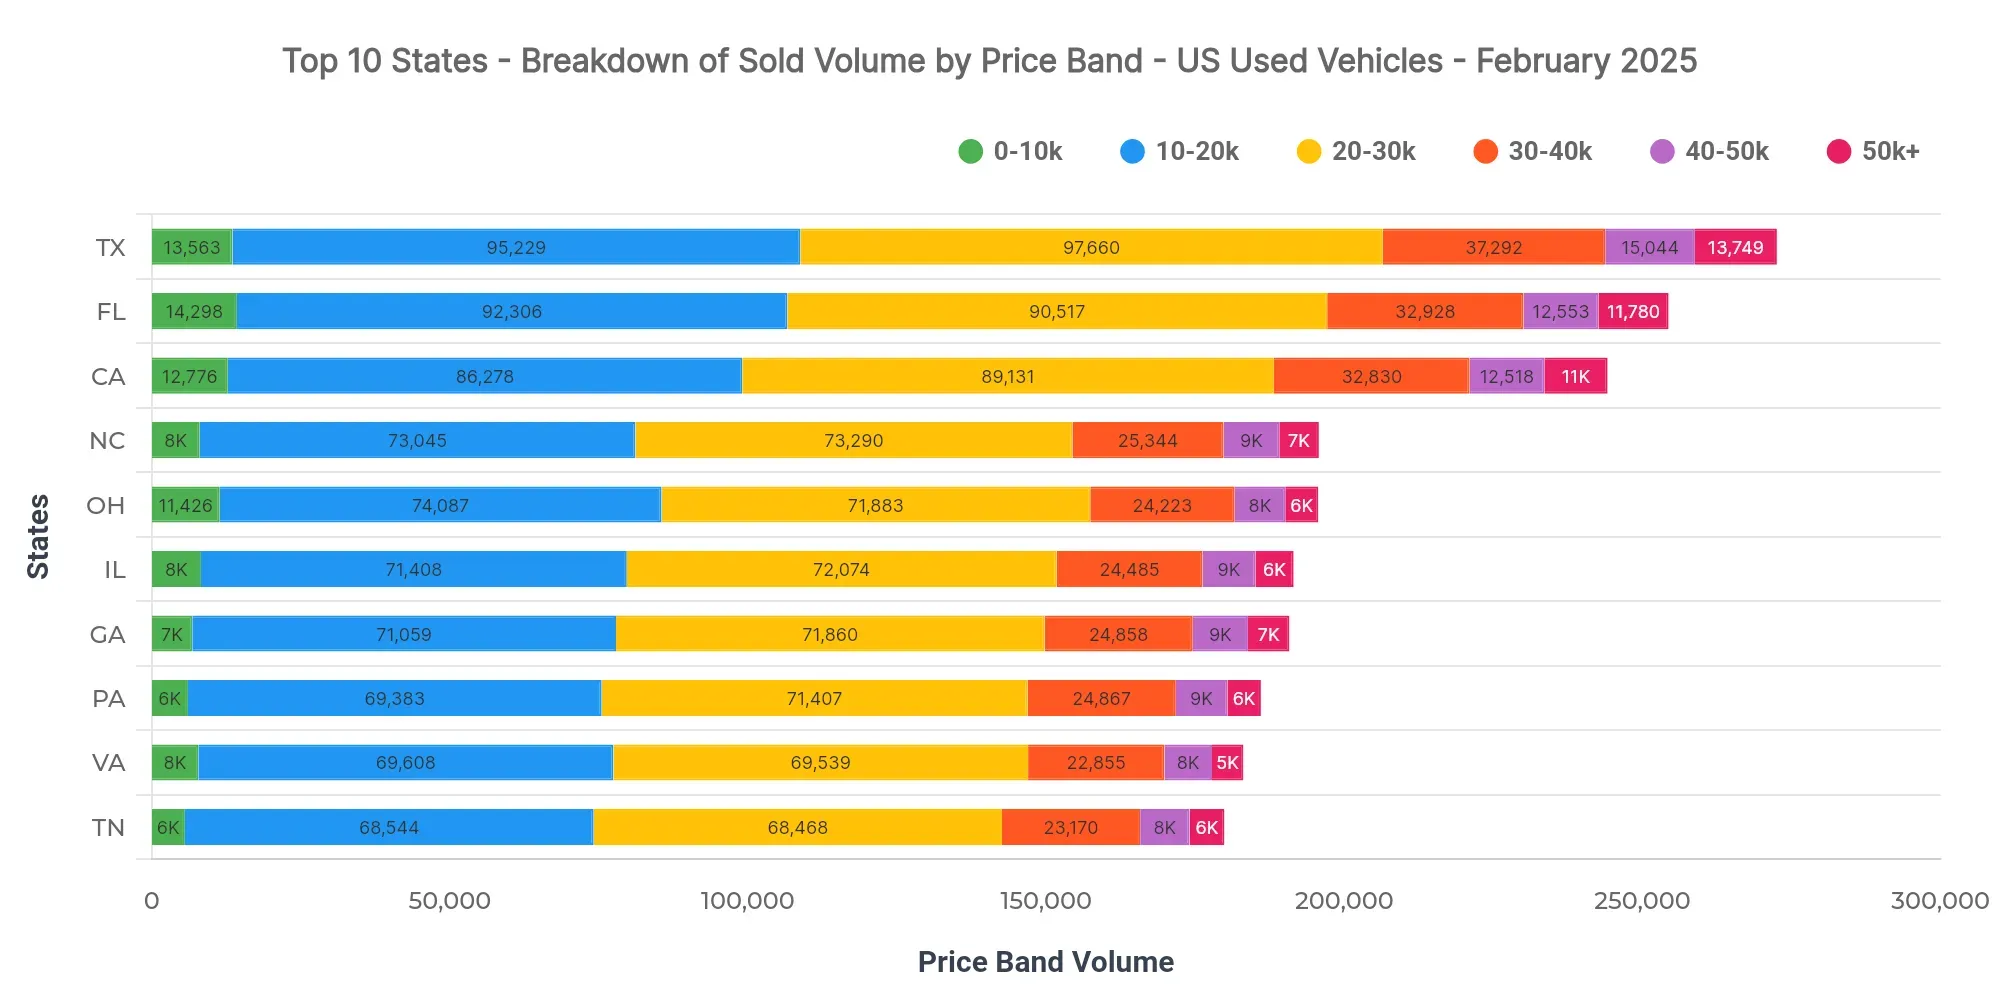
For Texas, the dominant price bands are $20K–$30K (35.8%), $10K–$20K (34.9%), with a notable presence in the $30K–$40K band (13.7%). The $40K–$50K band has a share of 5.5%, suggesting some higher-priced vehicles are being sold. Compared to Florida at $24,795 and California at $25,342, Texas's pricing strategy might focus heavily on mid-range market segments. Dealers should capitalize on the high share of mid-range sales, while pricing strategies and lending need to accommodate diverse consumer demands.
Market Breakdown by Fuel Types
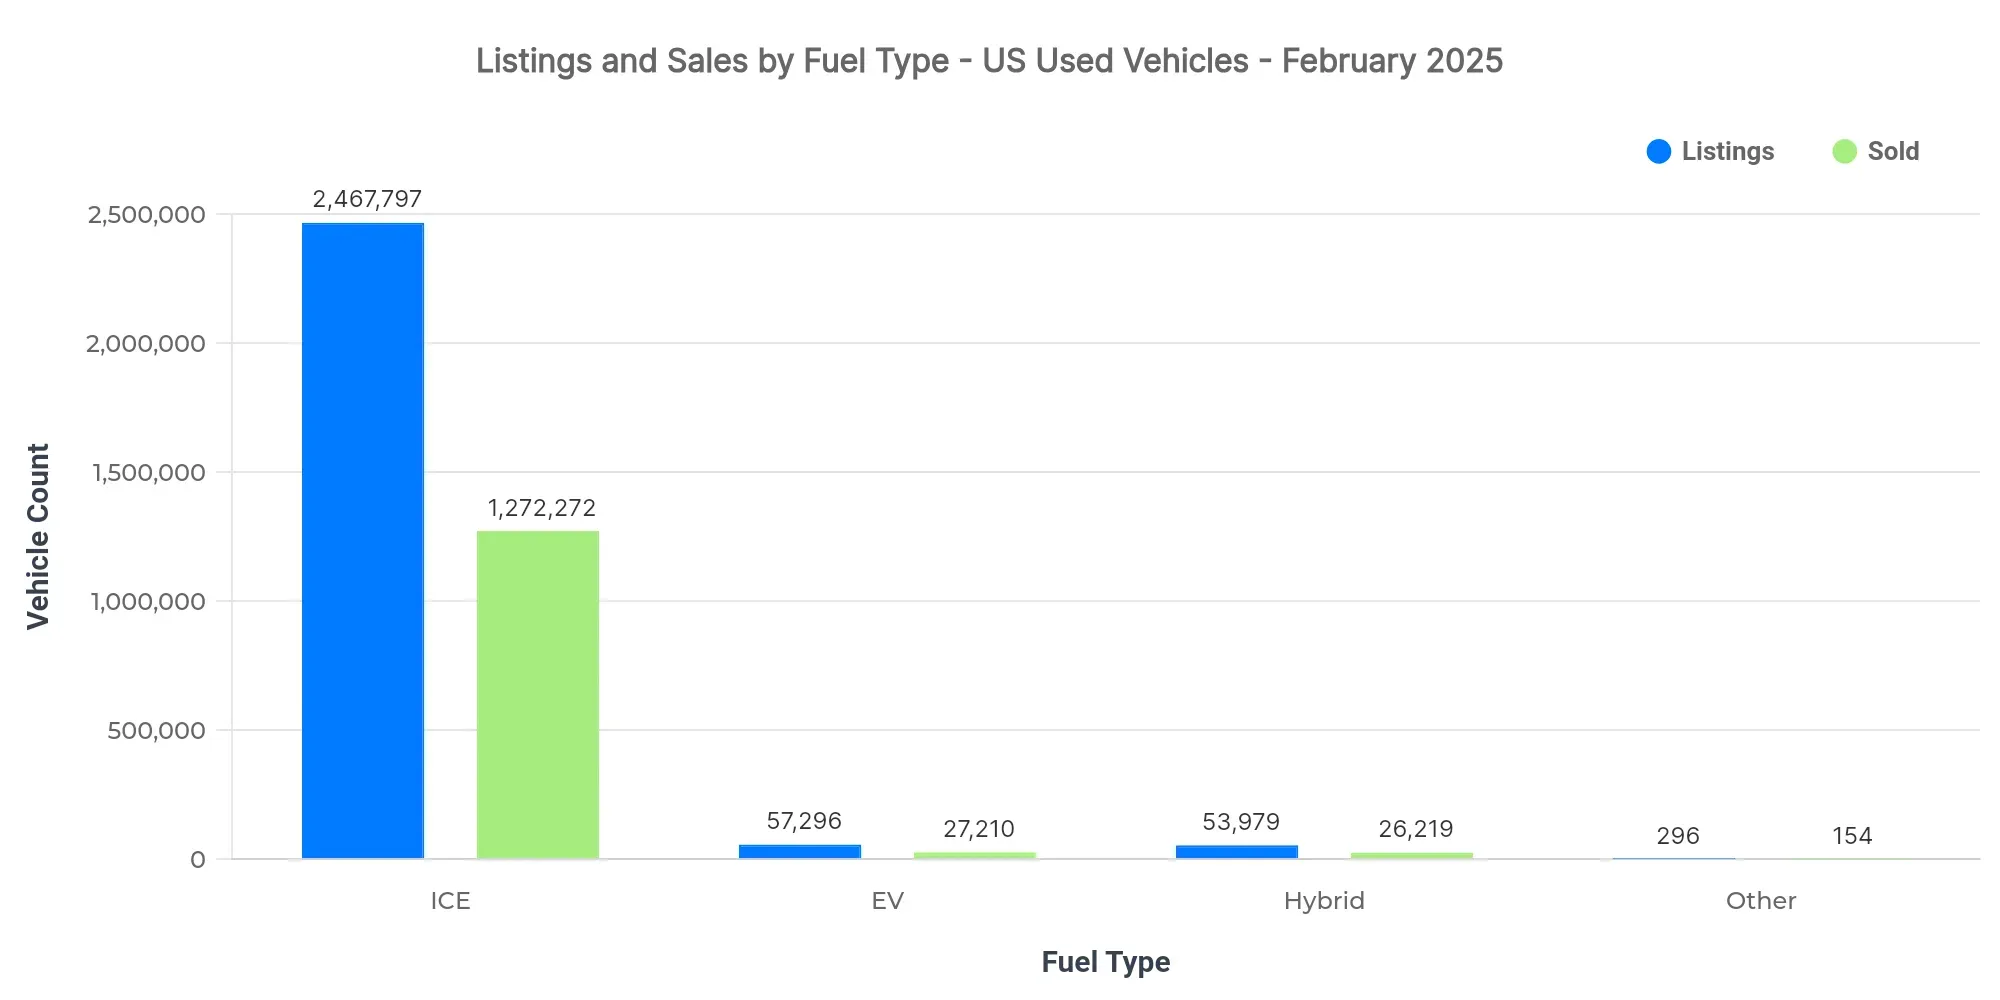
The dataset shows significant variance in the market dynamics across fuel types. ICE vehicles dominate both listings and sales. EVs and Hybrids exhibit premium pricing compared to ICE, although their sales volume is lower.
| Fuel Type | Listings Count | Sold Count | Avg Listing Price | Avg Sold Price |
|---|---|---|---|---|
| ICE | 2.47M | 1.27M | $24,899 | $24,602 |
| EV | 57.3K | 27.2K | $33,831 | $31,673 |
| Hybrid | 53.9K | 26.2K | $27,063 | $26,102 |
| Other | 296 | 154 | $14,128 | $14,476 |
- EV adoption shows steady growth driven by premium positioning.
- Price positioning highlights EVs and Hybrids as more expensive, limiting their broader adoption.
- Market dynamics suggest a continued dominant preference for ICE vehicles despite emerging alternatives.
Market Share by Body Types
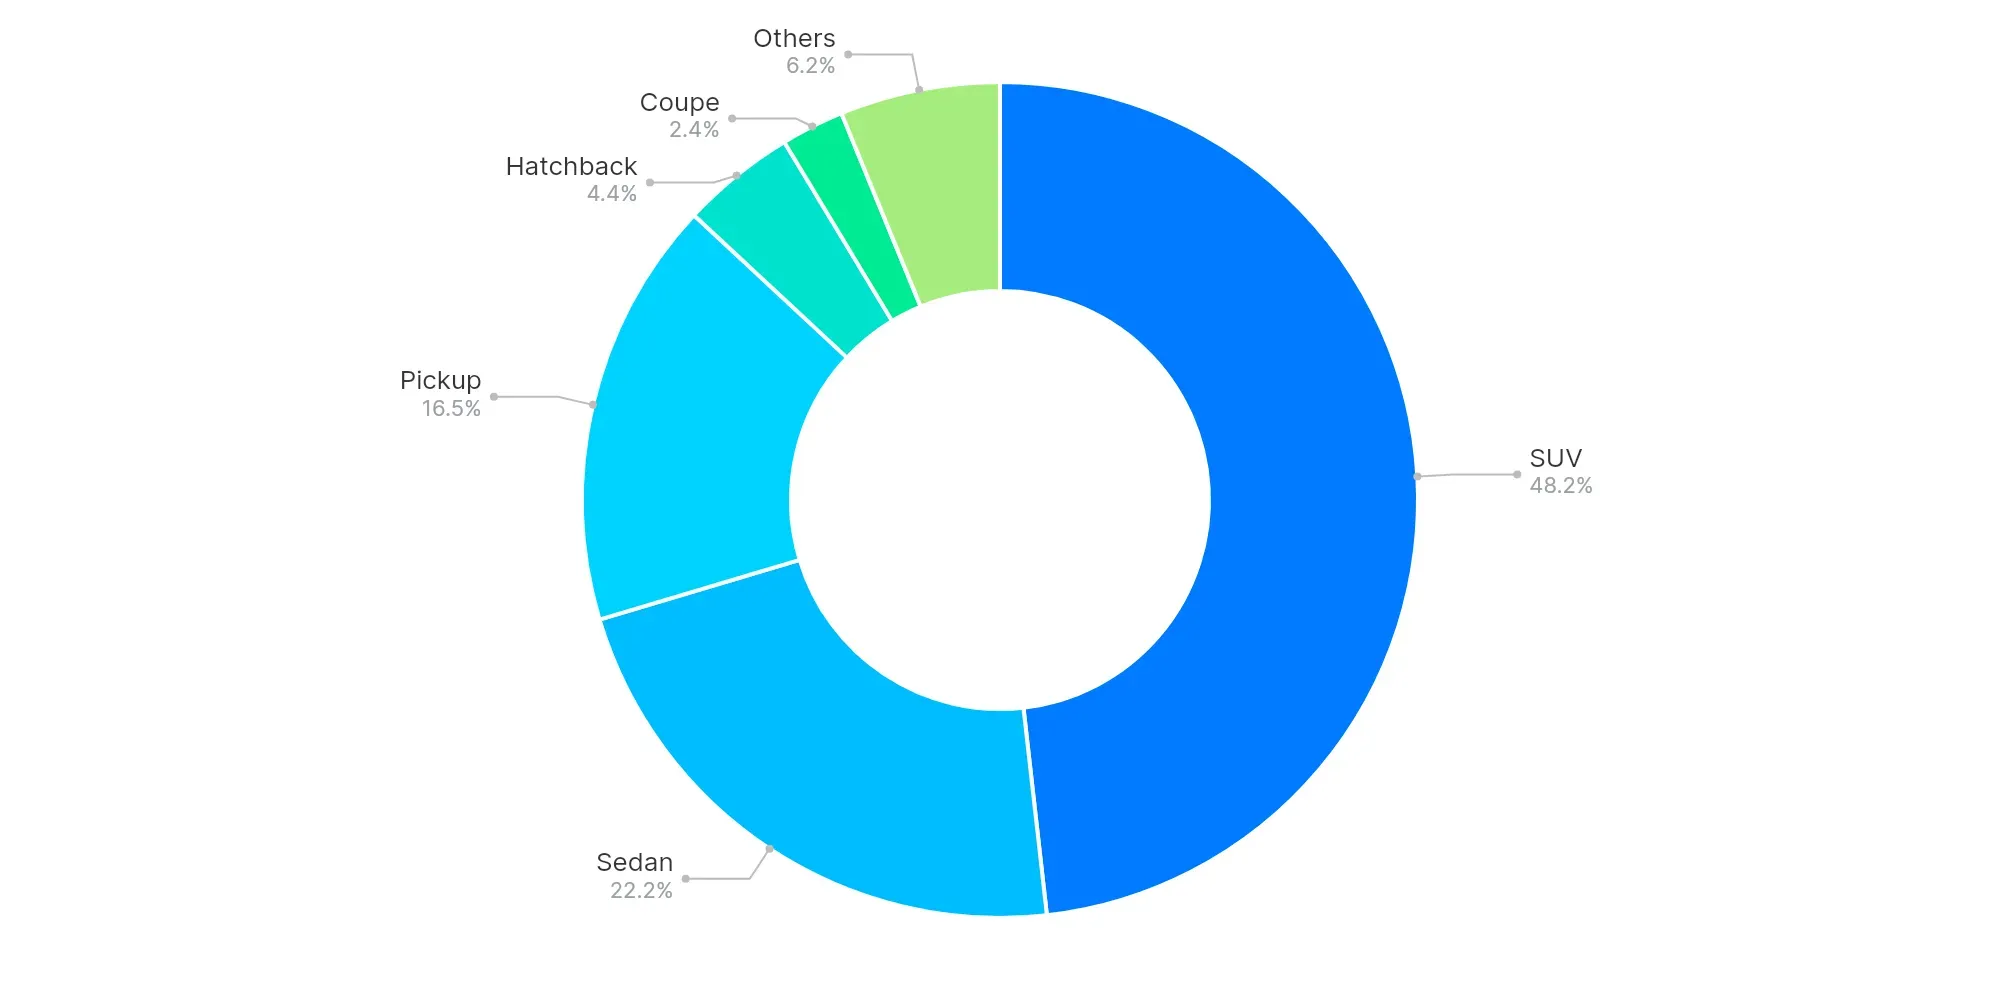
SUV (48.2%), Sedan (22.2%), and Pickup (16.5%) dominate body-type shares. Larger-vehicle segments, such as SUVs and Pickups, affirm their continued consumer preference, driven by versatility and utility.
Consumer preferences lean toward space and functionality, evident in the popularity of SUVs and Pickups.
High-Volume vs Low-Volume States (Executive Insights)
- Top-performing states: Texas, Florida, California
- Underpenetrated regions: Virgin Islands, American Samoa, Northern Mariana Islands
- Key price bands: $20K–$30K and $10K–$20K
- EV trend: Slow but increasing adoption
- Buyer preferences: Lean toward larger vehicles such as SUVs
The US used vehicle market in February 2025 remains robust, with notable activity centered in populous states. Dealers should focus on optimizing medium-range and fuel-efficient offerings to capture consumer interest and regional market share, while monitoring the growing interest in EVs for future opportunities.