

US Monthly Used Car Market Data – February 2024
The February 2024 report on the US used car market provides analysis on dealership operations, sales volumes, pricing trends, fuel type preferences, body type distribution, and regional market performance. This monthly report serves as a critical resource for understanding market dynamics in the used vehicle sector across the United States.
Number of Dealerships by State
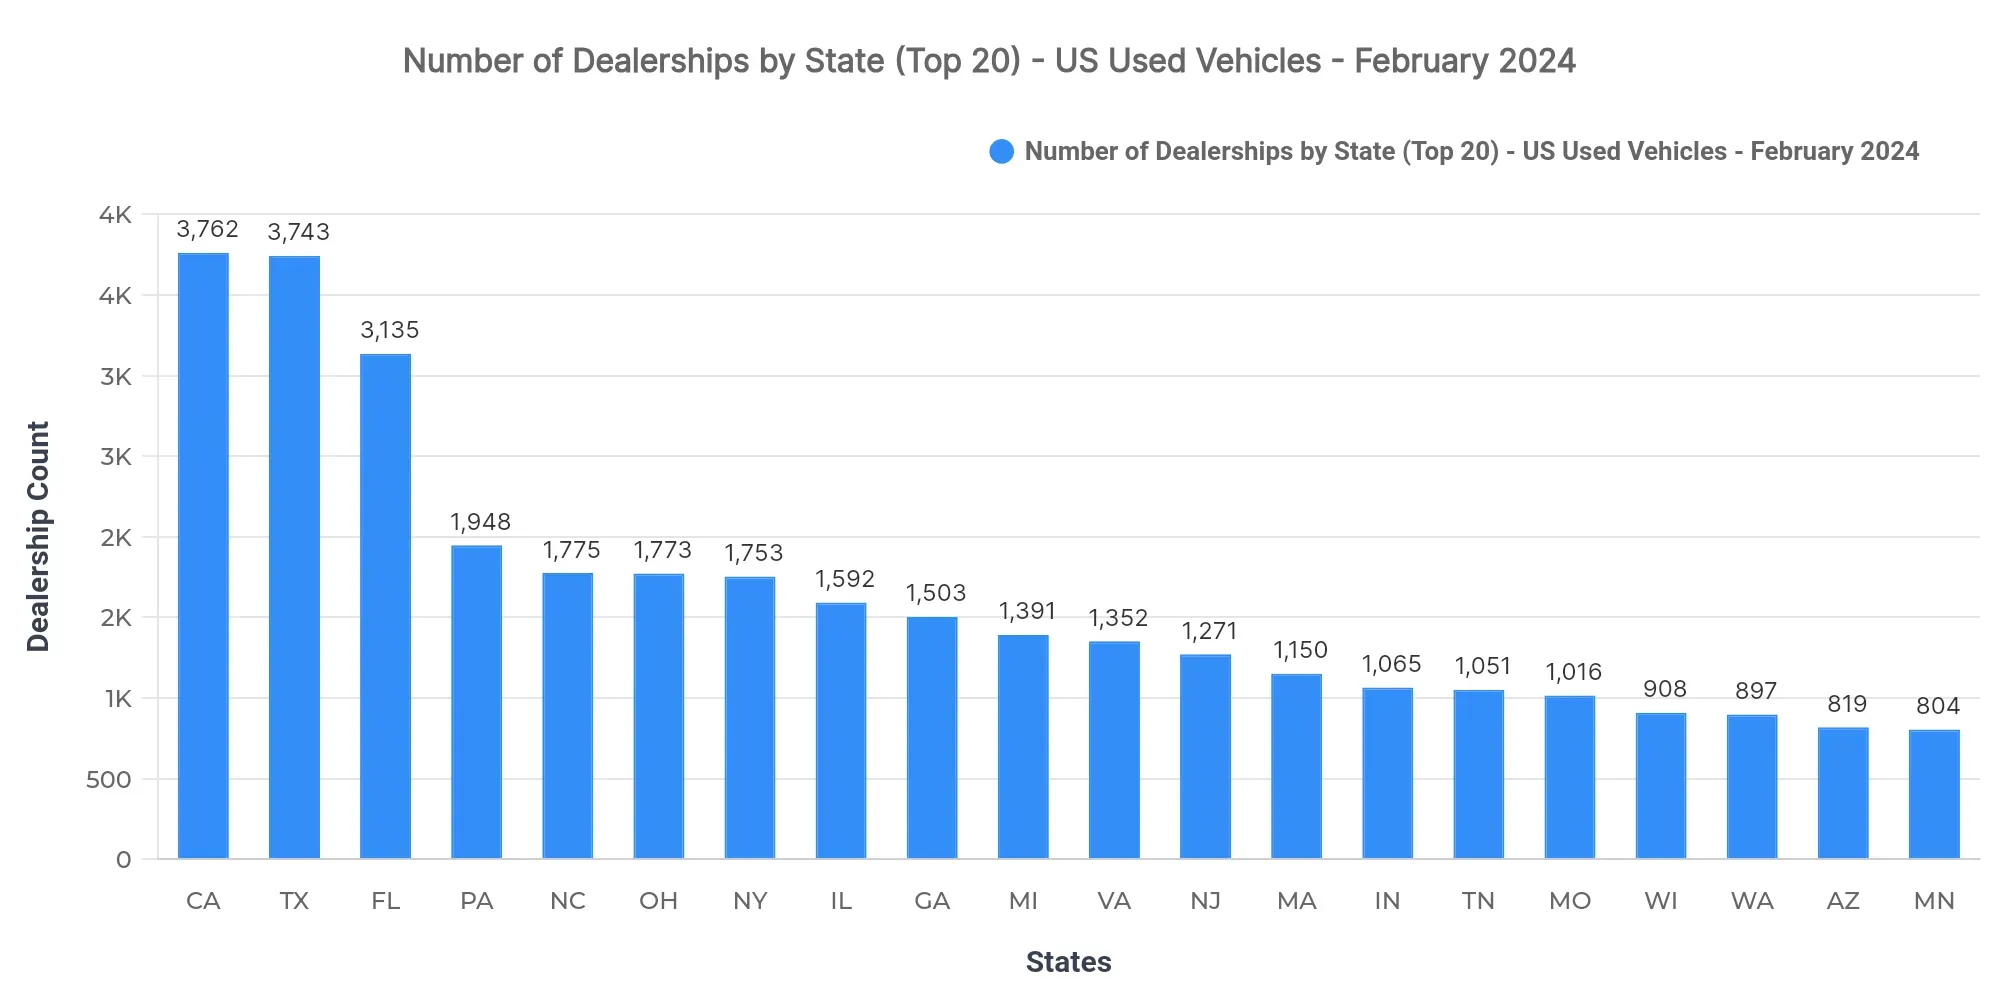
California (3,762), Texas (3,743), and Florida (3,135) lead in dealership counts. These states indicate high market saturation, offering extensive options for consumers but suggesting competitive pressures for dealers to differentiate. Focusing inventory diversity could be crucial for standing out in such concentrated markets.
Top 10 States by Sold Volume
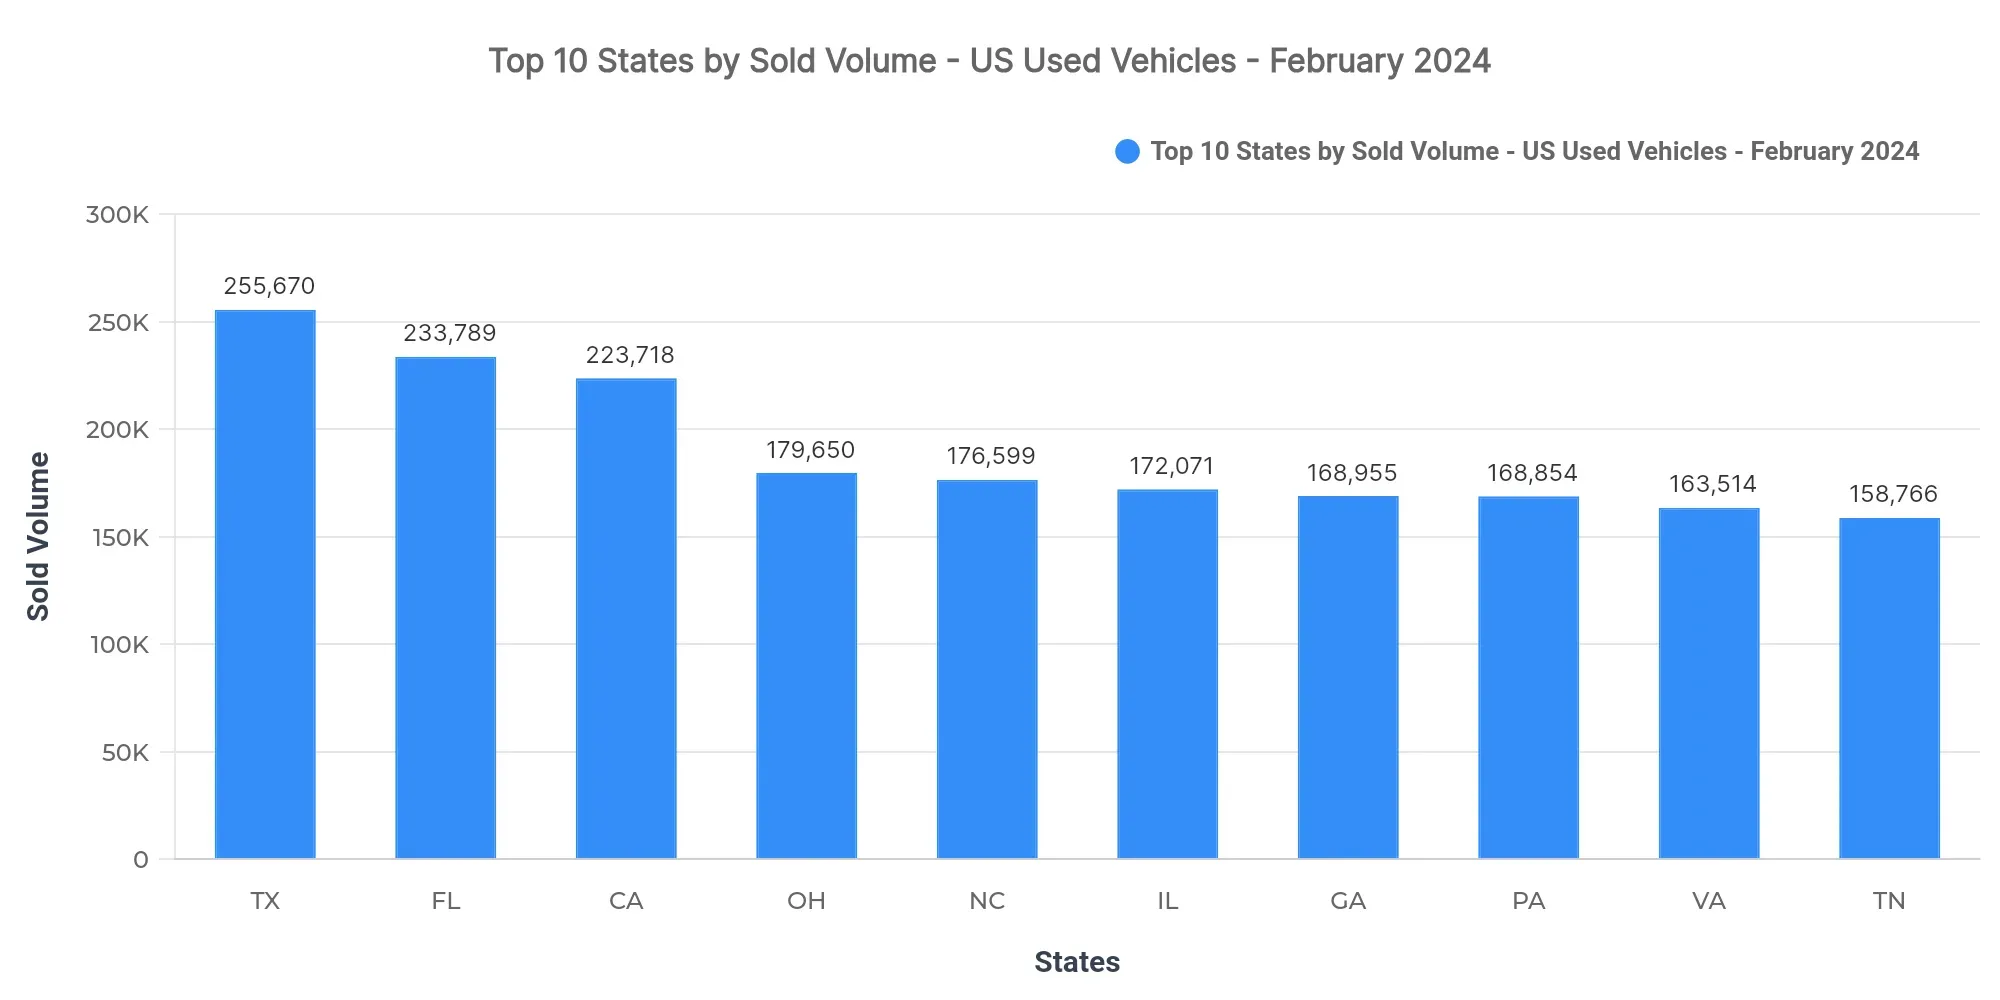
Texas (255,670), Florida (233,789), and California (223,718) lead in sold volumes, with a combined share of 11.7% of the national sold volume. The remaining top 10 states include Ohio, North Carolina, Illinois, Georgia, Pennsylvania, Virginia, and Tennessee. This concentration in the top three states reflects a pivotal role in national sales dynamics.
High sales volumes in leading states hint at robust dealer networks and consumer demand. Meanwhile, a pattern of increased buyer activity is noticeable in states with growing population and economic benefits, such as North Carolina and Georgia.
Price Breakdown: Top 10 States by Sold Volume
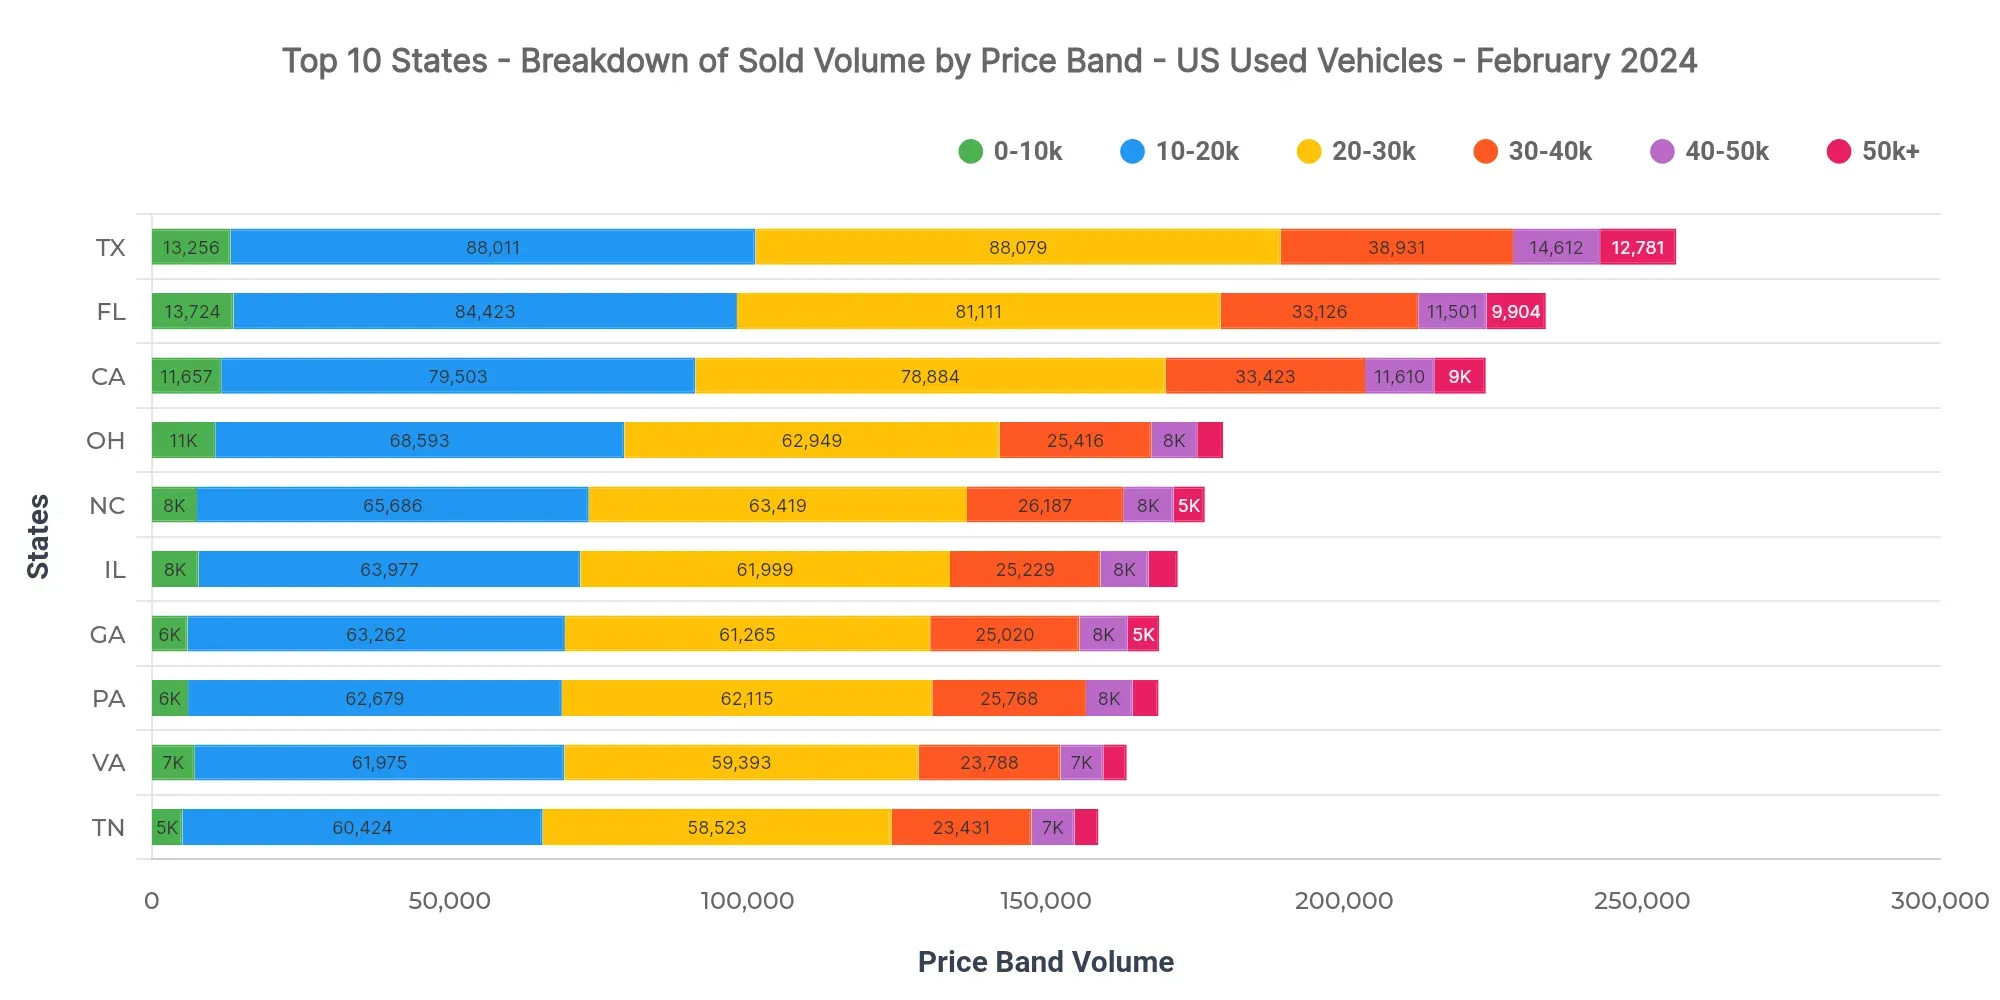
In Texas, $20K–$30K (34.5%), $10K–$20K (34.4%), and $30K–$40K (15.2%) are the dominant price bands. Additionally, the $40K–$50K (5.7%) segment provides notable higher-end activity. Comparatively, Florida at $24,755 and California at $25,298 reflect similar trends but at slightly elevated average prices. Dealers should stock inventory within dominant price bands to capture market share, while lenders might focus on competitive financing for these key bands.
Market Breakdown by Fuel Types
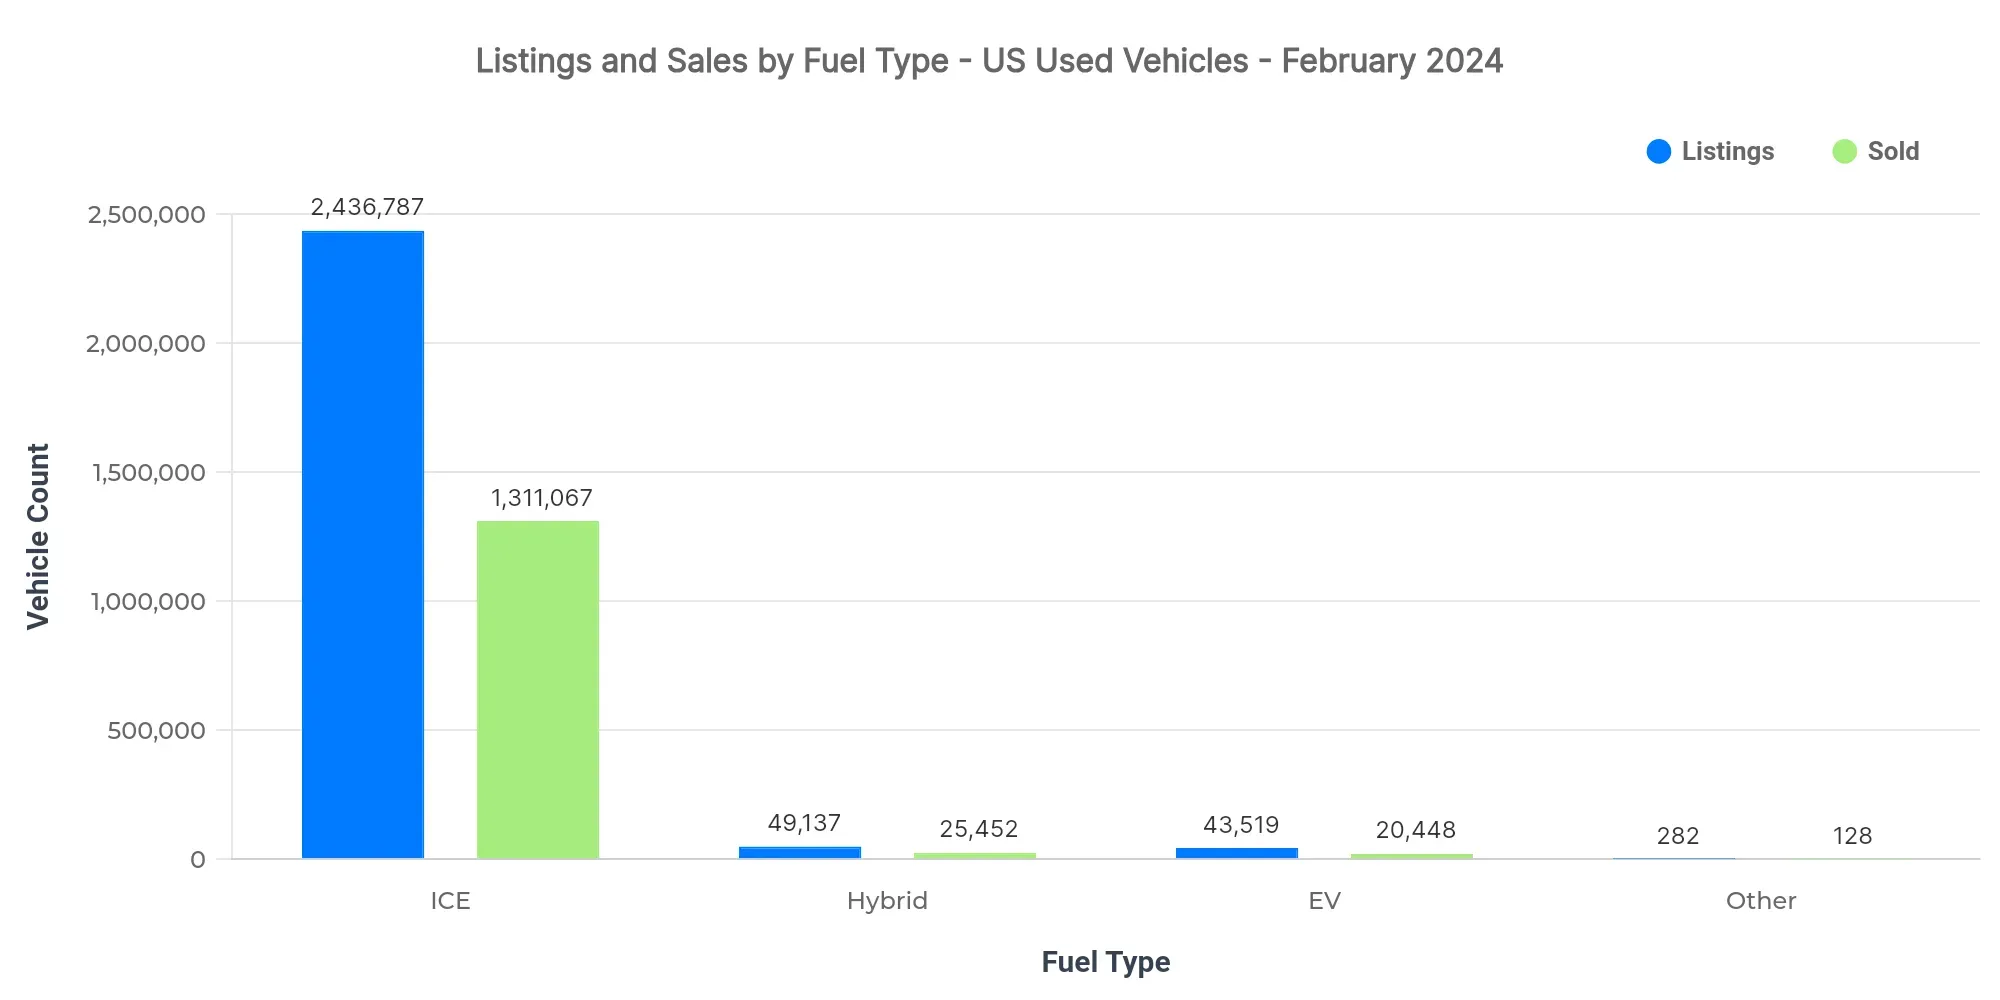
The used vehicle market in February 2024 comprises various fuel types, with Internal Combustion Engine (ICE) vehicles being predominant in both listings and sales. Hybrid vehicles are gaining traction amid increasing ecological awareness, while electric vehicles continue to command premium pricing but are yet to match ICE in volume.
| Fuel Type | Listings Count | Sold Count | Avg Listing Price | Avg Sold Price |
|---|---|---|---|---|
| ICE | 2.44M | 1.31M | $25,181 | $24,488 |
| Hybrid | 49.1K | 25.5K | $27,035 | $25,446 |
| EV | 43.5K | 20.4K | $34,465 | $32,974 |
| Other | 282 | 128 | $15,761 | $15,119 |
- EV adoption is rising, but ICE dominates in volumes.
- Efficient price positioning observed for hybrids.
- ICE vehicles maintain efficiency due to their availability.
Market Share by Body Types
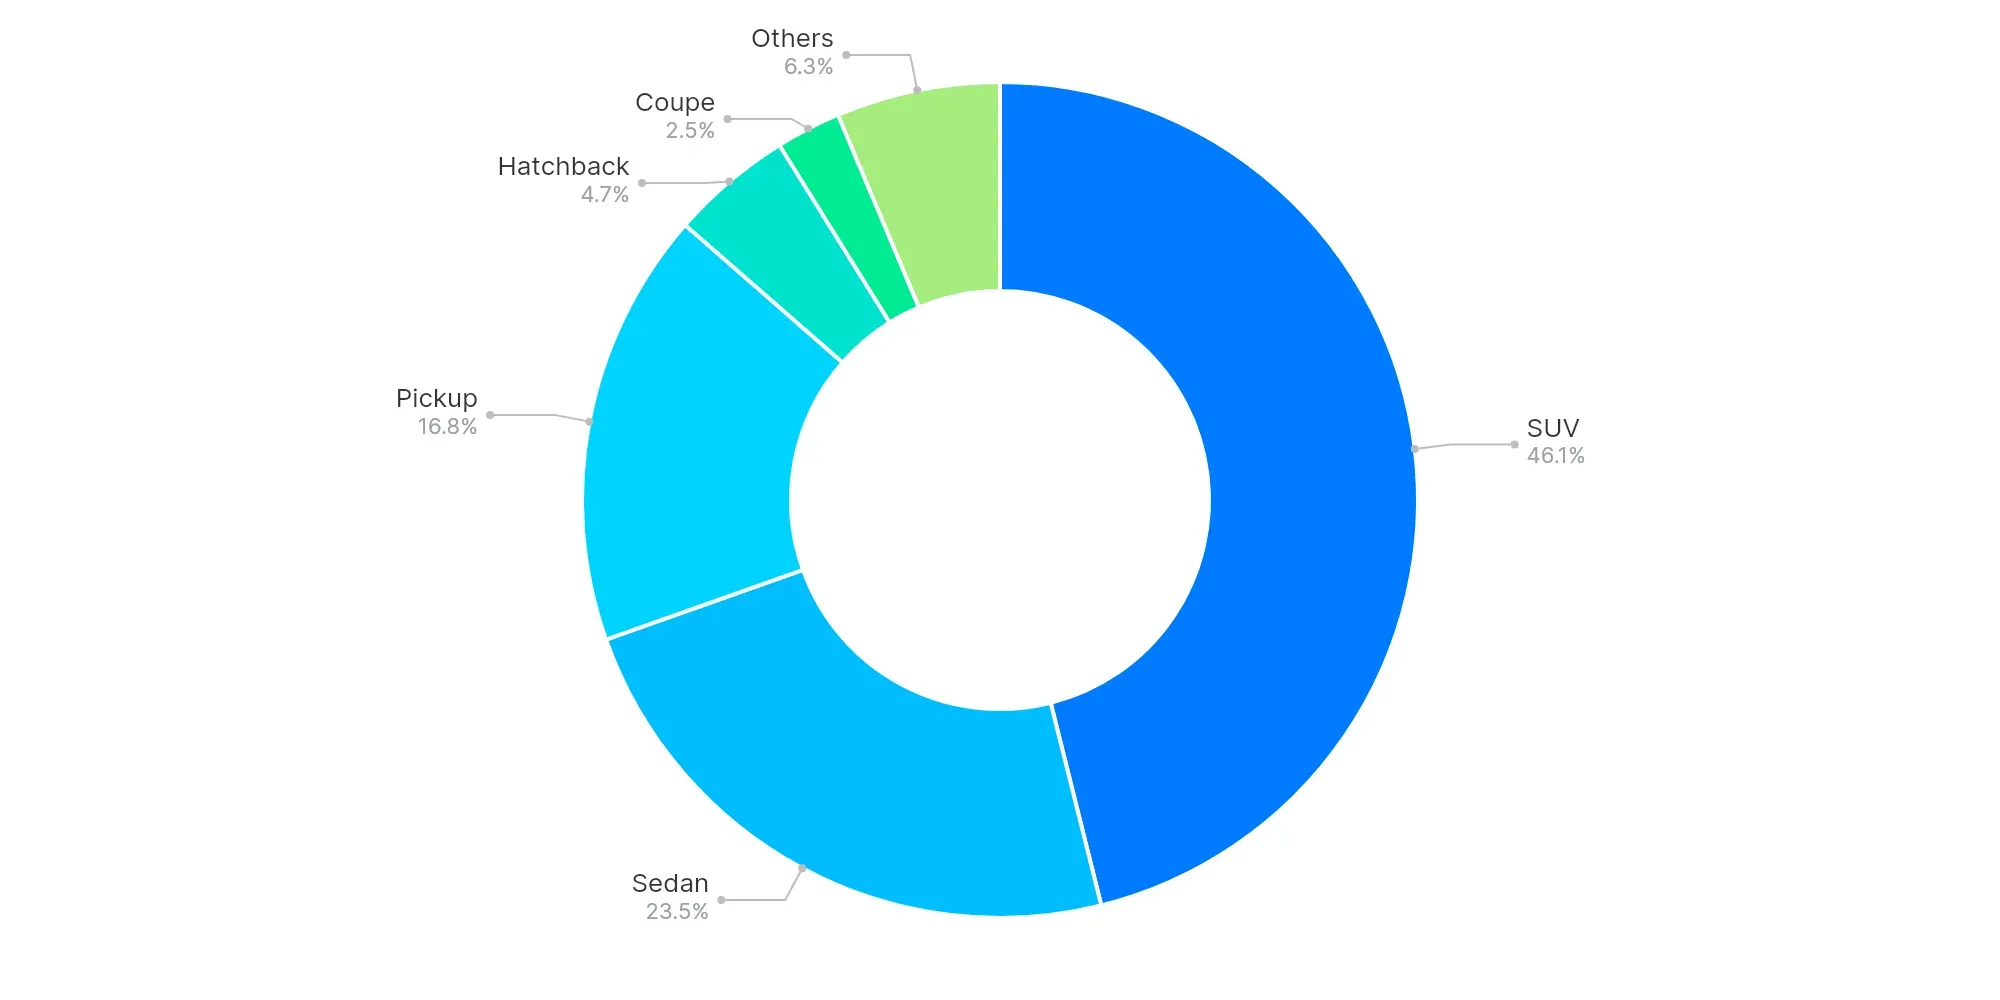
SUVs (46.1%), Sedans (23.5%), and Pickups (16.8%) dominate the market share by body types, reinforcing the preference for larger and versatile vehicle types. This trend indicates a strong consumer inclination towards spaciousness and practicality, with SUVs and Pickups particularly standing out due to their flexibility in urban and rural settings alike.
High-Volume vs Low-Volume States (Executive Insights)
- Top-performing states: Texas, Florida, California
- Underpenetrated regions: Virgin Islands, American Samoa, Northern Mariana Islands
- Key price bands: $20K–$30K, $10K–$20K, $30K–$40K
- EV trend: Gradual but steady adoption with premium pricing
- Buyer preferences: Strong affinity for SUVs and Pickups
As the US used vehicle market evolves, significant opportunities exist in addressing regional demand disparities and adjusting inventory strategies to consumer preferences. Dealers and analysts should leverage these insights to optimize operations and capture market potential effectively.