

US Monthly Used Car Market Data – December 2025
This report provides an analysis of the US used car market for December 2025, covering dealer activity, sales volume, pricing, fuel types, body types, and regional performance. Key insights and implications are drawn to help understand current trends and market dynamics without restating full data sets.
Number of Dealerships by State
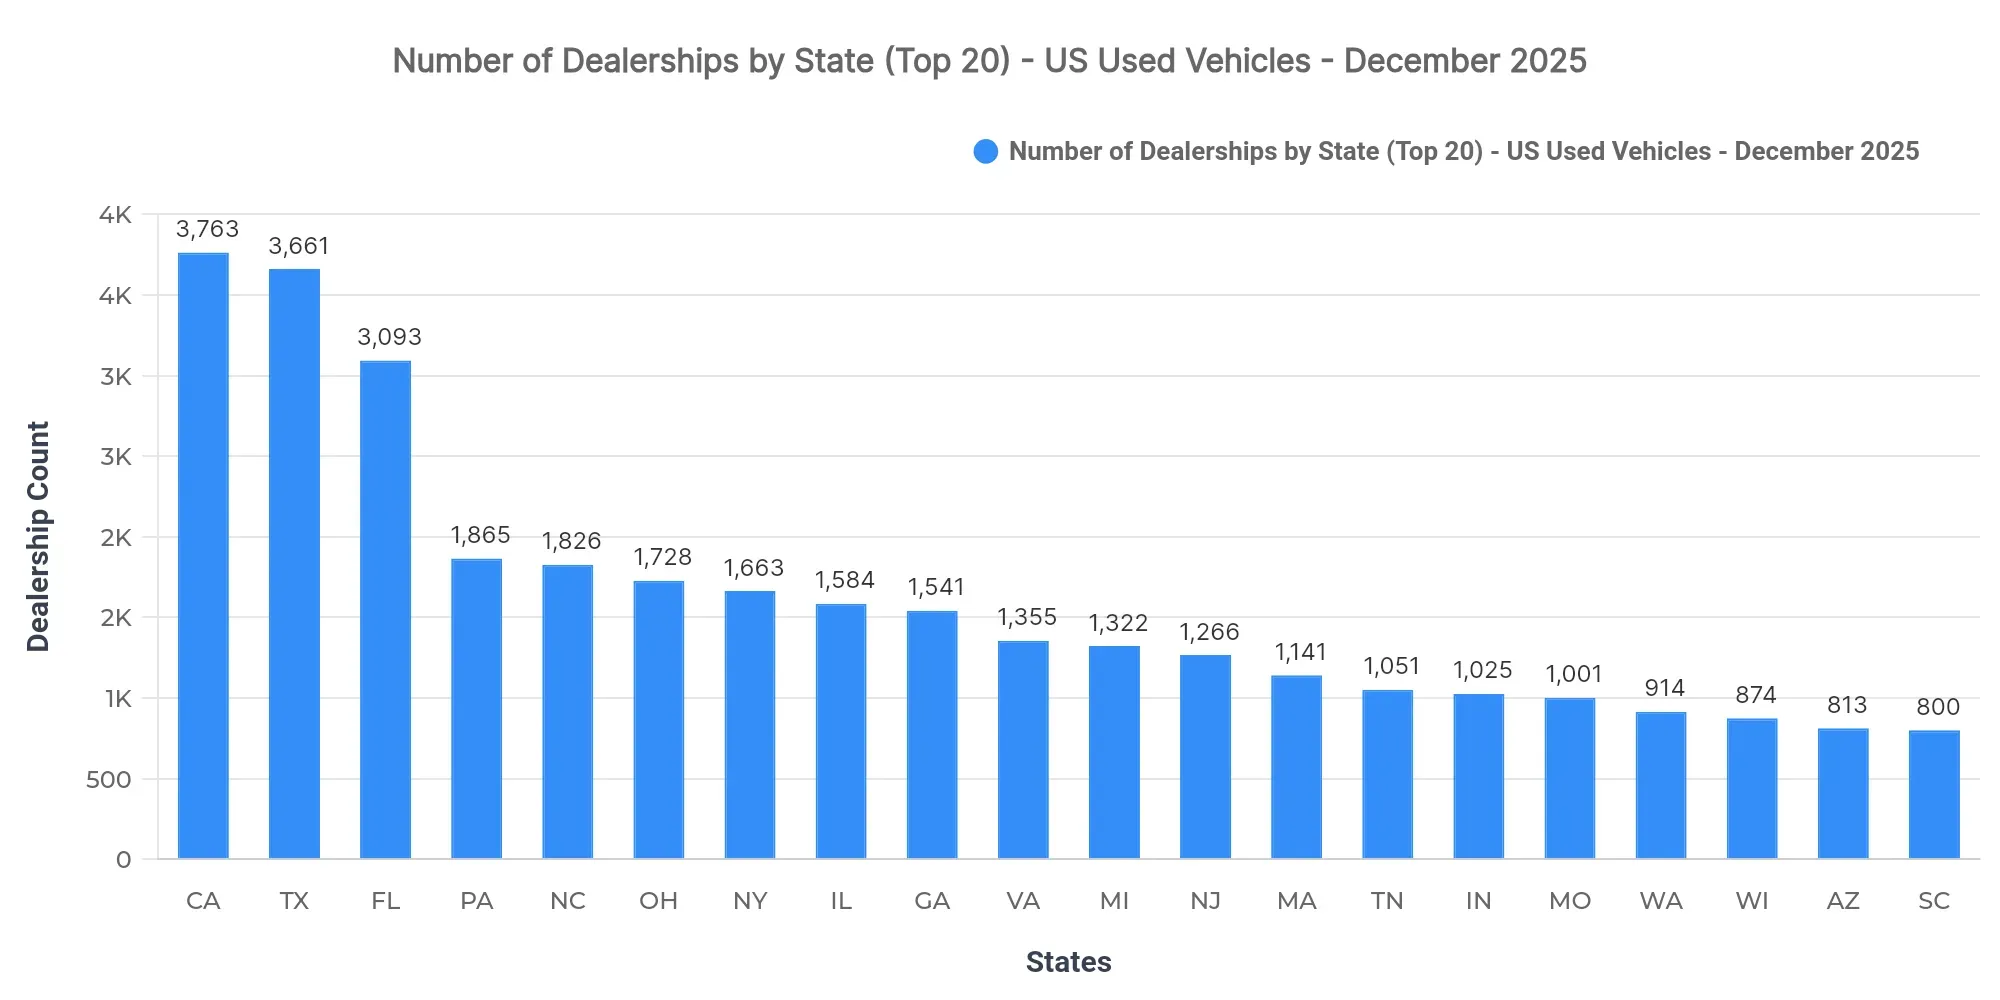
California (3,763), Texas (3,661), and Florida (3,093) lead in dealership counts, indicating a strong presence and potential saturation in these states. A high concentration of dealerships suggests an intensely competitive market that may pressure margins. These states are cornerstones for dealer operations, providing both a challenge in competition and an opportunity due to large consumer bases.
Top 10 States by Sold Volume
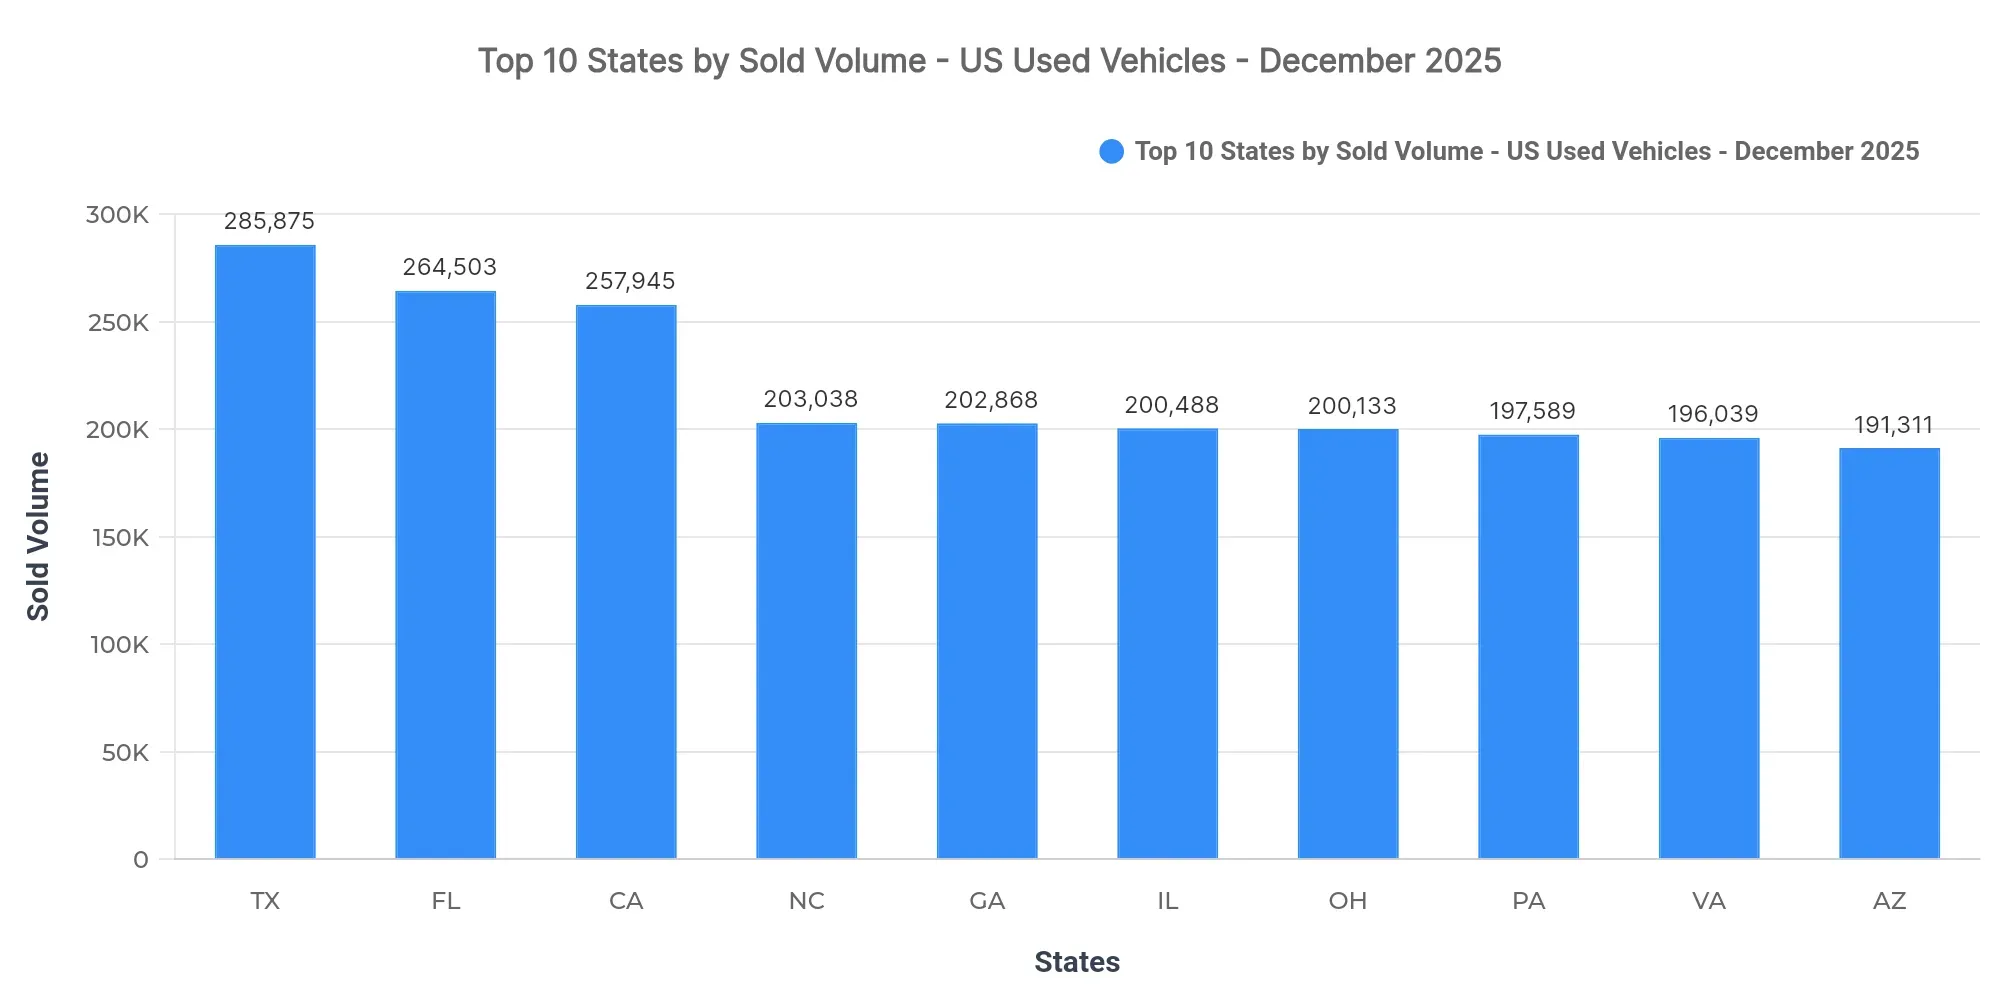
Texas (285,875), Florida (264,503), and California (257,945) lead in sold volumes, together comprising 11.2% of the national sold volume. The remaining top-10 states include North Carolina, Georgia, Illinois, Ohio, Pennsylvania, Virginia, and Arizona.
Market concentration in these top states indicates robust demand and offers dealerships opportunities for inventory turnover. These regional patterns underscore the economic vitality of the South and West, with strong auto sales reflecting broader trends of population growth and urbanization in these areas.
Price Breakdown: Top 10 States by Sold Volume
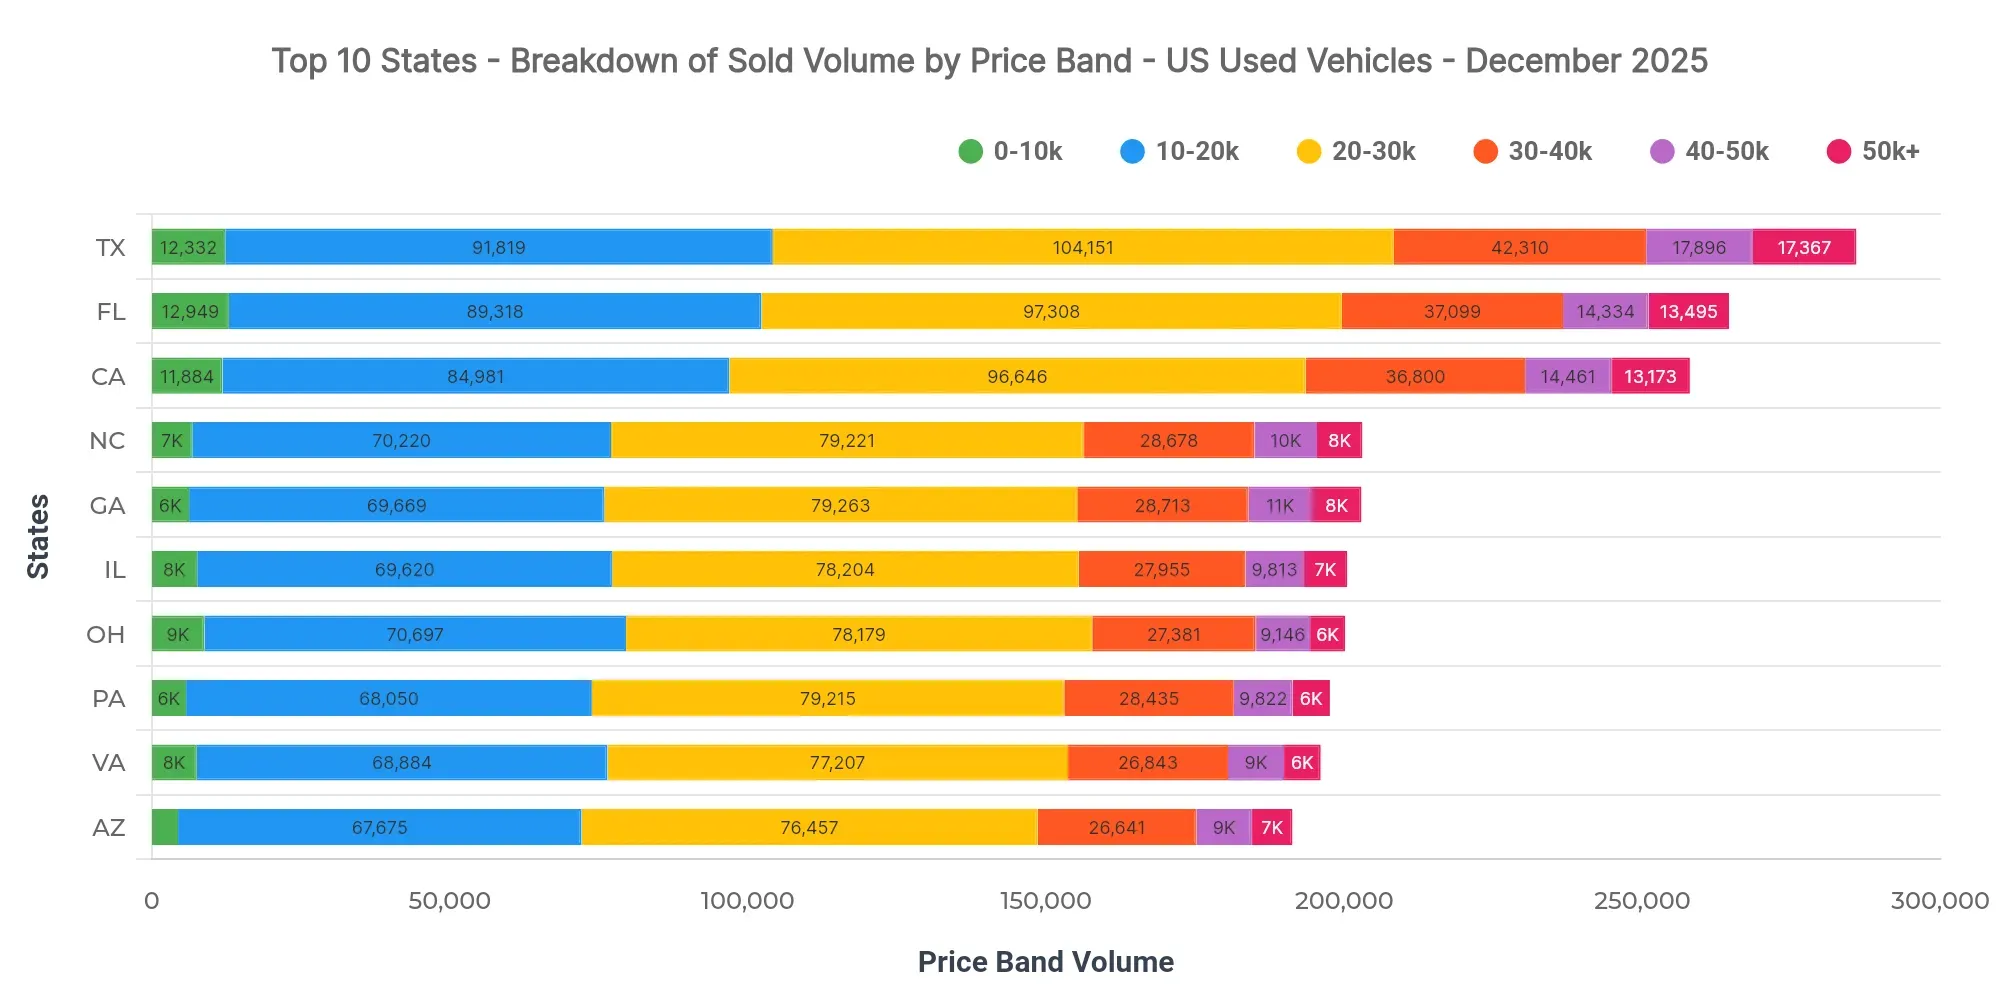
In Texas, the dominant price bands are $20K–$30K (36.4%) and $10K–$20K (32.1%), highlighting affordability as a key sales driver. The $30K–$40K band accounts for 14.8%, showing less activity but still significant presence. Georgia at $25,280 and North Carolina at $25,443 reflect competitive pricing in neighboring states.
Dealers could leverage Texas' strong mid-range market by aligning inventory with high-demand price bands. Financial institutions should consider financing strategies that cater to these prevalent price ranges to enhance lending portfolios.
Market Breakdown by Fuel Types
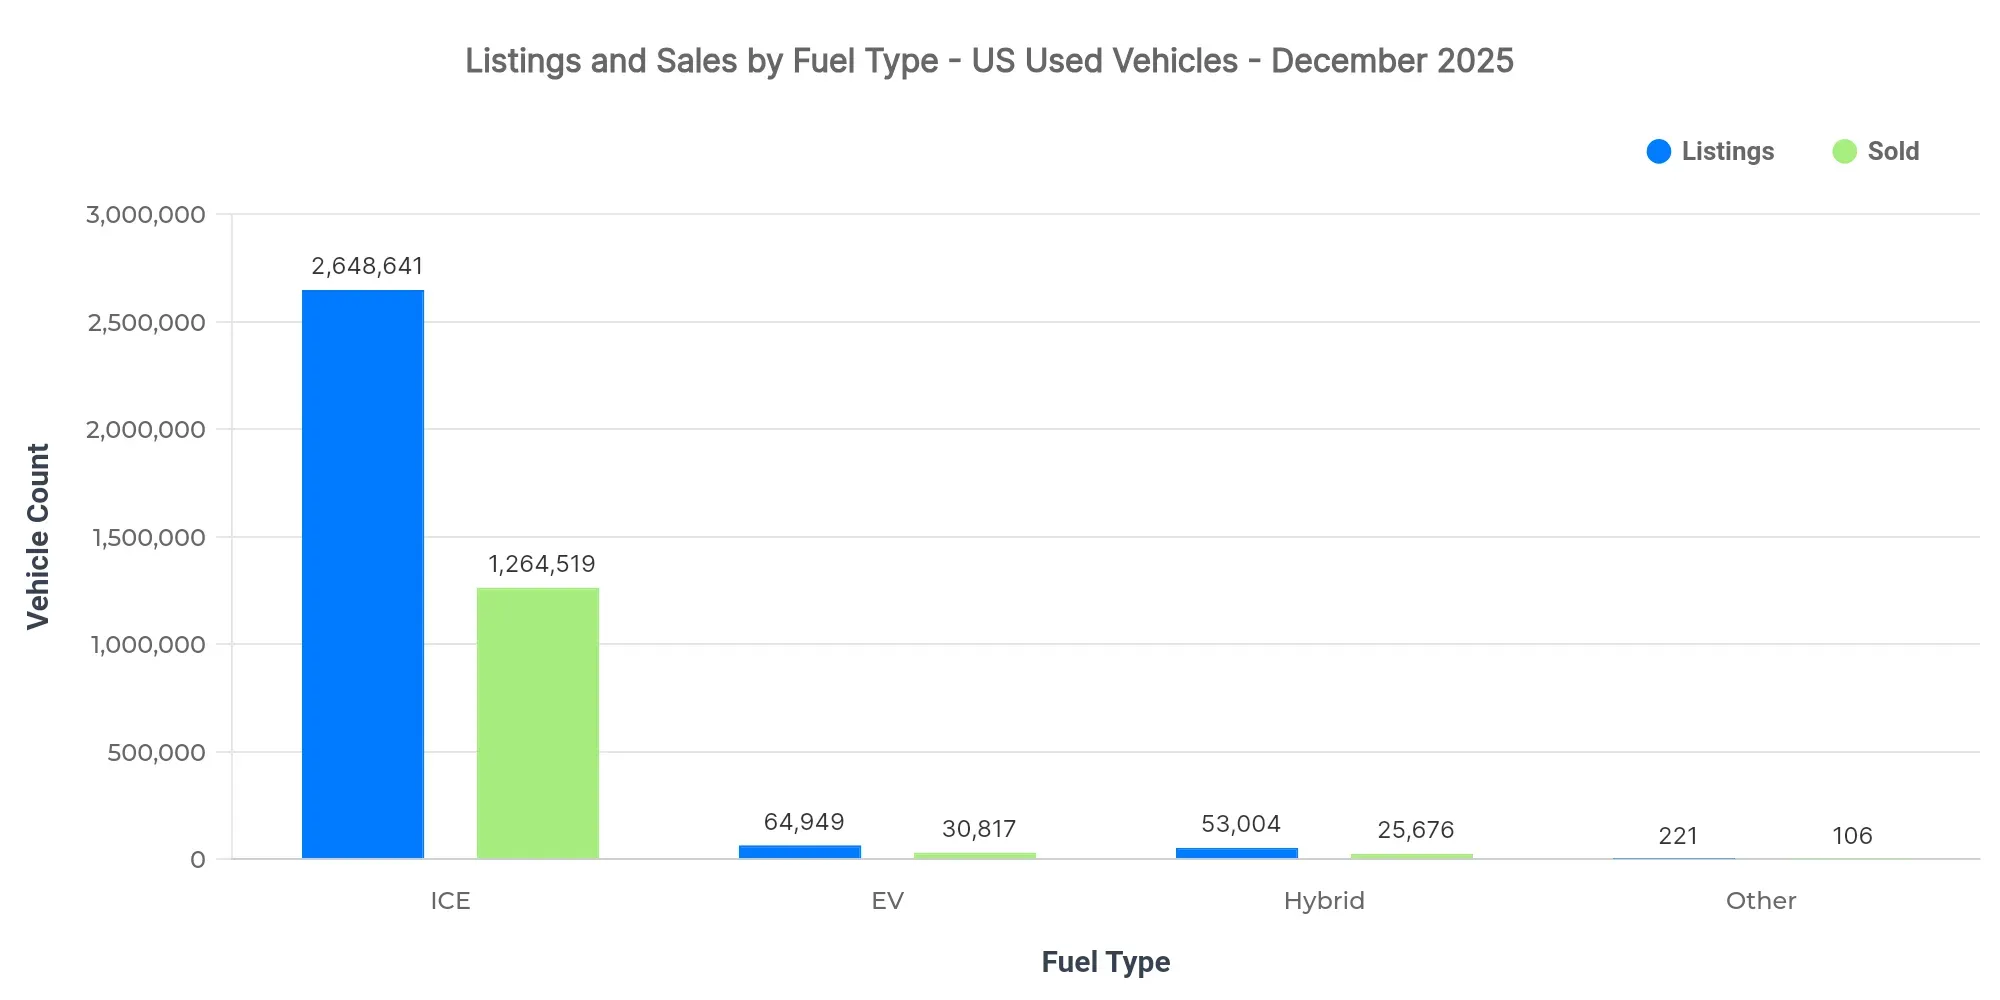
| Fuel Type | Listings Count | Sold Count | Avg Listing Price | Avg Sold Price |
|---|---|---|---|---|
| ICE | 2.65M | 1.26M | $23,789 | $25,146 |
| EV | 64.95K | 30.82K | $31,534 | $31,609 |
| Hybrid | 53.00K | 25.68K | $27,761 | $27,110 |
| Other | 221 | 106 | $10,727 | $13,999 |
- EV adoption shows growth, though ICE vehicles dominate both listings and sales.
- EVs command premium pricing, highlighting their ongoing market differentiation.
- Hybrid vehicles offer a balance with moderate pricing and sales, appealing to environmentally conscious consumers.
Market Share by Body Types
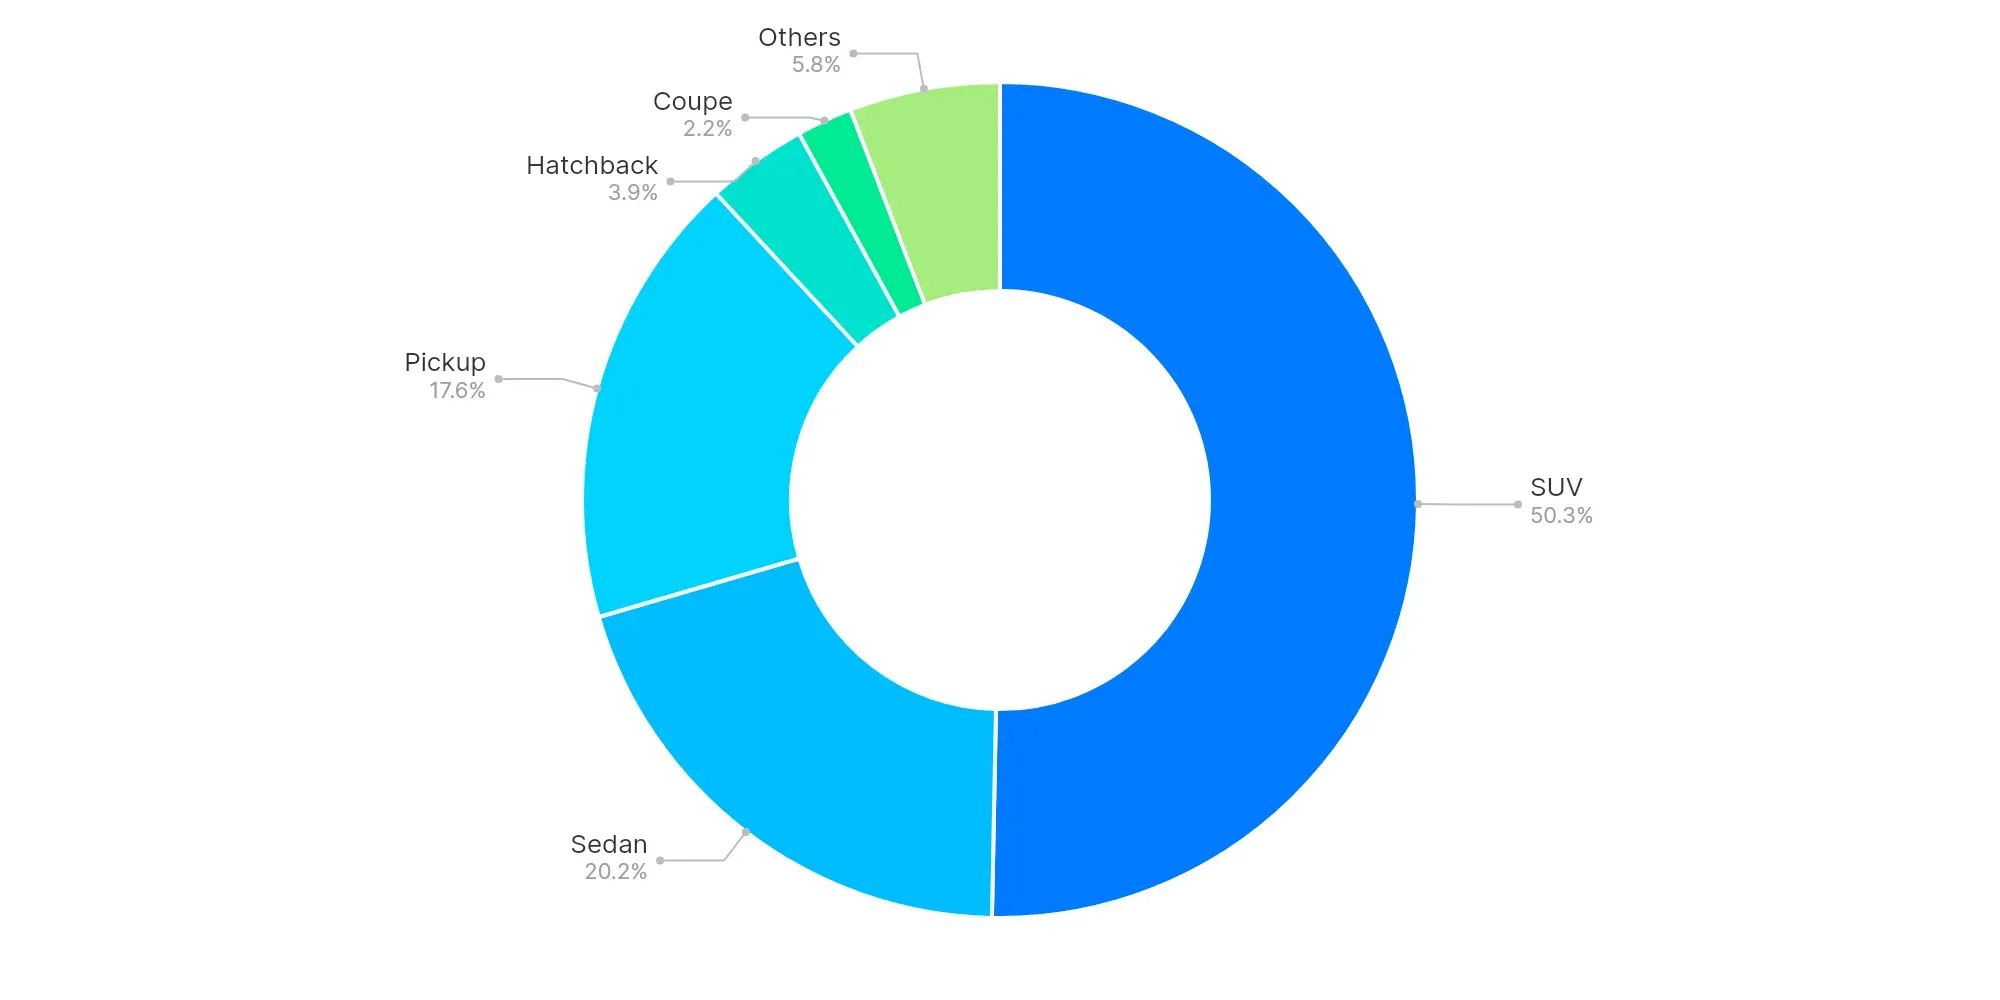
SUV (50.3%), Sedan (20.2%), and Pickup (17.6%) dominate the body type shares. The prominence of SUVs and Pickups suggests a consumer tilt towards larger, versatile vehicles that meet diverse lifestyle needs and preferences. The continued dominance of these segments indicates that consumer preference is shifting towards larger and more utility-focused vehicles.
High-Volume vs Low-Volume States (Executive Insights)
- Top-performing states: Texas, Florida, and California.
- Underpenetrated regions: Virgin Islands, American Samoa, and Northern Mariana Islands.
- Key price bands: $20K–$30K and $10K–$20K.
- Increasing attention towards EVs, indicating a rising shift in consumer and dealer focus.
- Consumer preference trends towards larger vehicles, such as SUVs and Pickups.
The used car market in December 2025 shows a steady direction with robust demand in key states and a strong preference for mid-range pricing segments. Dealers should optimize inventory around high-demand price bands and fuel types while analysts may focus on market dynamics driving SUV and vehicle type preferences to align future strategies with consumer trends.