

US Monthly Used Car Market Data – April 2024
The April 2024 report on the US used vehicle market provides an in-depth analysis of dealer activity, sales volume, pricing, fuel and body types, and regional performance. This overview offers actionable insights for dealers and analysts seeking to understand key trends and market dynamics.
Number of Dealerships by State
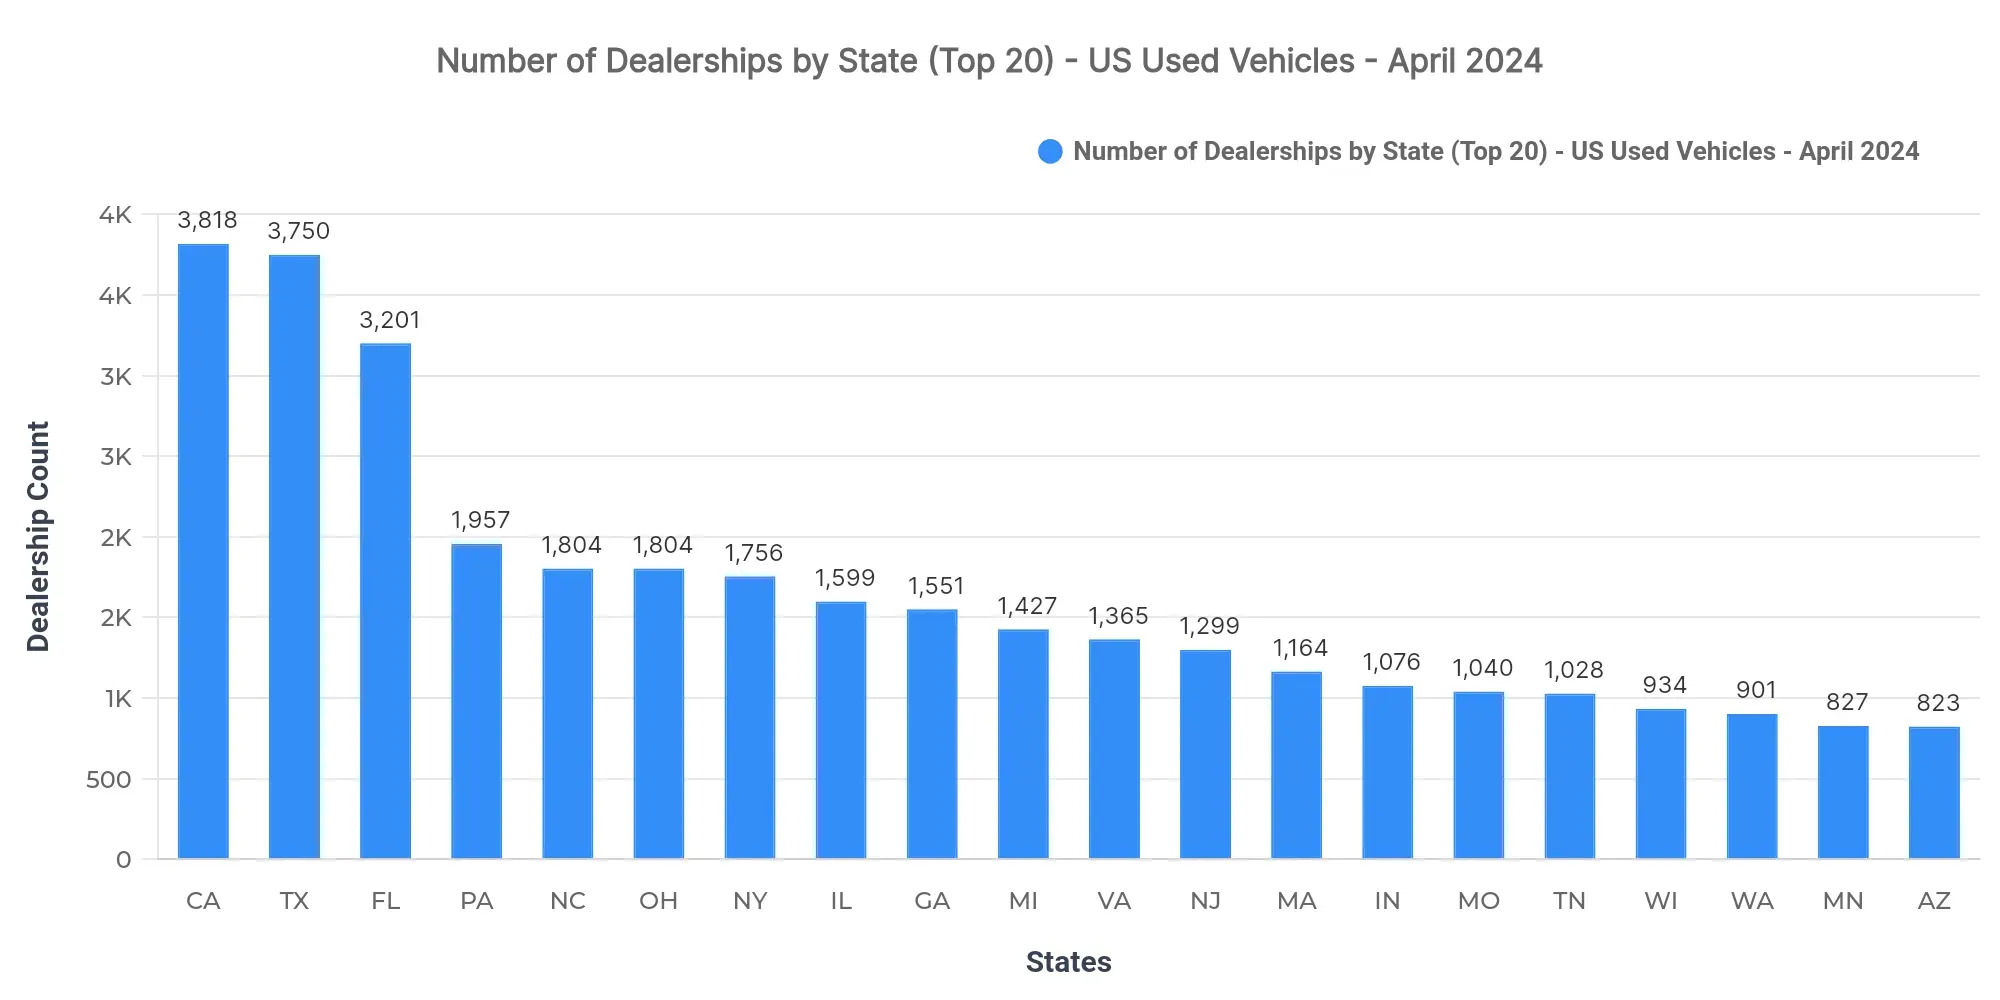
California (3,818), Texas (3,750), and Florida (3,201) lead in dealership counts. This concentration suggests a robust market presence in these states, offering numerous opportunities for buyers and sellers alike to engage with a wide array of vehicles. The high number of dealerships also implies a competitive environment, pushing dealers to differentiate by quality and service rather than volume alone.
Top 10 States by Sold Volume
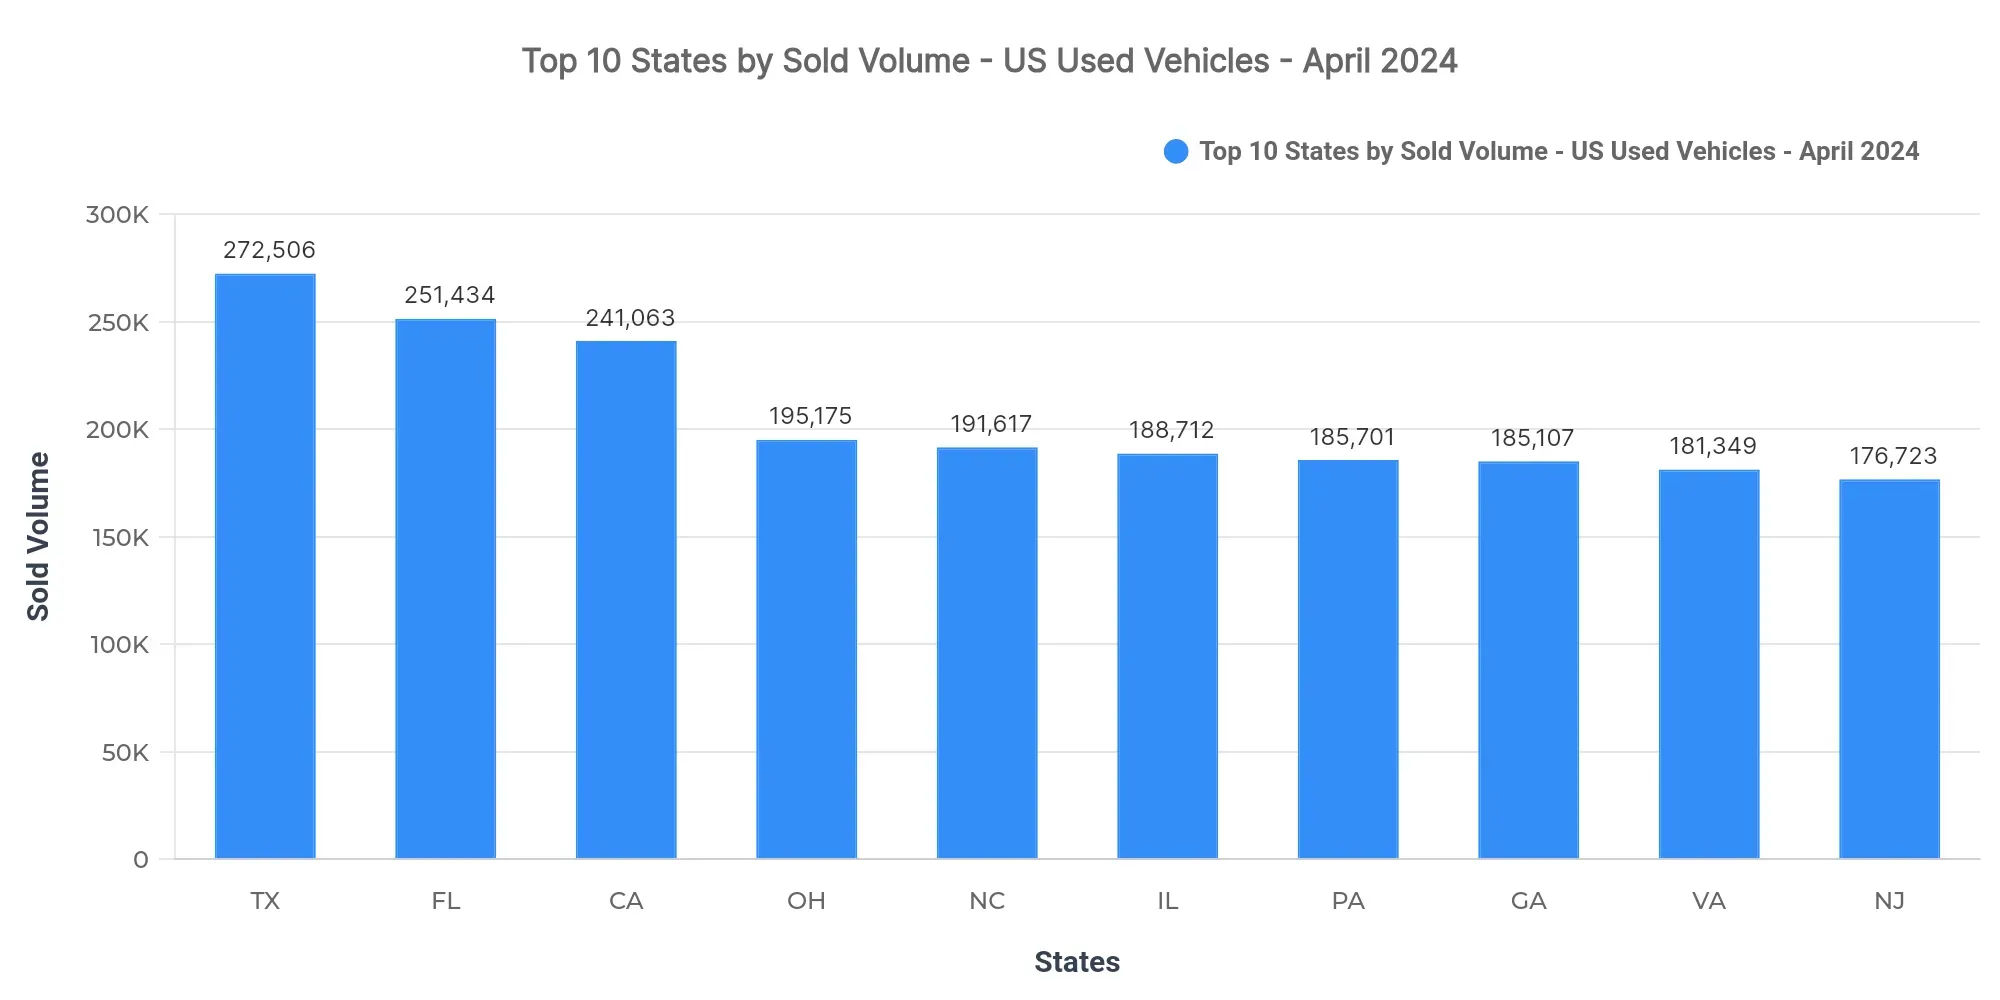
Texas (272,506), Florida (251,434), and California (241,063) lead, contributing a combined share of 11.4% of the national sold volume. The remaining top-10 states are Ohio, North Carolina, Illinois, Pennsylvania, Georgia, Virginia, and New Jersey. This distribution reflects a strong demand in these regions, with significant sales contributing to the local economies.
Market concentration in Texas, Florida, and California highlights the strategic importance of these states in the used car market. Meanwhile, geographical variations in sales volumes suggest that consumer preferences and economic conditions might influence purchasing behavior across the states.
Price Breakdown: Top 10 States by Sold Volume
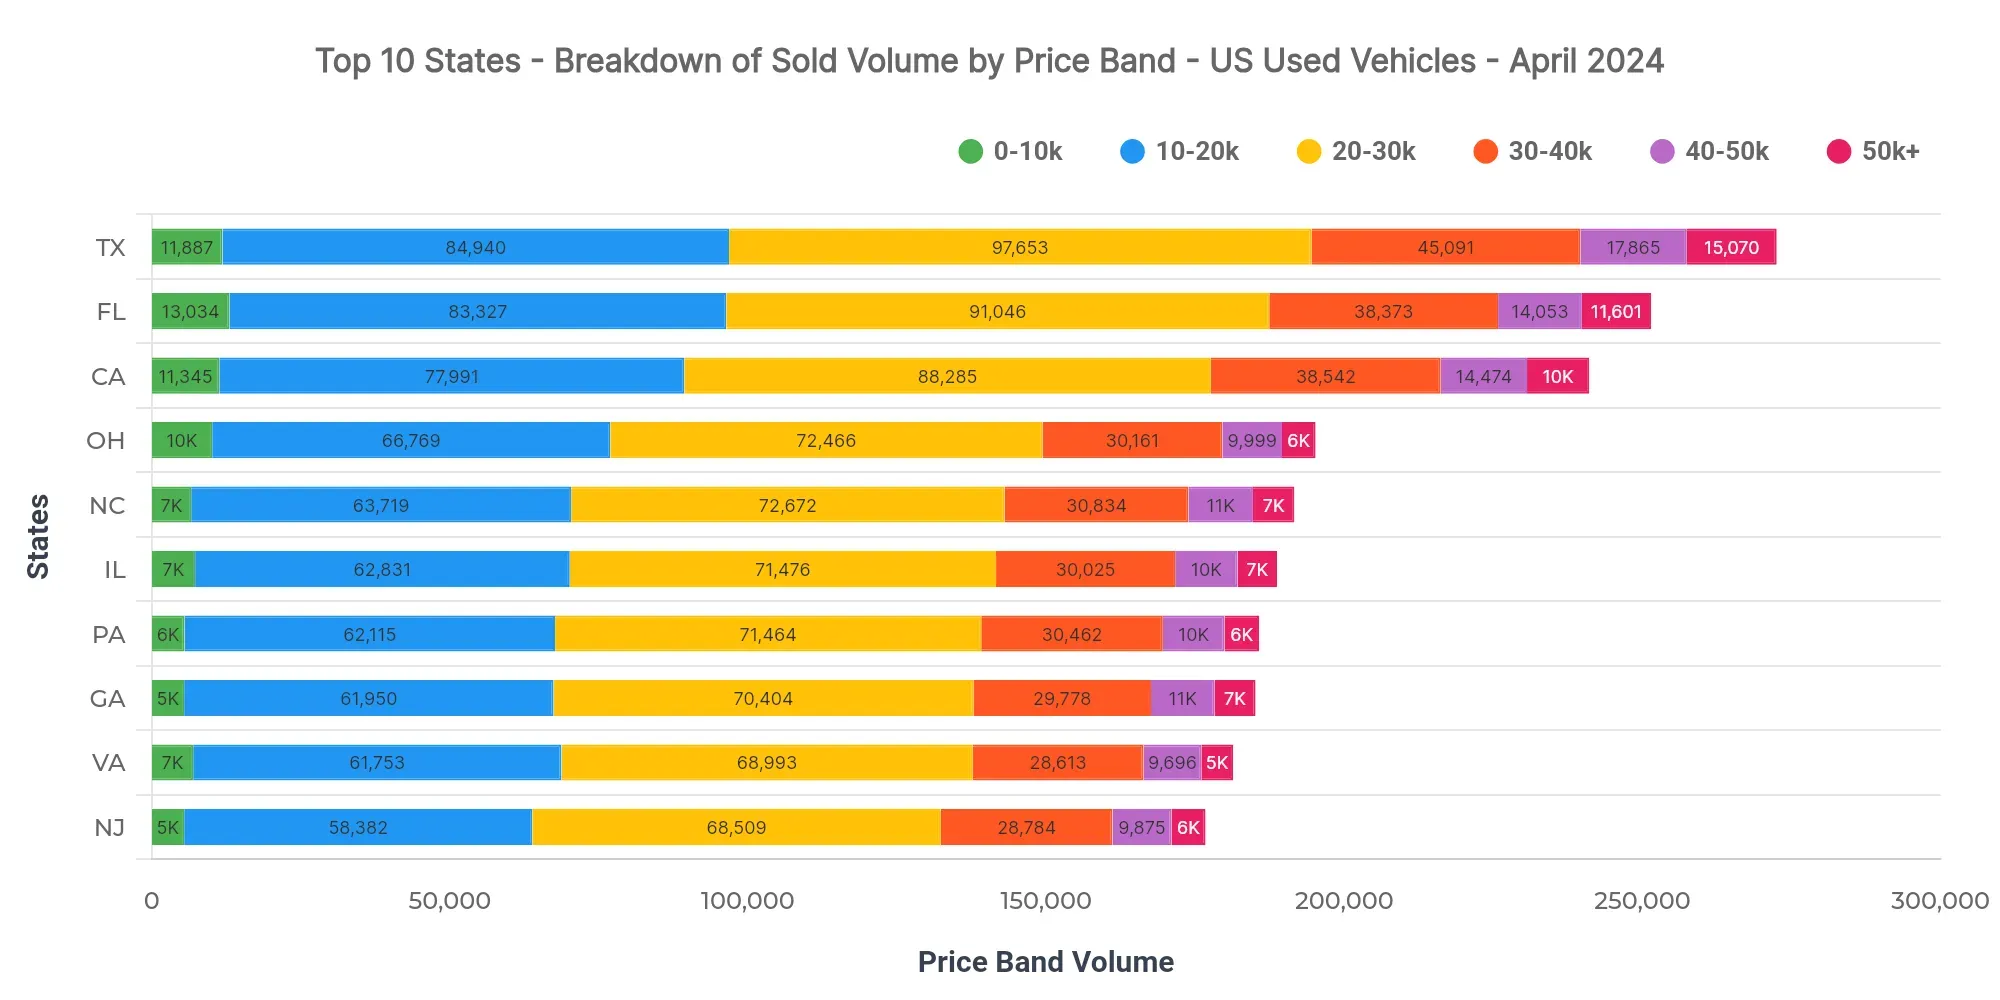
In Texas, the dominant price bands are $20K–$30K (35.8%), $10K–$20K (31.2%), and $30K–$40K (16.5%). There is also a notable $40K–$50K band at 6.6%. Illinois at $26,615 and New Jersey at $26,593 reflect slightly higher average sold prices compared to Texas. Dealers in these states should focus on inventory within these price bands to align with customer demand and optimize sales strategies. For pricing and lending, understanding these price bands allows lenders to tailor financing products that match the prevalent budget ranges of buyers.
Market Breakdown by Fuel Types
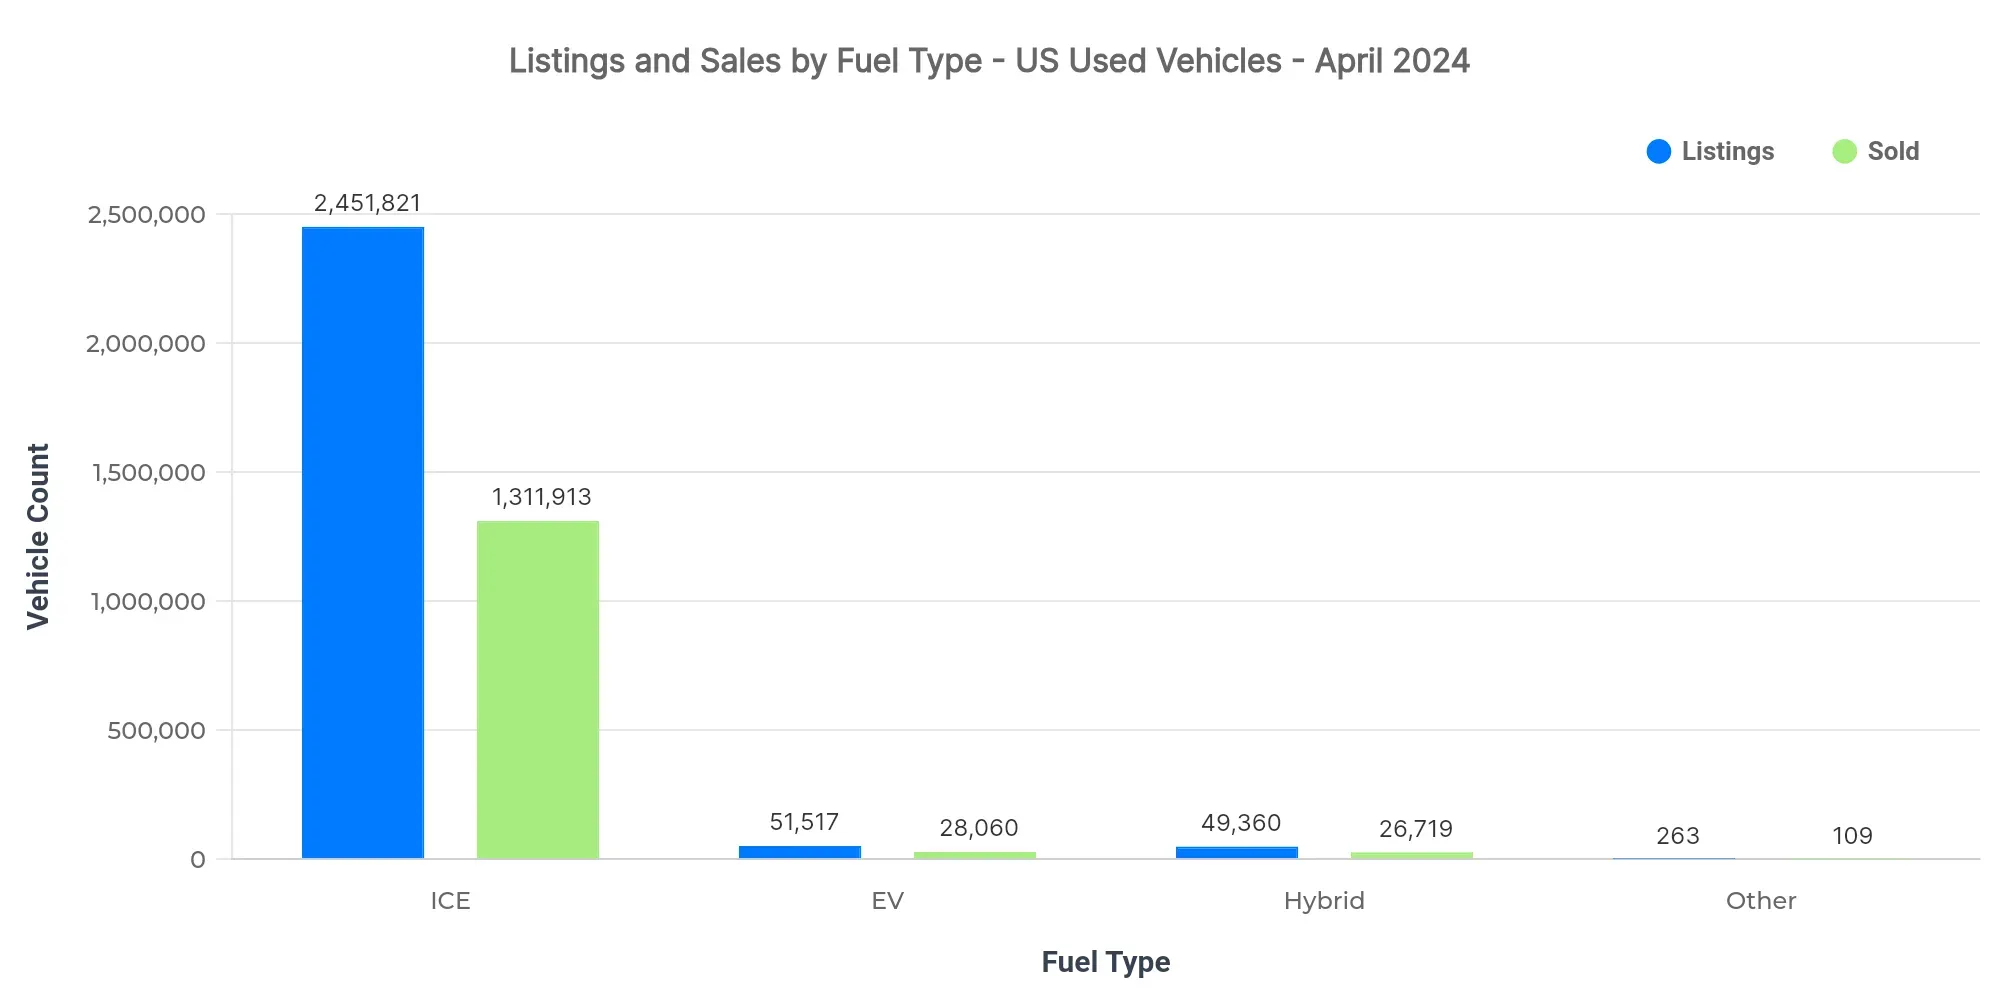
| Fuel Type | Listings Count | Sold Count | Avg Listing Price | Avg Sold Price |
|---|---|---|---|---|
| ICE | 2.45M | 1.31M | $25,730 | $25,705 |
| EV | 51.5K | 28.1K | $33,773 | $31,702 |
| Hybrid | 49.4K | 26.7K | $27,549 | $26,003 |
| Other | 263 | 109 | $17,575 | $15,597 |
- Electric vehicle (EV) adoption remains moderate but with higher average pricing, indicating a premium segment positioning.
- Price positioning reveals that while internal combustion engines (ICE) dominate in volume, EVs and hybrids command higher prices, reflecting demand for technology enhancements.
- Market dynamics suggest ongoing growth in EV and hybrid segments, yet ICE retains a significant lead in volume due to entrenched infrastructure and consumer habits.
Market Share by Body Types
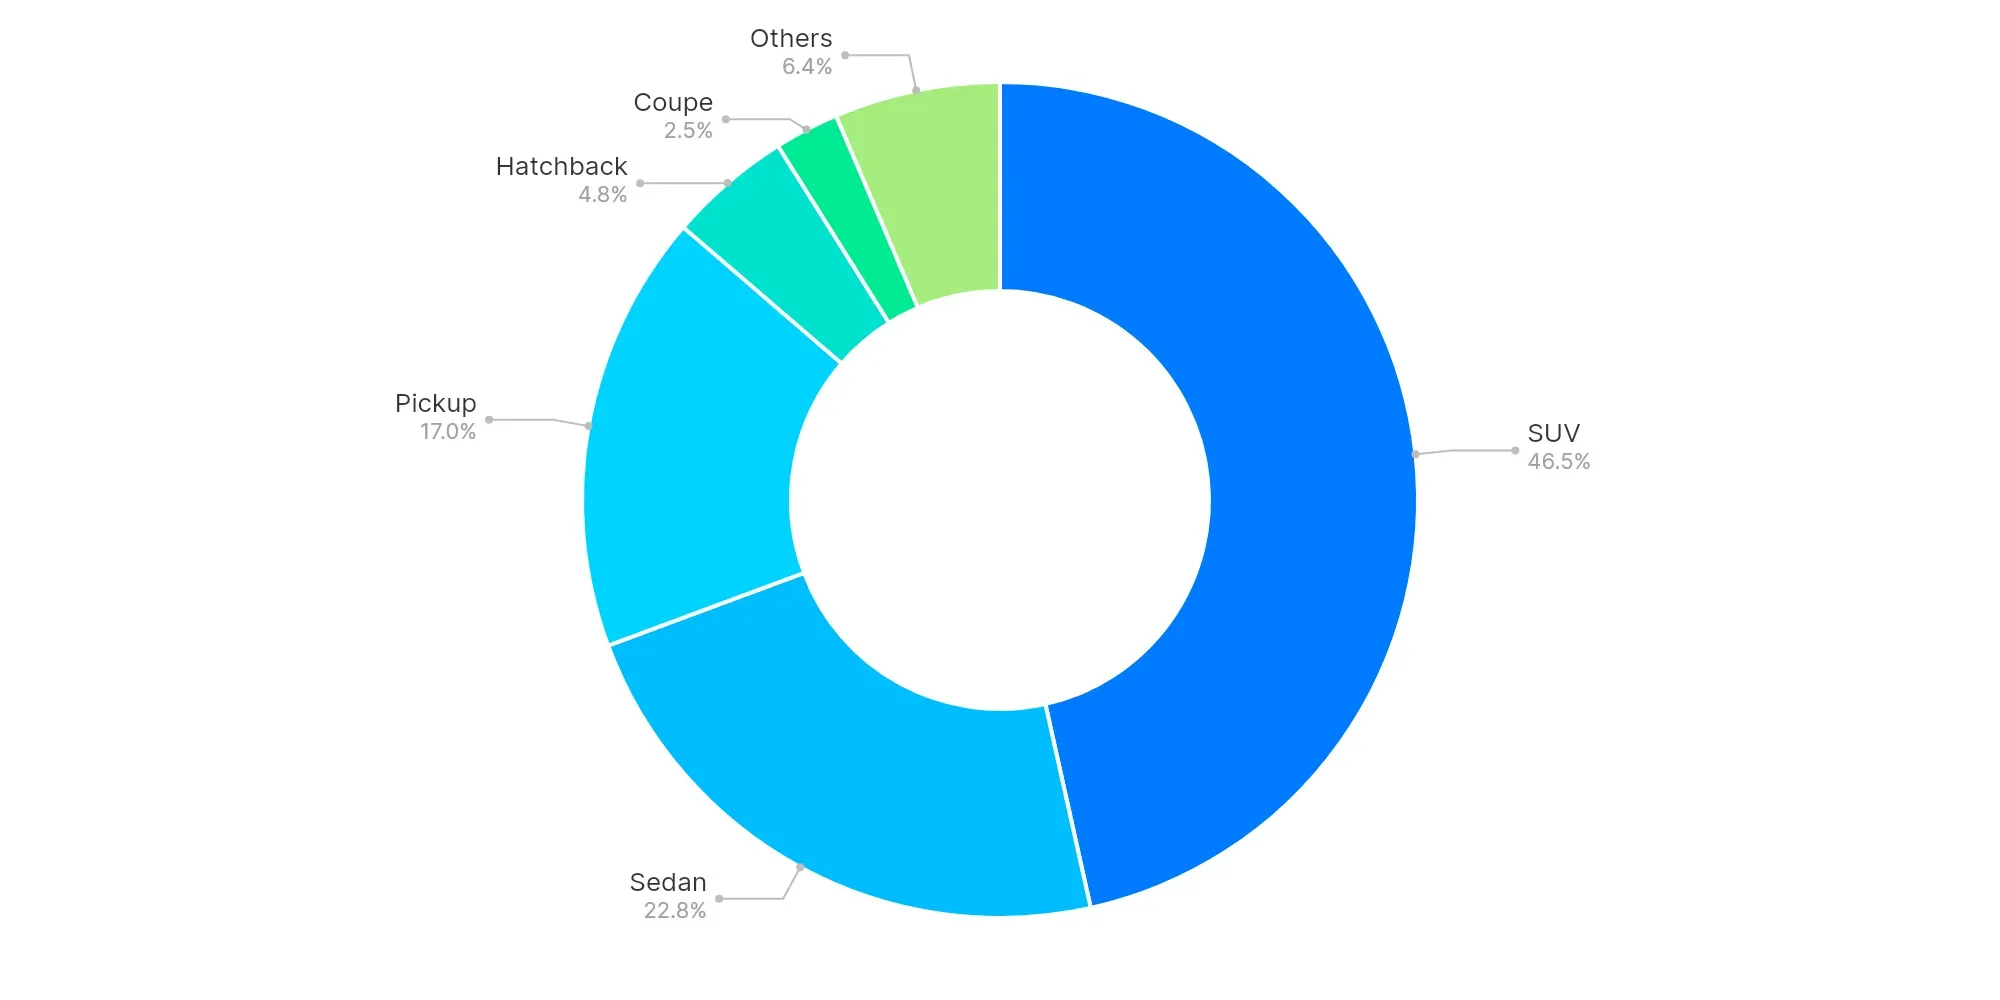
SUVs (46.5%), Sedans (22.8%), and Pickups (17%) dominate the market, with SUVs and Pickups reflecting consumer preference for larger vehicle segments. This trend underlines the importance for dealerships to stock these popular types to meet buyer expectations and capitalize on prevailing consumer preferences for versatile and capable vehicles.
High-Volume vs Low-Volume States (Executive Insights)
- Top-performing states include Texas, Florida, and California.
- Underpenetrated regions are the Virgin Islands, American Samoa, and the Northern Mariana Islands.
- Key price bands are $20K–$30K, $10K–$20K, and $30K–$40K.
- EV trend momentum grows; still trails ICE in volume.
- Buyers show strong inclination towards SUVs and Pickups.
As the market direction steers towards SUVs, EVs, and pricing within the $20K–$30K range, dealers are encouraged to align their strategies accordingly. Analysts should focus on these trends for better forecasting and inventory management to maximize opportunities in emerging and high-demand segments.